Near Term Terminal Area Automation for Arrival Coordination
|
|
|
- Jack Dorsey
- 5 years ago
- Views:
Transcription


1 Near Term Terminal Area Automation for Arrival Coordination Jeffrey Shepley The MITRE Corporation Delay Vectoring for Spacing at Merge Points


2 The Merge Problem 01 Many Aircraft Delay Vectoring Reduced Predictability Reduced Throughput

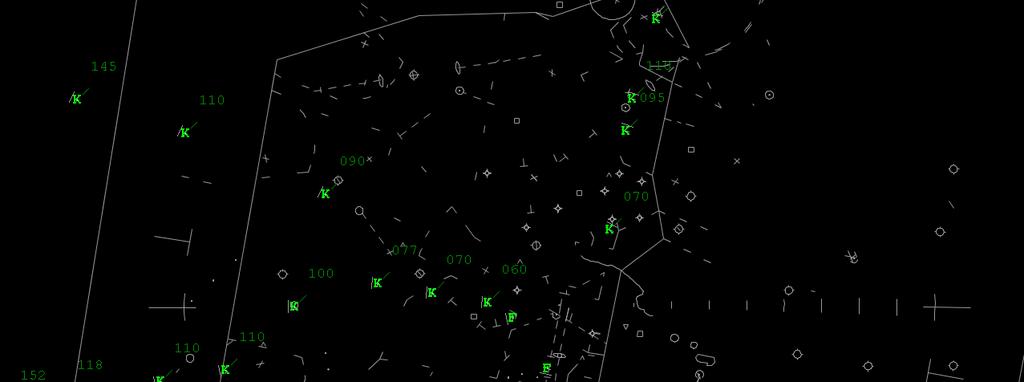
3 Judging Relative Position

4 Current Methods are Inadequate udging Relative Position using range rings and tie points Do not account for RNAV and RNP Paths
 and MinSep tool Do not account for RNAV and RNP Paths Diagram derived from")
5 STARS FSL TCW/TDW Operator s Manual, Revision 9, TI , 8 December 2006, Raytheon Company. Current Methods are Inadequate Judging Relative Position using Predicted Track Line (PTL) and MinSep tool Do not account for RNAV and RNP Paths Diagram derived from STARS FSL TCW/TDW Operator s Manual, Revision 9, TI , 8 December 2006, Raytheon Company.
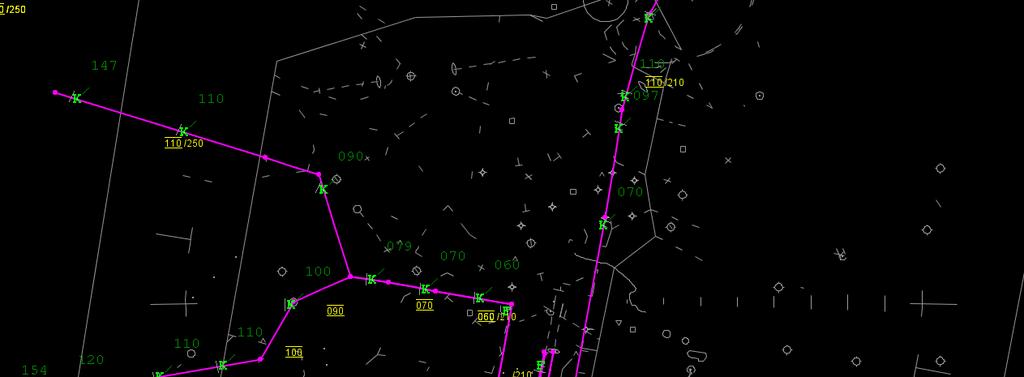
6 Current Methods are Inadequate Judging Relative Position using CRDA Good For straight segments But a simpler solution range rings By this point, there may not be enough distance to utilize speed control


7 Near Term Merging and Spacing Solutions Controllers are responsible for separation Uses current surveillance data as input Does not require any additional equipage or procedural changes in the NAS Supports controllers as they transition to future automation and operations
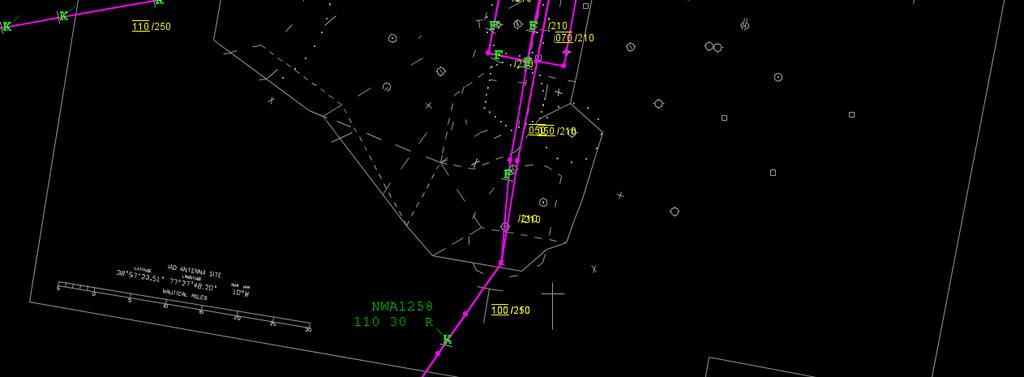
8 Actual Aircraft 10 nm 2 nm A Near term Solution: Relative Position Indicator (RPI) 13 nm 25 nm Merge Point 25 nm 2 nm 7 nm 6 nm Projected Aircraft Indicator 8 nm 2 nm
9

10 Human In The Loop Refinement and Validation Mirror Image Projection Functionality F Aircraft 2 DAL H F F AAL ATA nm Merge F Dynamic Image Offsets SWA F 19 nm Merge AAL F Aircraft 1 AAL O Aircraft 3 F O CJC DAL946 23H DAL946 Indicator 23H Target for 19 Indicator nm Merge Target for 15 nm Merge

11 Human In The Loop Refinement and Validation Functionality Additional Indicator Data Block Information User Interface Color By Application


12 Human In The Loop Refinement and Validation Functionality User Interface Additional Applications and Benefits Analysis


13 System Operations Applications Which runway better accommodates this aircraft?
: (For 30 minute simulation extrapolated to 1 hour) FLM Team #1 (2 hr experience): 4.")
 * $72.")
14 Human In The Loop Simulations Indicated Reduced Delay with RPI Flight time reduction between baseline and RPI (TRACON Boundary to Final Approach Fix): (For 30 minute simulation extrapolated to 1 hour) FLM Team #1 (2 hr experience): 4.5 min 6 sec per a/c FLM Team #2 (2 hr experience): 7.5 min 10 sec per a/c MITRE Contractors (20 hr experience) : 13.2 min 18 sec per a/c Annualized 7.5 min reduced/hour * (3 peak hours/day) * $72.13 per/min * 365 days/yr = approx $600,000/yr Baseline RPI
15 Preliminary Benefit Estimate of more Efficient Merges Up to $100 Million/year in delay reduction possible at top 35 airports in US About $1 3 Million/year for most top 35 airports a T day Daily minutes of delay reduction with RPI for airport, a a N d Number of flights in delay group, d, for airport, a a D d Average distance flown by flights in delay group, d, for airport, a a V d Average ground speed of flights in delay group, d, for airport, a 20 flights 3-4 nm 250 kts KLAX 40 flights 4-6 nm 195 kts a day = d N a d D Vd a d a T. Track Data from 5 October 2006 Other benefits may also exist Increased controller productivity Decision support to enable Optimized Profile Descent (OPD) operations More precise time to runway estimates for Traffic Management Advisor (TMA) 30 flights 4-7 nm 210 kts
16 Actual Aircraft 10 nm 2 nm Questions 13 nm 25 nm Merge Point 25 nm 2 nm 7 nm 6 nm Projected Aircraft Indicator 8 nm 2 nm
17 Disclaimer The contents of this material reflect the views of the author and/or the Director of the Center for Advanced Aviation System Development. Neither the Federal Aviation Administration nor the Department of Transportation makes any warranty or guarantee, or promise, expressed or implied, concerning the content or accuracy of the views expressed herein.