Production and design services provided by: Lauerer Markin Group Thread Information Design Strategy support provided Great Lakes Marketing
|
|
|
- Nora Harvey
- 5 years ago
- Views:
Transcription

1 Market Analysis
2 Production and design services provided by: Lauerer Markin Group Thread Information Design Strategy support provided Great Lakes Marketing
3 CoBA6 We finally have the CATALYST (global sourcing)!! Unrealized potential and underutilized assets Emergence of global sourcing + = Leadership & Global Logistics
4 Slide 3 CoBA6 College of Business Administration, 5/17/2006
5 Situational Analysis U.S. transportation system is overwhelmed Passenger vehicle traffic will increase 50% by 2030 Freight traffic will increase by 50% by 2020 Cannot build enough highways and rail to meet demand China to become top US trading partner within three years Imports from Asia/China Doubling by Exponentially shifting to high-value, time-sensitive goods Asian exporters (and U.S. DOT) deeply concerned about US distribution bottlenecks
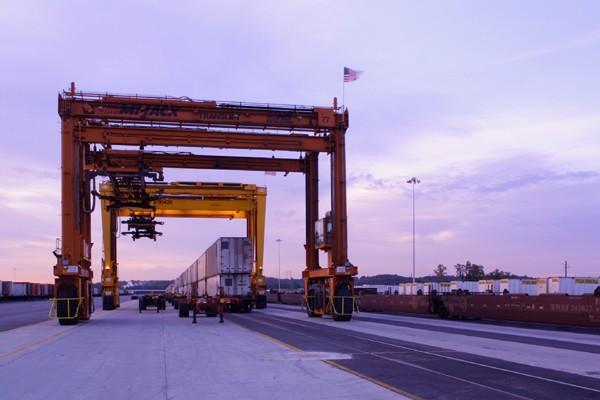
6 Situational Analysis Trucking industry is challenged by: New hours of service rules High cost of fuel Shortage of drivers and equipment Increased costs of drayage/cartage Increased highway congestion Port throughput and efficiencies are enhanced by a transfer of product from boat to rail Rail transport to the distribution centers requires an intermodal/rail ramp
7 Situational Analysis U.S. Dept. of Transportation America's freight network is a lifeline for our nation's manufacturers, farmers and businesses Norman Mineta, U.S. Secretary of transportation March 2003 The JOURNAL of COMMERCE The solution for U.S. businesses will require lots of money, said Eskew, but that money should be targeted strategically using a holistic strategy. By that, Eskew means taking into account how all air-, ground- and water-based transport systems work together and increasing the integration of the different modes. All the port capacity in the world won t prevent bottlenecks if there isn t enough rail freight capacity on which to unload the ocean shipments, Mike Eskew
8 Situational Analysis U.S. Dept. of Transportation Understanding the nature of freight flows will help ensure our ability to remain competitive in the global marketplace and to continue to meet the economic and transportation challenges of the 21st century." The agency is estimating that by 2020 America's transportation system will handle cargo valued at almost $30 trillion, compared with $9 trillion today. Volumes, in tons, will increase by almost 70 percent over the current 15 billion tons. The department also says that international freight volumes will almost double by As a result, each state will experience large freight volumes on its transportation infrastructure over the next 20 years, with the potential for increased congestion and greater inefficiencies throughout the nation's transportation system.
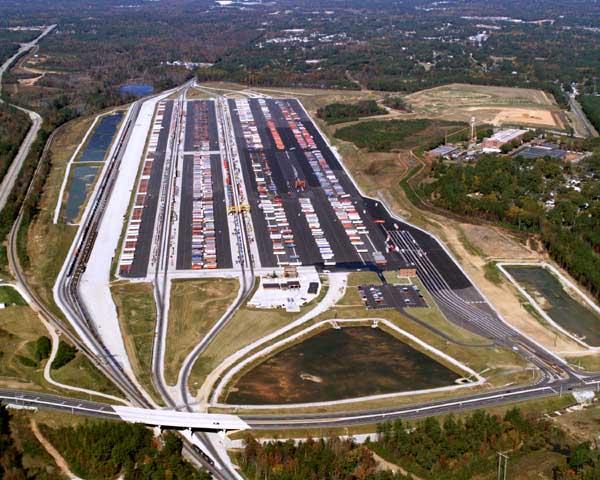
9 Planning Containerized intermodal transportation and distribution is the key strategy for the future Transportation terminals must be either retro-fitted or newly developed to handle intermodal traffic Retro-fit is time consuming and expensive Green/brownfield development is recommended
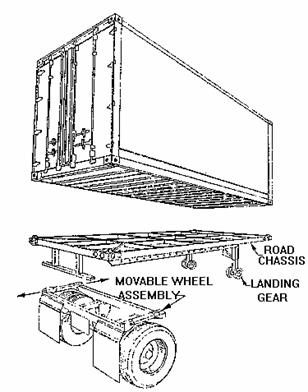
10 Shipping Containers International shipments (except for bulk goods) are delivered by shipping containers Shipping containers require significant maneuvering and staging areas with specialized material handling equipment Single source, port-to-door routing from manufacturer to distributor is often desired
11 Points of Congestion West Coast ports anticipate double-digit container growth, fuel costs are climbing to all time highs, and capacity is tight. Concerns abound that increasing volume will compound existing infrastructure problems and further expose intermodal disconnects, labor strife, driver shortages and the cost of moving product in highly congested areas Many importers, contract manufacturers, and retailers are considering strategic, long-term measures to alleviate stress in their supply chains by creating more reliable transportation options. Inbound Logistics June 2005
12 North American Coastal Ports Primary West Coast Ports 1. Port of Los Angeles 4,874,730 TEUs 2. Port of Long Beach 3,764,257 TEUs 3. Port of Vancouver 1,664,906 TEUs 4. Port of Oakland 1,197,331 TEUs 5. Port of Seattle 1,049,105 TEUs 6. Port of Tacoma 940,638 TEUs TEU = Twenty Foot Equivalent Unit

13 Alternative Investment Example at Vancouver

14 Holistic Approach Intermodal Transfer

15 Holistic Approach Intermodal Transfer
16 Flow Re-distribution

17 Flow With an industrial park adjacent to rail ramps, containers can be shuttled (via hostlers) directly from the train to the facility For industrial locations in the area, but not adjacent, a short dray or even a longer cartage still provides operating economies of scale and savings

18 Cargo Airport Combined with rail and truck, air cargo ground operations become extremely efficient Enables operators to provide full-service options to customers who have combinations of time sensitive cargo as well as bulk shipments

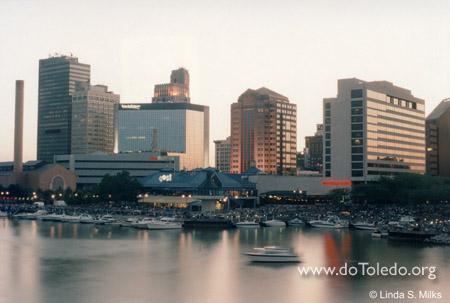
19 Service from California Toledo
20 Maritime Distance Shanghai Yantai Xiamen Hong Kong Prince Rupert** Vancouver** Los Angeles* 2, miles 4, kilometers 2, miles 4, kilometers 3, miles 5, kilometers 3, miles 5, kilometers 3, miles 5, kilometers 3, miles 5, kilometers 3, miles 5, kilometers 3, miles 5, kilometers 3, miles 5, kilometers 3, miles 5, kilometers 3, miles 6, kilometers 3, miles 6, kilometers *2-3 more days at sea to LA and 2-3 more days return **Rapidly growing in capacity and importance
")
21 Modernized Flow (example) Toledo
22 Value of Lake Erie West Region Incomparable location Existing infrastructure Complete transmodal capability Anchor clients already here or nearby Central to North American industrial sector

23 Access to Markets Toledo 300 Mile Radius
24 300 Mile Demographics 2005 Population Estimate 49,415,140 Estimated Median Age Estimated Average Age Estimated Average Household Income $62,611 Estimated Per Capita Income $24,532

25 Example: Automotive Industry This 300 mile (500 KM) radius contains: 37 of 64 assembly plants in the US and Canada 126 of the top 150 OEM supplier headquarters and over 60% of their facilities in the US and Canada The destination of more than half of all imported automotive parts China is becoming top-tier one supplier to US
26 Value Proposition for Global Logistics Logistics hub for global sourcing Existing and growing need Embedded supply chain Rapidly growing customer demand Distribution solution based execution Low-hanging fruit Built-in Opportunity
27 Potential As supplier locations change, identifying and securing the optimum distribution point(s) becomes paramount for long-term, cost-effective logistics A strategically located transportation/logistics hub, with rail ramps offering more efficient global connectivity, will bring a distinct, substantial, and NECESSARY competitive advantage to regional industrial base
28 Improved Service Levels Faster/Cheaper Excellent Capacity Usage Customer Direct Multi Modal Redistribution Vision Lake Erie West Hub Controlled Border Embedded Supply Chain Maximum Efficiency Secure
29 Points of Differentiation Coastal Port Landed goods Shipper to port Ocean specific Multi-modal support Customer-dependent supply chain National security issues Lake Erie West Hub Redistribution Customer direct Unlimited geography Multi-modal integration Embedded supply chain Controlled borders
30 CoBA2 CoBA3 Strengths Lack of congestion Slot-free airport Exclusive airspace for Toledo, not dependent on Detroit or Cleveland Access to global markets via air and water Railroad with capacity available in existing rights of way Minimal highway congestion
31 Slide 29 CoBA2 College of Business Administration, 5/17/2006 CoBA3 College of Business Administration, 5/17/2006

32 Elements of the Lake Erie West Global Logistics Hub
33 Strategies Develop vision Prepare situation analysis Define value proposition Define internal partners Define external strategic partners Plan for long-term development Develop promotional campaign
34 MARKETING ID EXTERNAL PARTNERS LONG TERM DEVELOPMENT PLAN VISION Situational Value Internal Analysis Proposition Partners
35 Strategy Execution Vision Conduct moderated planning sessions for situational analysis, development of value proposition and identification of internal partners This must yield an overall, mutually agreed-upon strategic foundation
36 Strategy Execution ID external partners Identify major, ramp-based commercial developers/investors Develop plan to establish anchor clients such as: FedEx, UPS, BAX/Schenker, DHL, Yellow Freight, etc.
37 Deal-Flow Analysis Definition Existing Asset Use Strategy Alignment New Customers New Revenue New Jobs Percentage of re-use Alignment with vision Potential to attract new customers New sources of revenue New jobs created Desirability of co-use Regional impact
38 Deal-Flow Analysis Example: Heartland Hub 100 Existing Asset Use Strategy Alignment New Customers New Revenue New Jobs
39 Deal-Flow Analysis Score Add the points = Must execute = Prioritize = Look for improvements = Low probability for success; potential threats
40 Impact Analysis 20% 5% 15% Proportional impact at each phase Heartland Hub 30% 30% Gatekeeper Influencers Value Adders Users Implementers
41 Gatekeeper Asset Management Decision Maker For example: Port Authority
42 Influencers Regulatory Impact Specific Execution Impact on Funding For example: TAGNO Toledo Mayor s Office Port Authority Chamber of Commerce LCIC
43 Value Adders Provide support services Greatest potential to differentiate our hub For example: Maintenance providers Fuel depot
44 Users Generate Revenue For example: Anchor clients Distribution companies
45 Implementers Develop and Operate Assets For example: Investors Developers Operators
46 Phases of Impact Analysis Start-up Phase Development Phase Marketing Phase Usage Phase Enhancement Phase
47 Phases of Impact Analysis Start-up Phase 30% 5% Heartland Hub 30% Gatekeeper Influencers Value Adders Users Implementers 5% 30%
48 Phases of Impact Analysis Development Phase 10% 40% Heartland Hub 10% 20% Gatekeeper Influencers Value Adders Users Implementers 20%
49 Phases of Impact Analysis Marketing Phase 20% 10% Heartland Hub 35% Gatekeeper Influencers Value Adders Users Implementers 15% 20%
50 Phases of Impact Analysis Usage Phase 10% 5% 5% 50% Heartland Hub 30% Gatekeeper Influencers Value Adders Users Implementers
51 Phases of Impact Analysis Enhancement Phase 20% 25% 20% Heartland Hub 15% Gatekeeper Influencers Value Adders Users Implementers 20%
52 Near Term/Mid Term Process Finalize Vision/Value proposition Engage investors/developers Identify target segments Develop promotional campaign
53 Improved Service Levels Faster/Cheaper Excellent Capacity Usage Customer Direct Multi Modal Redistribution Vision Heartland Hub Controlled Border Embedded Supply Chain Maximum Efficiency Secure
54 Points of Differentiation Coastal Port Landed goods Shipper to port Ocean specific Multi-modal support Customer-dependent supply chain National security issues Heartland Hub Redistribution Customer direct Unlimited geography Multi-modal integration Embedded supply chain Controlled borders
55 Engage Investors/Developers Identify transportation/distribution investors Entice large-scale institutional money Motivate rapid development/expansion Assist in their business development
56 Identify Target Segments Initial focused geographical development China inbound China outbound Integration with Canadian ports Automotive industry service Leverage complementary ports
57 Deploy Promotional Campaign Engage federal/state government partners Develop image and brand Gain local commitment from strategic partners Build external awareness Engage investment partners
58 Critical Success Factors Speak with one voice Internal unity Clearly define roles and responsibilities Secure long-term commitments Execute vision in steps Work toward a series of continuous victories Communicate successes Adapt to market influences Monitor response/impact Adjust execution accordingly Make sure everybody wins Share the rewards/recognition Ensure continuous reinvestment
59 Select Implementer Toledo Port Authority Pursue Partners Toledo Port Authority