Land Between the Lakes National Recreation Area Safety Management Pilot Project Overview
|
|
|
- Clarence Bryan
- 5 years ago
- Views:
Transcription

1 Land Between the Lakes National Recreation Area Overview September 17, 2014
2 Purpose FHWA and US Forest Service Ability to use electronic law enforcement crash records Identify safety hot spots including those without a history of crashes Develop business practices for investigation/ recommendation / improvements of safety related issues Land Between the Lakes Comprehensive investigation and review of all safety related issues identified at the LBL Recreation Area Identify and recommend low cost safety improvement projects

3 Land Between the Lakes U.S. Forest Service - National Recreation Area Kentucky and Tennessee 2 Million Visitors per Year 170,000 Acres 733 Miles of Roads (Total) 359 Miles of Roads (Maintenance level 3-5) Dedicated Law Enforcement Unit
4 Stakeholders U.S. Forest Service Land Between the Lakes Facilities Law Enforcement Federal Highway Administration Eastern Federal Lands Highway Division Kentucky Division Office Tennessee Division Office Kentucky Transportation Cabinet Tennessee Department of Transportation
5 Project Milestones Stakeholder workshop to discuss approach and safety issues Interviews and data collection LBL staff interviews for high potential crash locations LBL Law Enforcement Incident Management Accident Reporting System (LEIMARS) Kentucky and Tennessee crash reports GIS mapping information Week long field review with interdisciplinary team Project prioritization and safety management system Stakeholder workshop to review recommendations and prioritization
 Crash data collection required multiple site visits, sifting through manual reports, and blacking out sensitive material")
6 Crash Data Challenges Outstanding participation from LBL Forest Engineer and Law Enforcement to identify potential hotspots LEIMARS crash data Lack of electronic records from Forest Service law enforcement Difficulty filtering out protected personal information (PPI) Crash data collection required multiple site visits, sifting through manual reports, and blacking out sensitive material Restrictions from states on level of detail they could share Relied on DOT safety engineers to black out sensitive information
7 GIS Mapping Crash inventory provide for multiple views, including: Crash severity, animal strikes, stuck vehicles, data sources, etc. Supplemented with many discussions to identify potential safety hot spots
8 Hot Spot Identification Twenty-five hot spots identified Reviewed with LBL staff and interdisciplinary field review team Additional locations identified and added during field review

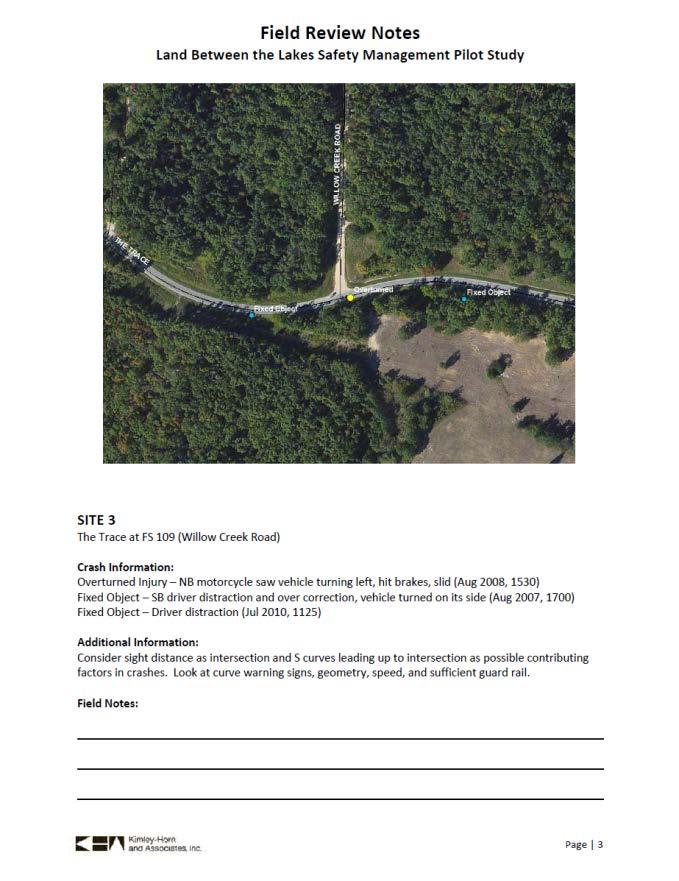
9 Field Review


10 Field Review
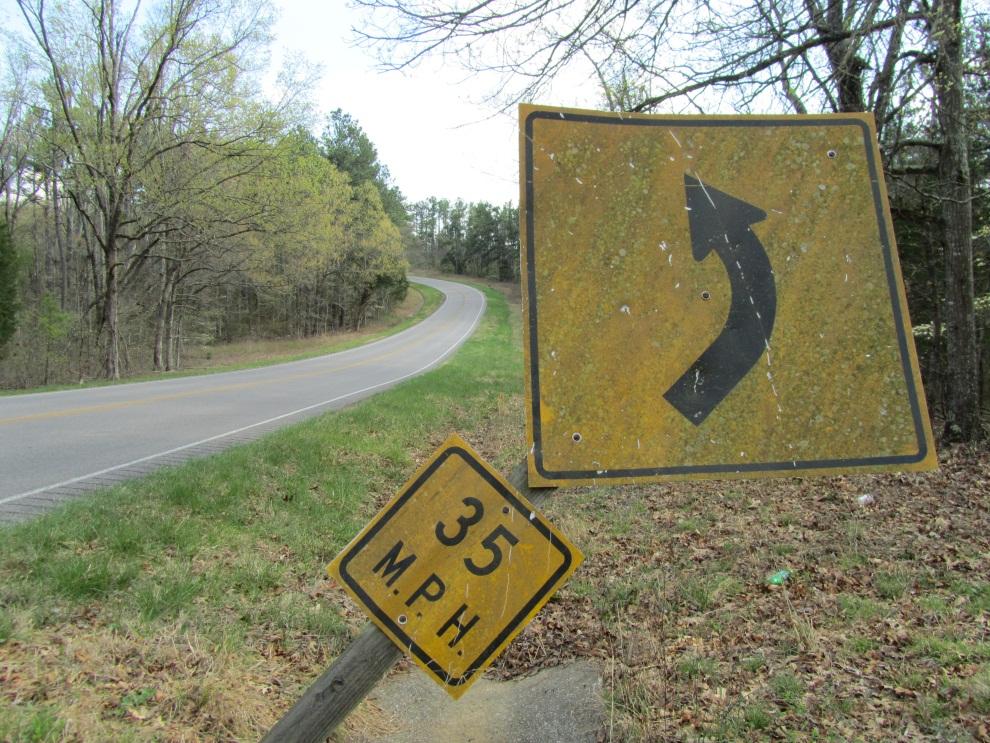

11 Signs


12 Pavement Markings
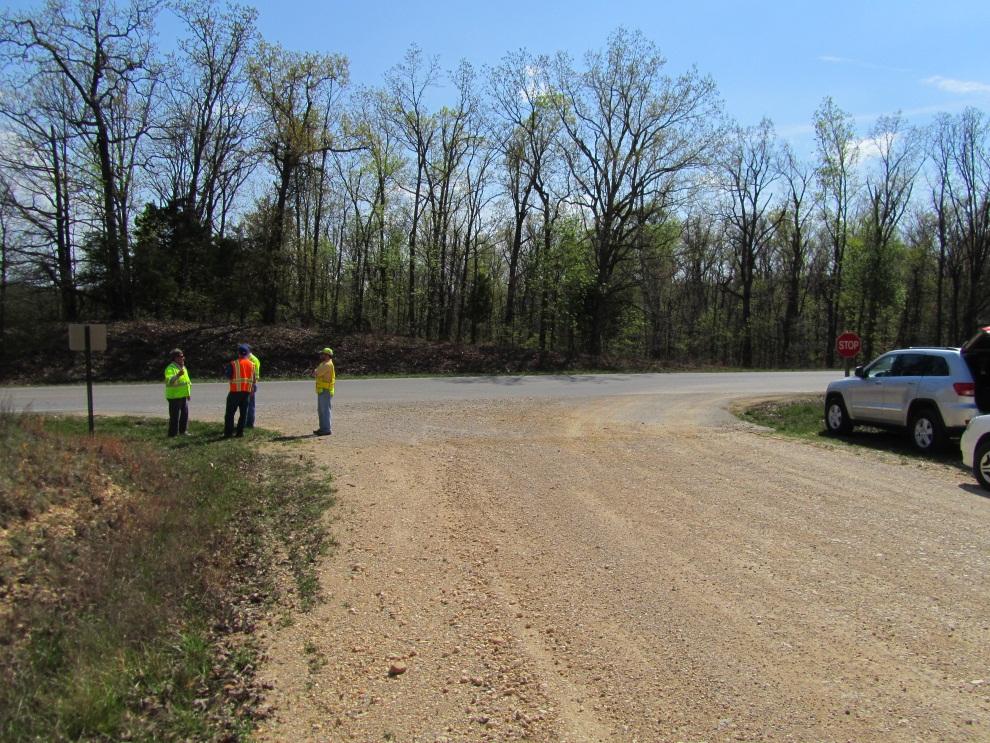

13 Gravel

14 Lack of Curve Warnings/Advisory Speeds
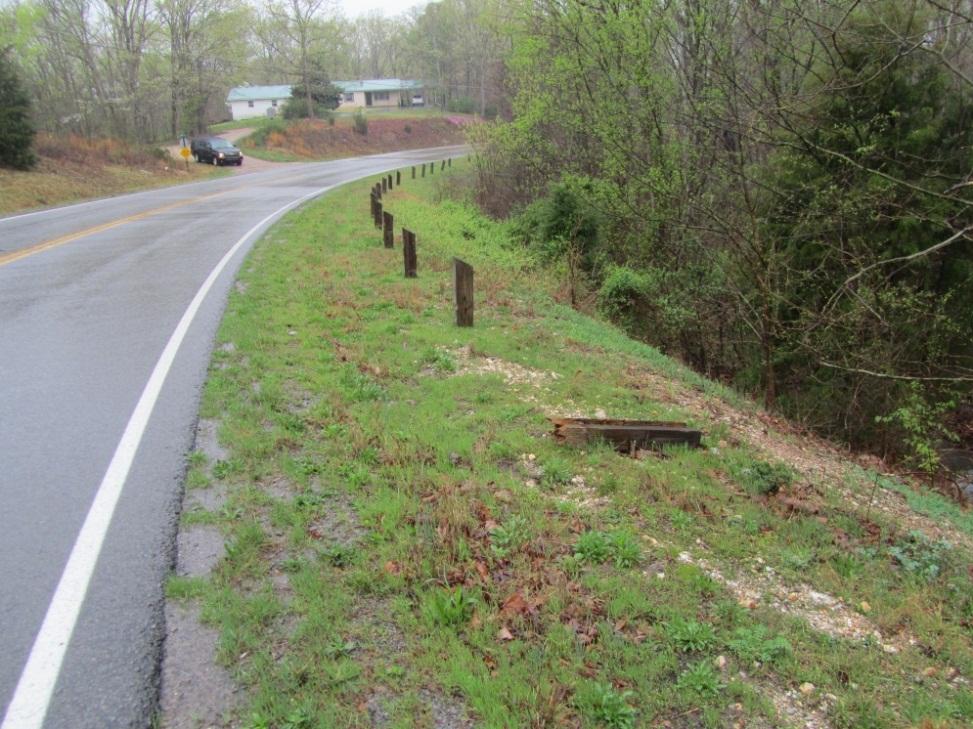
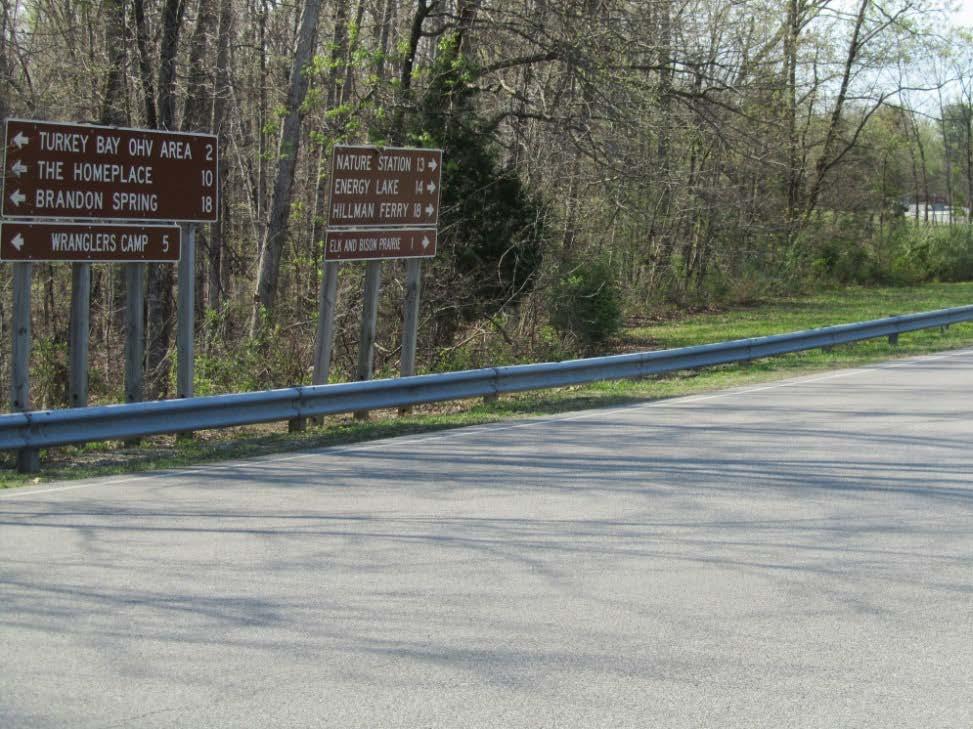
15 Guardrail

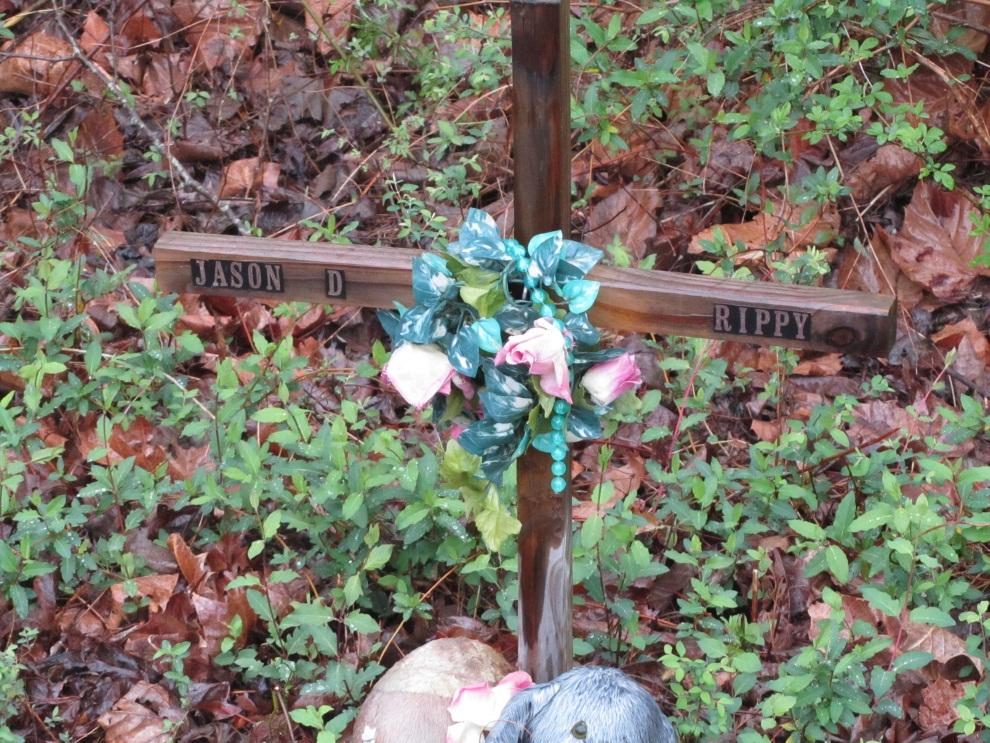
16 Other Safety Concerns

17 Collaboration was the Key to Success

18 Results Table 6 Summary of LBL Hot Spot Recommendations, Priority, and Costs
19 Results Site 22 Improvement Costs Short Term Quantity Long Term Quantity Improvements Units Unit Cost Short Term Cost Site Improvement Costs Install Sign and Pole EA $ $2,000 $0 Remove Sign and Pole EA $ $150 $0 Install 24" Solid White Stop Line LF $ $360 $0 Install White Edge Line LF $ $100 $0 Install Yellow Center Line LF $ $100 $0 Install Guardrail LF $17.00 $0 400 $6,800 Install Guardrail End Terminal EA $3, $0 8 $26,400 Long Term Cost Misc. (Engineering, mobilization, traffic control, etc.) 40% $1,080 $13,280 Project Cost Summary Short-Term Cost / Long-Term Cost $3,790 $46,480 Total Site Improvement Cost $50,270
20 Results Table 4 LBL Hot Spot Prioritization and Costs Priority Site Location Short-Term Cost Long-Term Cost Total Cost 1 22 Fort Henry Road at FS 206 $3,790 $46,480 $50, The Trace between FS 109 and FS 111 $700 $105,000 $105, The Trace at FS 109 $65,695 $64,750 $130, The Trace between Boyd Road and Harris Road $93,940 $0 $93, Fort Henry Road between The Trace and FS 206 $700 $0 $ The Trace between FS 112 and FS 113 $770 $0 $ The Trace at FS 214 $3,850 $39,235 $43, TOTAL $324,985 $7,391,090 $7,716,075
21 Results Table 5 LBL Hot Spot Cost by Type of Improvements Priority Site Location Signing Pavement Marking Guardrail Paving Other 1 Total Cost 1 22 Fort Henry Road at FS 206 $3,010 $784 $46,480 $0 $0 $50, The Trace between FS 109 and FS 111 $700 $0 $0 $105,000 $0 $105, The Trace at FS 109 $1,120 $875 $32,760 $95,550 $140 $130, The Trace between Boyd Road and Harris Road $2,520 $0 $91,420 $0 $0 $93, Fort Henry Road between The Trace and FS 206 $700 $0 $0 $0 $0 $ The Trace between FS 112 and FS 113 $770 $0 $0 $0 $0 $ The Trace at FS 214 $1,260 $595 $23,240 $15,400 $2,590 $43, TOTAL $61,250 $32,963 $217,651 $7,337,750 $66,465 $7,716,075
22 Lessons Learned Crash data collection was the greatest challenge USFS law enforcement moving towards more electronic crash record use Need to have crash record reporting fields that allow filtering of PPI More consistency in state reporting systems will make these types of studies less challenging High potential crash sites gathered through extensive interviews and discussion with LBL staff was critical to supplement crash data Collaboration of stakeholders key for successful site visit Cost presented in several different formats provided flexibility for funding requests Cost for each individual site improvement Cost for short-term and long-term improvements Cost for each type of safety improvement (Signing, Pavement Marking, Guardrail, Paving, Other)
23 THANK YOU! Tom Fowler Kimley-Horn Kevan Paluso USFS Jim Amenta FHWA Eastern Federal Lands