The tidal fluctuation at the site is as follows: Samarinda, Palaran : HWL = +2.65m, LWL = 0.0 m
|
|
|
- Alexia Reeves
- 5 years ago
- Views:
Transcription
1 30.10 Preliminary Engineering Studies Preliminary Design of Port Facilities (1) Design Vessel The proposed container berth is designed to accommodate container ship with maximum capacity of about 5,000 DWT.The proposed design ship has the following dimensions. Container Ship : 5,000 DWT, Overall Length : 110 m Breadth : 15.7 m, Full loaded Draft: 5.5 m An additional depth for the keel clearance is required for the wharf dimension. Assuming 10% of the full loaded draft is needed for the keel clearance, the depth is calculated by the following equation: 5.5 m x m = 6.2m. Here, the wharf depth is determined as 6.5m. (2) Design Conditions and Design Criteria 1) Codes and Standard The design criteria of marine and civil works conform to the following design standards and references: - Standard Design Criteria for Ports in Indonesia, Technical Standards for Port and Harbor Facilities in Japan, ) Design Criteria The details of major design criteria for Master Plan are summarized in Table ) Tide (3) Layout Table General Design Criteria Samarinda Palaran Existing Port Passenger Berth Seismic coefficient Load on berth 3t/m 2 3t/m 2 2t/m 2 Load on yard 4t/m 2 4t/m 2 2t/m 2 Truck T-20 T-20 T-20 RTG on yard Max.32t/wheel - - Gantry Crane on berth Max 45t/wheel Crane 25t - Berth top elevation Berthing velocity of ship 15cm/sec 15cm/sec 15cm/sec Subsoil condition - Silty sand - Assuming depth of hard strata -40m~-15m -38m -38m The tidal fluctuation at the site is as follows: Samarinda, Palaran : HWL = +2.65m, LWL = 0.0 m 1) Palaran The new container terminal development is planned at Palaran site, where a timber 30-68
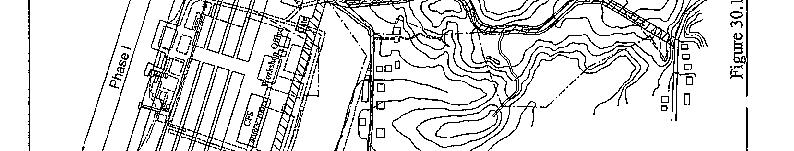
2 factory is currently located. However, this study assumes that land acquisition of the site is possible. In this study, two alternatives for the construction of four or six berths were analyzed. In the case of 4 berths development, container berths having 500 m total length with 22 m width and retaining wall for the yard behind the berths are planned in three construction phases. The southern area of the berths is allocated for the container yard with related facilities. In the case of 6 berths development, three container berths having 375 m total length with retaining wall and container back yard with facilities are proposed in the first construction phase. Then, three container berths of 125 m length with retaining wall and container yard behind the berth are planned in phases II, III and IV. The major facilities and container handling equipment in the master plan for Palaran are summarized in Table The general layouts are shown in Figures and Table Facilities and equipment for Palaran 6 berth case, (4 berth case) Facility Descriptions Phase I Phase II Phase III Phase IV Container Berth 125m x 22m 3 unit (2) 1 unit (1) 1 unit (1) 1 unit Retaining Wall Sheet piles with 375m (250) 125m (125) 125m (125) 125m Tie- rod Yard Pavement T-20 79,400m 2 26,500 m 2 26,500 m 2 26,500 m 2 (68,500) (24,000) (24,000) RTG Lane 1.5m width, RC 4,950 m 2 1,650m 2 1,650m 2 1,650 m 2 beam (4950) (2475) (2475) Container sleeper 1.5m width, RC 6,425 m 2 2,142m 2 2,142m 2 2,142 m 2 beam (6425) (3213) (3213) CFS 100m x 40m 4,160 m (3,520) 4,160m 2 (4800 ) Workshop R.C 1,200 m 2 ( ) Terminal Office R.C 800 m 2 ( ) Access Road Terminal Access 30,500 m 2 ( ) - (368 m 2 ) (368 m 2 ) Utilities Power, Water, L.S ( ) L.S ( ) L.S ( ) L.S ( ) Drainage, etc. Equipment Capacity Phase I Phase II Phase III Phase IV Quay Gantry Crane 12m-span, 3 units (2 1unit (1unit) 1unit (1unit) 1unit 22m-reach, 17 units) m-height, 44-ton RTG 6-lanes, 1 over 4, 6 units (4 2unit (2unit) 2unit (2unit) 2 units 35-ton units) Yard Tractors 20, units (8 4unit (4unit) 4unit (4unit) 4 sets units) 2) Samarinda Existing Port A new general cargo berth is proposed between the existing berths of Samarinda Port. The new berth is 175m in length and 15m in width. The retaining wall of steel sheet piles and anchor facilities for the yard behind the berth will be installed and 30-69
3 connected with the existing wall. The retaining wall is about 75m in length. In addition to the berth construction, the existing buildings (such as three old warehouses, office buildings for related sectors and passenger terminal building) are to be demolished. Then, two new warehouses and a new combined office building for the port administration are planned in the port yard behind the berth. The existing passenger terminal will be transferred to the southern area of the existing port, which requires 9,000 m 2 including car and bus parking. A new passenger terminal building having floor area of 3,200 m 2 is planned at this area. A new passenger berth with a platform 40 m long and two mooring dolphins are planned in front of the new terminal. The major facilities and cargo handling equipment in the master plan for the existing Samarinda Port are summarized in Table Table Facilities and equipment for Samarinda Port Facility Descriptions Existing Port Passenger Terminal Cargo Berth 175m x 15m 1 unit - Retaining Wall Sheet piles with Tie- rod 75m 100m Yard Pavement T-20 10,500m 2 - Warehouse 130m x 26m 2 units - Office R.C (3F) 1,200 m 2 Passenger Berth Platform 40m, Trestle 30m - 1 unit Mooring Dolphin 50 t ( 5m x 5m) - 2 units Passenger Building 20m x 80m (2F) - 3,200 m 2 Parking Pavement T-16 7,400 m 2 Utilities Power, Water, Drainage, L.S L.S Sewerage Equipment Capacity Existing Port Phase I Phase II Mobile Crane 25 t 3 units 3unit Forklift 7 t Diesel 10 units 10 units The general layout for existing Samarinda Port and new passenger terminal are shown in Figures and respectively

4
5
6
7
8 (4) Design of Port Facilities 1) Container Berth for Palaran and General Cargo Berth for existing Port The container berth for Plaran is designed as RC deck structure supported by steel pipe piles. Steel pipe piles are to be driven into the sand stone layer (N value > 50, assuming the depth of pile = -40m ~ -15m). The same diameter of vertical piles and coupled batter piles are used as a foundation of the deck structure. Crane rails will be installed just above the deck to withstand the weight of the gantry crane. In order to retain the reclamation fill for the terminal yard, a steel sheet pile wall will be installed behind the berth. The steel sheet pile wall will be supported by anchor wall and tie-rods. The general cargo berth and retaining wall for the existing Samarinda Port will also be a similar structure as the container berth; however, the diameter of the piles and scale of the RC deck will be smaller. Considering the deep bearing soil stratum at existing port area, supportive foundation piles, which make use of the frictional subsoil resistance, will be more economical. The piles will be driven into 38m under LWL. The typical section of the berth is shown in Figure ) Pavement (Road, Container yard and General cargo open storage) Roads and areas subject to paving works are listed as follows: - Container storage areas and general cargo open storage - RTG runway beam (RTG Lane) - Container Sleeper - Roads and Other area of Container Terminal Depending on the facilities and their uses, different pavement types are applied to suit their function as described as follows: - Container storage areas and general cargo open storage 80 mm thick of rectangular interlocking blocks, 50 mm of sand, 200 mm of cement bound material, a crushed aggregate sub-base (300 mm) are layered on top of the compacted sub-grade. - RTG runway beams Rubber Tired Gantry Crane (RTG) requires the long span passage with 1.5m width, in order to stand its loading weight of more than 38 tons per wheel. The lanes are generally required to make of the reinforcing concrete slab (RC slab) having 300 mm thickness with sub base (300mm min.) on top of the compacted sub grade. The joint of the spans will be provided upon the RC base in order to avoid unequal settlement, hence, to ensure the smooth operation of the RTG. - Container Sleeper 30-75
9 Since containers will be generally stacked and arranged in fixed positions in the yard slots, a base named Container Sleeper to bear the containers concentration load will be provided. The Container Sleeper is 1.5 m wide and of similar structure as RTG lane. - Roads and other areas of Container Terminal 3) Buildings The vehicle traffic lanes adjacent and parallel to the container stacking areas and access road to the terminal are planned to be pave with concrete. The pavement consists of concrete slab of 250 mm thick, on top of a crushed aggregate sub base (300 mm ) over the compacted sub grade. The Proposed port buildings are planned in accordance with the following principles. - Rational and functional design for efficient port management and operation. - Smooth flow line planning - Flexibility on the future port expansion - Utilization of the local construction methods and materials - Economical design The proposed buildings are basically planned as RC column structure
10
11 Cost Estimation (1) Construction Procurement in Samarinda 1) Unit Cost of Labor and Materials in Samarinda The unit costs of labor and materials in Samarinda basically refer to HARUGA SATUAN BAHAN BUNGUNAN issued by the province office, JURNAL BAHAN BANGUNAN, KONSTRUKSI DAN INTERIOR 2001 and the survey made by the study team in the study area. For details see Table ) Unit Cost of Container Handling Equipment The unit costs of the procurement of the handling equipment were calculated from the local prices of imported CIF plus installation fee. Indonesian import tax and duties are not included. For details see Table Table Unit Cost in Samarinda (unit :Rp) SAMARINDA SAMARINDA Description (Rp/day) Description Unit (Local) Gasoline Lit 1450 Superintendant 60,000 Diesel Fuel Lit 900 Foreman 30,000 Cement ton 470,000 Common Labour 15,000 Coarse Aggregate m3 62,000 Skilled Labour 25,000 Fine Aggregate m3 30,000 Welder 25,000 Sand for Filling m3 26,000 Mechanician 25,000 Crushed Stone m3 50,000 Electrician 25,000 Plywood 1cm m2 30,000 Carpenter 20,000 Square Timber m3 400,000 Painter 20,000 Asphalt kg 3,800 Bar Bender 25,000 Reinforcing Bar Masonry 20,000 (D-10) ton 5,000,000 Equip. Operator 30,000 (D-16) ton 4,500,000 Plant Operator 30,000 (D-25) ton 4,500,000 Diver 100,000 Structural Steel ton 4,500,000 Ship Captain 100,000 Steel Pipe Pile Ship Crew 60,000 (D=600 x12) ton 10,600,000 (D=500 x10) ton 10,600,000 (Foreign) Steel Sheet Pile ton 8,000,000 Expatriate 3,000,000 Concrete Block(pavement) m2 195,000 Ship Captain 3,500,000 Diver 3,500,000 Table Unit Cost of Equipment Description Cost (Million Rp) Description Cost (Million Rp) Quay Gantry Crane 32,000 Mobile Crane (50t) 3,700 Span 12m, Reach 22m RTG 6Lane, 1 over 4 11,200 Mobile Crane (25t) 1,900 Tractor & Chassis 1,100 Forklift (7t) 650 3) Construction Firms in Samarinda The construction firms in Samarinda basically are sub-contractors under foreign and major domestic contractors in Indonesia
12 (2) Assumptions for Cost Estimation 1) Basic Price and Exchange Rate The basic prices are as of 2001 and the foreign exchange rate of ; 1 US$ = 9,500 Rupiah (Rp) = 118 Yen 2) Currency Component The each unit price was split into foreign currency and local currency portions, both indicated in Rupiah, estimated in the following classifications; - The foreign currency component consists of : -Imported construction materials -Foreign components of depreciation and operation /maintenance cost for construction equipment and plant -Foreign component of domestic materials -Salaries and costs of foreign personnel - The local currency component consists of : -Local construction materials -Local components of depreciation and operation /maintenance cost for construction equipment and plant -Salaries and costs of local personnel -Import duty on imported materials -Indonesian taxes 3) Maintenance Cost ( Facility, Equipment, Dredging) The maintenance cost for facilities is set out as 2% of the facility construction cost based on the annual maintenance fee of the facilities. Also, 3% of the equipment cost is adopted as the maintenance cost for the equipment. The maintenance dredging cost is determined from the annual maintenance dredging cost of the river done by P.T PENGERUKAN INDONESIA (RUKINDO). The cost of maintenance dredging is calculated as Rp13,000/m 3. 4) Land Acquisition The land acquisition fee for Palaran site is set at about Rp 48,000/m 2 based on the results of the interview survey around the site. (3) Basic Cost of Construction Works The combined cost for major construction works is estimated from the costs of labor, required materials, required construction equipment, and the site expense of labor and equipment. The estimation was verified by referring to the data of local construction cost data collected in the survey. The combined cost of major works is shown in Table
13 Table Combined Cost for Major Works Work Item Unit Currency(%) Local Currency (%) SAMARINDA Foreign Local Goods Skilled labour Unskilied labour Excavation m3 2, Back Filling m3 5, Soil Disposal m3 3, Blinding Stone m3 70, Base Course m3 73, Sub- Base Course m3 75, Con.Block Paving m2 164, Concrete Form Work m2 99, Re-Bar Work ton 5,699, Mix- Concrete 270kg/cm2 m3 276, Mix- Concrete 210kg/cm2 m3 263, Mix- Concrete 150kg/cm2 m3 256, Concrete Placing(Included Tding Transportation) by Man Power m3 112, by Truck Crane m3 78, As-Con Hot-Mix ton 415, As-Con Placing ton 65, Steel Pile Driving D-500mm m 1,198, D-600mm m 1,899, Sheet Pile Driving m 477, Dredging & Disposal by Cutter Suction Dredging & Disposal m3 35, by Barge & Grab m3 65, Paper Drain driving m 18, Stone Placing m2 270, Manufacturing Steel Structure Super Structure ton 9,000, Supporting Structure ton 6,000, Office Building m2 2,250, Warehouse or Shed m2 1,420, (4) Construction Cost and Procurement Cost The construction cost is estimated based on the combined cost of the construction works. The utilities cost of such as water, electric power and drainage, refers to the other projects in the equivalent scale. In addition to the construction cost and procurement cost, the engineering fee for the detail design and supervision, physical contingency and VAT are estimated in this study. The engineering fee for construction is about 10% to 15% for the construction cost, 3% for the equipment cost. The physical contingency is 8% for the construction cost, VAT is 10% of the whole cost. The equipment cost for Palaran is shown in Table & Table The construction cost for Palaran is shown in Table & Table The equipment cost for Samarinda is shown in Table The construction cost for Samarinda (Passenger Terminal) is shown in Table The construction cost for Samarinda (Existing Port) is shown in Table
14 Table Equipment Cost for Palaran (4 Berths Case) Phase Unit Price Description Quantity (Million Rp) Amount (Million Rp) 1 Gantry Crane 2 32,000 64,000 2 RTG 4 11,200 44,800 I 3 Tractor & Trailer 8 1,100 8,800 Engineering Fee 3% 3,528 VAT 10% 12,113 Total 133,241 1 Gantry Crane 1 32,000 32,000 2 RTG 2 11,200 22,400 II 3 Tractor & Trailer 4 1,100 4,400 Engineering Fee 3% 1,764 VAT 10% 6,056 Total 66,620 1 Gantry Crane 1 32,000 32,000 2 RTG 2 11,200 22,400 III 3 Tractor & Trailer 4 1,100 4,400 Engineering Fee 3% 1,764 VAT 10% 6,056 Total 66,620 Grand Total 266,482 Table Equipment Cost for Palaran (6 Berths Case) Phase Unit Price Description Quantity (Million Amount (Million Rp) 1 Gantry Crane 3 32,000 96,000 2 RTG 6 11,200 67,200 I 3 Tractor & Trailer 12 1,100 13,200 Engineering Fee 3% 5,292 VAT 10% 18,169 Total 199,861 1 Gantry Crane 1 32,000 32,000 2 RTG 2 11,200 22,400 II 3 Tractor & Trailer 4 1,100 4,400 Engineering Fee 3% 1,764 VAT 10% 6,056 Total 66,620 1 Gantry Crane 1 32,000 32,000 2 RTG 2 11,200 22,400 III 3 Tractor & Trailer 4 1,100 4,400 Engineering Fee 3% 1,764 VAT 10% 6,056 Total 66,620 1 Gantry Crane 1 32,000 32,000 2 RTG 2 11,200 22,400 IV 3 Tractor & Trailer 4 1,100 4,400 Engineering Fee 3% 1,764 VAT 10% 6,056 Total 66,620 Grand Total 399,
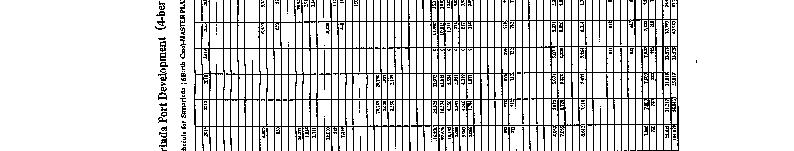
15 Table Construction Cost for Palaran (4 Berths Case) Description Unit Quantity Unit Price(Rp) Amount (Million Rp) Phase I Phase II Phase III 1 Direct Construction Cost in PALARAN (1) Mobilization and Demobilization L.S 1 9,600,000,000 9,600 3,200 3,200 3,200 (2) Dredging & Reclamation 1) Dredging m3 22,500 65,000 1, ) Reclamation m3 14,000 30, (3) Berth Construction 1) Steel Pipe Piling Work (D=600) m 19,500 1,899,192 37,034 23,463 8,182 5,390 Earth auger point 40 47,500,000 1, ,900 2) Concrete Deck Concrete Placing m3 8, ,120 5,463 2,731 1,366 1,366 Re-bar Work ton 908 5,699,650 5,175 2,588 1,294 1,294 3) Retaining Wall Sheet Piling Work m 20, ,772 9,090 4,545 2,272 2,272 Concrete Coping Work m , Tie-rod & Anchor Block No ,200,000 1, Backfill Stone m3 6,500 70, Backfill m3 9,000 5, ) Slope Protection m2 15, ,408 4,110 2,055 1,028 1,028 5) Wharf Fittings Fender & Bollard set ,000,000 4,340 2,170 1,085 1,085 Crane Rail Fittings m 1,000 1,315,000 1, ) Yard Preparation L.S 1 5,120,000,000 5,120 2,560 1,280 1,280 (4) Yard Pavement 1) Block Paving m2 55, ,670 9,057 4,528 2,264 2,264 2) RTG Lane m2 9, ,355 4,637 2,318 1,159 1,159 3) Container Sleeper m2 12, ,358 5,286 2,643 1,321 1,321 4) Concrete Paving m2 61, ,373 11,277 7,518 1,880 1,880 (5) Access Road 1) Cutting & Filling & Grading L.S 1 491,000, ) Concrete Paving m2 30, ,373 5,593 5, ) Utilities L.S 1 550,000, (6) Buildings 1) Demolishing Existing Facilities L.S 1 1,000,000,000 1,000 1,000 2) CFS ( 2 Units) m2 8,320 1,420,000 11,814 4,998 6, ) Gate m ,250,000 1,125 1, ) Terminal Office Building m ,250,000 1,800 1, ) Work Shop m2 1,750 1,420,000 2,485 2, ) Canteen m ,420, (7) Yard Fence m 1, , (8) Drainage System L.S 1 2,266,000,000 2,266 1, (9) Power Supply & Yard Lighting L.S 1 6,500,000,000 6,500 4,333 1,083 1,083 (10) Water Supply System L.S 1 2,850,000,000 2,850 1, (11) Sewerage System L.S 1 1,300,000,000 1, (12) Other Utilities L.S 1 500,000, Total Direct Cost 156,888 90,909 37,057 28,922 3 Indirect Construction Cost (1) Common Temporary Work % 6 to 8 D.C 5,455 2,965 2,314 (2) Site Expenses % 13 to 15 D.C 11,818 5,559 4,338 (3) Overhead % 8 D.C 7,273 2,965 2,314 Total Indirect Cost 24,545 11,488 8,966 Total Construction Cost 115,455 48,545 37,887 Physical Contingency % 10 T.C 11,545 4,854 3,789 Engineering Fee % 12 T.C 13,855 5,825 4,546 VAT % 10 T.C,P.C,E.F 14,085 5,922 4,622 Total Project Cost 154,940 65,147 50,845 Land Acquisition Fee m2 275,000 48,000 13,200 13, Compensation for existing fascility m2 15,000 1,000,000 15,000 15, Grand Total (Phase I +II+III) 299,
16 Table Construction Cost for Palaran ( 6 Berths Case) Description Unit Quantity Unit Price(Rp) Amount (Million Rp) Phase I Phase II Phase III Phase IV 1 Direct Construction Cost in PALARAN (1) Mobilization and Demobilization L.S 1 13,800,000,000 13, (2) Dredging & Reclamation 1) Dredging m3 32,000 65,000 2, ) Reclamation m3 25,000 30, (3) Berth Construction 1) Steel Pipe Piling Work (D=600) m 28,613 1,899,192 54, Earth auger Point 80 47,500,000 3, ) Concrete Deck Concrete Placing m3 12, ,120 7, Re-bar Work ton 1,320 5,699,650 7, ) Retaining Wall Sheet Piling Work m 30, ,772 13, Concrete Coping Work m , Tie-rod & Anchor Block No ,200,000 2, Backfill Stone m3 9,800 70, Backfill m3 13,000 5, ) Slope Protection m2 22, ,408 6, ) Wharf Fittings Fender & Bollard set ,000,000 7, Crane Rail Fittings m 1,500 1,315,000 1, ) Yard Preparation L.S 1 5,120,000,000 5, (4) Yard Pavement 1) Block Paving m2 55, ,670 9, ) RTG Lane m2 9, ,355 4, ) Container Sleeper m2 12, ,358 5, ) Concrete Paving m2 103, ,373 19, (5) Access Road 1) Cutting & Filling & Grading L.S 1 491,000, ) Concrete Paving m2 34, ,373 6,326 5, ) Utilities L.S 1 550,000, (6) Buildings 1) Demolishing Existing Facilities L.S 1 1,000,000,000 1,000 1,000 2) CFS ( 2 Units) m2 8,320 1,420,000 11, ) Gate m ,250,000 1,125 1, ) Terminal Office Building m ,250,000 1,800 1, ) Work Shop m2 1,750 1,420,000 2,485 2, ) Canteen m ,420, (7) Yard Fence m 1, , (8) Drainage System L.S 1 2,566,000,000 2,566 1, (9) Power Supply & Yard Lighting L.S 1 6,800,000,000 6,800 4, , (10 Water Supply System L.S 1 2,850,000,000 2,850 1, (11 Sewerage System L.S 1 1,300,000,000 1, (12Other Utilities L.S 1 500,000, Total Direct Cost 207, ,815 33,433 35,080 28,456 3 Indirect Construction Cost (1) Common Temporary Work % 6 to 8 D.C 6,649 2,675 2,806 2,276 (2) Site Expenses % 13 to 15 D.C 14,406 5,015 5,262 4,268 (3) Overhead % 8 D.C 8,865 2,675 2,806 2,276 Total Indirect Cost 29,920 10,364 10,875 8,821 Total Construction Cost 140,735 43,797 45,955 37,278 Physical Contingency % 10 T.C 14,073 4,380 4,596 3,728 Engineering Fee % 12 T.C 16,888 5,256 5,515 4,473 VAT % 10 T.C,P.C,E.F 17,170 5,343 5,607 4,548 Total Project Cost 188,866 58,775 61,672 50,027 Land Acquisition Fee m2 355,000 48,000 17,040 13, Compensation for existing fascility m2 15,000 1,000,000 15,000 15,000 Grand Total (Phase I +II +III +IV) 391,
17 Table Equipment Cost for Samarinda (Existing Port) Phase Unit Price Description Quantity (Million Rp) Amount (Million Rp) 1 Mobile Crane (25t) 3 1,900 5,700 2 Forklift (7T) ,500 I Engineer Fee 366 VAT 1,257 Total 13,823 1 Mobile Crane (25t) 3 1,900 5,700 2 Forklift (7T) ,500 II Engineer Fee 366 VAT 1,257 Total 13,823 Grand Total 27,645 Table Construction Cost for Samarinda (Passenger Terminal) Total Description Amount Unit Quantity Unit Price(Rp) (Million Rp) 1 Direct Construction Cost (1) Mobilization and Demobilization L.S 1 3,000 3,000 (2) Berth Construction 1) Passenger Berth, Dolphin, Trestle L.S 1 9,000 9,500 2) Retaining Wall L.S 1 2,763 (3) Yard Pavement 1) Paving for Passenger Terminal m2 7, ,670 1,219 (4) Buildings 6) Passenger Terminal Bulding 9,500 3,200 2,250,000 7,200 (5) Drainage System L.S 1 1,000 1,000 (6) Power Supply & Yard Lighting L.S 1 2,500 2,500 (7) Water Supply System L.S 1 1,200 1,200 (8) Other Utilities L.S Total Direct Cost 28,682 3 Indirect Construction Cost (1) Common Temporary Work % 8 D.C 2,295 (2) Site Expenses % 15 D.C 4,302 (3) Overhead % 8 D.C 2,295 Total Indirect Cost 8,891 Total Construction Cost 37,573 Physical Contingency % 8 T.C 3,006 Engineering Fee % 12 T.C 4,509 VAT % 10 T.C,P.C,E.F 4,509 Total Project Cost 49,
18 Table Construction Cost for Samarinda (Existing Port) Description Unit Quantity Unit Price(Rp) Amount (Million Rp) 1 Direct Construction Cost in Existing Port (1) Mobilization and Demobilization L.S 1 2,000,000,000 2,000 (2) Dredging & Reclamation 1) Dredging m3 7,600 65, ) Reclamation m3 2,100 30, (3) Berth Construction 1) Steel Pipe Piling Work (D=500) m 7,380 1,198,657 8,846 2) Concrete Deck Concrete Placing m3 2, ,120 1,324 Re-bar Work ton 209 5,699,650 1,191 3) Retaining Wall Sheet Piling Work m 3, ,590 1,896 Concrete Coping Work m , Tie-rod & Anchor Block No. 46 4,800, Backfill Stone m , Backfill m3 1,000 5, ) Slope Protection m2 1, , ) Wharf Fittings Fender & Bollard set 22 32,000, ) Yard Preparation L.S 1 1,178 (4) Yard Pavement 1) Block Paving m2 10, ,670 1,729 (5) Buildings 1) Demolishing Existing Facilities L.S 1 500,000, ) Warehouse (1units) m2 6,800 1,420,000 9,656 3) Port Office Building m2 1,200 2,250,000 2,700 4) Gate(2units) m ,250, ) Gate House (2 units) m ,250, (6) Drainage System L.S 1 350,000, (7) Power Supply & Yard Lighting L.S 1 700,000, (8) Water Supply System L.S 1 250,000, (9) Other Utilities L.S 1 250,000, Total Direct Cost 35,276 3 Indirect Construction Cost (1) Common Temporary Work % 8 D.C 2,822 (2) Site Expenses % 15 D.C 5,291 (3) Overhead % 8 D.C 2,822 Total Indirect Cost 10,936 Total Construction Cost 46,211 Physical Contingency % 8 T.C 3,697 Engineering Fee % 15 T.C 6,932 VAT % 10 T.C,P.C,E.F 5,684 Total Project Cost 62,
19 (5) Project Cost The total project cost for Palaran is Rp 565,613 million for the 4-berths case and Rp 791,103 million for the 6-berths case. Total project cost for existing Samarinda Port is Rp 139,767 million. The Project cost is summarized in Table and Table For the economic analysis, the depreciation period of the constructed facilities and the procured equipment are determined as shown in Table Table Depreciation Period of the Facilities and Equipment Facility Depreciation Period Remarks Berth, Retaining Wall 50 years Warehouse, CFS 50 years Pontoon, Movable Bridge 40 years In River Yard Pavement 30 years Road Pavement 30 years Buildings 40 years Equipment Depreciation Period Remarks Quay gantry Crane 25 years RTG 20 years Mobile Crane 15 years Tractor & Chassis 10 years Forklift 10 years 30-86
20 Table Summary of Project Cost for Samarinda (Unit in Million Rp.) Total ( ) 218,454 97, , ,722 29, ,767 91,105 26, , , , , , , ,928 96,197 29, , ,941 27, ,294 89,912 26, , , , ,105 Description Container Terminal (4-Berth Case) Container Terminal (6-Berth Case) 1. Palaran Phase I Phase II Phase III Total Phase I Phase II Phase III Phase IV Total Foreign Local Total Foreign Local Total Foreign Local Total Foreign Local Total Foreign Local Total Foreign Local Total Foreign Local Total Foreign Local Total Foreign Local Total 1.1 Civil Works Construction Cost 82,992 32, ,455 36,233 12,312 48,545 26,428 11,460 37, ,653 56, , ,868 37, ,735 30,638 13,159 43,797 34,797 11,159 45,956 25,386 11,892 37, ,689 74, , Physical Contingency 8,299 3,246 11,545 3,623 1,231 4,854 2,643 1,146 3,789 14,565 5,623 20,188 10,287 3,787 14,074 3,064 1,316 4,380 3,480 1,116 4,596 2,539 1,189 3,728 19,370 7,408 26, Enginering Fee 9,005 4,849 13,854 3,787 2,039 5,826 2,955 1,591 4,546 15,747 8,479 24,226 10,977 5,911 16,888 3,416 1,839 5,255 3,585 1,930 5,515 2,908 1,566 4,474 20,886 11,246 32, VAT 0 14,085 14, ,922 5, ,622 4, ,629 24, ,170 17, ,343 5, ,607 5, ,548 4, ,668 32,668 Sub-total (1.1) 100,296 54, ,939 43,643 21,504 65,147 32,026 18,819 50, ,965 94, , ,132 64, ,867 37,118 21,657 58,775 41,862 19,812 61,674 30,833 19,195 50, , , , Equipment Equipment 115,336 2, ,600 57,668 1,132 58,800 57,668 1,132 58, ,672 4, , ,004 3, ,400 57,668 1,132 58,800 57,668 1,132 58,800 57,668 1,132 58, ,008 6, , Enginering Fee 2, ,528 1, ,764 1, ,764 5,644 1,412 7,056 4,234 1,058 5,292 1, ,764 1, ,764 1, ,764 8,467 2,117 10, VAT 0 12,113 12, ,056 6, ,056 6, ,225 24, ,169 18, ,056 6, ,056 6, ,056 6, ,337 36,337 Sub-total (1.2) 118,158 15, ,241 59,079 7,541 66,620 59,079 7,541 66, ,316 30, , ,238 22, ,861 59,079 7,541 66,620 59,079 7,541 66,620 59,079 7,541 66, ,475 45, , Land Acquisition Land Acquisition 13,200 13,200 13,200 13,200 13,200 13,200 1,920 1,920 17,040 17, Compensation 15,000 15,000 15,000 15,000 15,000 15,000 15,000 15,000 Sub-total (1.3) 28,200 28,200 28,200 28,200 28,200 28,200 32,040 32, Description Existing Port (General Cargo Terminal) Passenger Terminal Total 2. Samarinda Port Phase I Phase II Foreign Local Total Foreign Local Total Foreign Local Total Foreign Local Total 2.1 Civil Works Construction Cost 34,708 11,503 46,211 26,636 10,937 37,573 61,344 22,440 83, Physical Contingency 2, ,697 2, ,006 4,908 1,795 6, Enginering Fee 4,506 2,426 6,932 2,931 1,578 4,509 7,437 4,004 11, VAT 0 5,684 5, ,509 4, ,193 10,193 Sub-total (2.1) 41,991 20,533 62,524 31,698 17,899 49,597 73,689 38, , Equipment Equipment 12, ,200 12, ,200 24, , Enginering Fee VAT 0 1,257 1, ,257 1, ,514 2,514 Sub-total (2.2) 12,371 1,452 13,823 12,371 1,452 13,823 24,742 2,904 27,646 Total ( ) 54,362 21,985 76,347 12,371 1,452 13,823 31,698 17,899 49,597 98,431 41, ,767 Table Summary of Project Cost for Samarinda (2) Civil Work Equipment Total Foreign Local Foreign Local Foreign Local Samarinda 73,689 38,432 24,742 2,904 98,431 41,336 Palaran: 4-Berth Case 175,965 94, ,316 30, , ,131 Palaran: 6-Berth Case 233, , ,475 45, , ,645 Land Acquisition 4-Berth Case 28,200 6-Berth Case 32,040 Total of Samarinda 4-Berth Case 249, , ,058 33, , ,667 6-Berth Case 307, , ,217 48, , ,021 (Unit in Million Rp.)
21 30.11 Phased Planning Existing Terminal The measures to be taken at the existing terminal up to 2025 are summarized below (Table ). It can deal with the projected volume of general cargo with these measures (Figure ). Table Milestone at Existing Terminal Year Milestone Procurement Construction Mobile Cranes, 10 Forklifts Container handling moved to Palaran, 2007 The existing Terminal dedicated to General Cargo (7 Wharves) more wharves become operational New Passenger Terminal becomes operational 3 Mobile Cranes, 10 Forklifts 1 General Cargo Wharf, Replacement of the existing Sheds with New Sheds 1 Passenger Wharf, Demolition of the existing Passenger Terminal Building Figure Demand and Capacity at Existing Terminal 30-88
22 Palaran The measures to be taken at Palaran up to 2025 are summarized below (Table and Table ). Palaran terminal can deal with the projected volume of container cargo with these measures (Figure and Figure ). Table Milestone at Palaran (6-Berth Scenario) Year Milestone Procurement Construction Gantrie Cranes, 6 RTG, 12 Yard Tractors 3 Container Wharves, CFS, Access Road 2007 Container Terminal becomes operational (3 Wharves) 1 Gantry Crane, 2 RTG, 4 Yard Tractors 1 more Wharf becomes operational 1 Gantry Crane, 2 RTG, 4 Yard Tractors 1 more Wharf become operational 1 Gantry Crane, 2 RTG, 4 Yard Tractors 1 more Wharf become operational 1 Container Wharf, CFS 1 Container Wharf 1 Container Wharf Figure Demand and Capacity at Palaran Container Terminal (6-berth scenario) 30-89
23 Table Milestone at Palaran (4-Berth Scenario) Year Milestone Procurement Construction Gantry Cranes, 4 RTG, 8 Yard Tractors 2 Container Wharves, CFS, Access Road 2007 Container Terminal becomes operational (2 Wharves) 1 Gantry Crane, 2 RTG, 4 Yard Tractors 1 more Wharf become operational 1 Gantry, 2 RTG, 4 Yard Tractors 1 more Wharf become operational 1 Container Wharf, CFS 1 Container Wharf Figure Demand and Capacity at Palaran Container Terminal (4-Berth Scenario) 30-90
24 30.12 Capacity Evaluation Simulation Model Two scenarios were examined for the Short Term Plan (target year 2007) and the Master Plan (target year 2025) of Samarinda. The purpose of this chapter is to carry out the Vessel Traffic Simulation for both scenarios and to examine their results. A numerical simulation model WITNESS 2000 was employed to evaluate whether the port capacity and the channel capacity would be sufficient to cope with the increasing cargo and vessel traffic throughout the planning period of this study. The list of the data used in the simulation is shown in Table The volume of cargoes and the number of calling vessels are in line with the traffic demand forecast for 2007 and The scenarios are Case 1 (Four-Berth Scenario) and Case 2 (Six-Berth Scenario). Table and Table show the numbers of berths, berth productivity and working hours for Case 1 and Case 2. The navigation conditions of the Mahakam River such as the river sailing route are shown in Table These conditions are based on the interviews with IPC IV offices and the statistics issued by IPC IV Samarinda office. Figure exemplifies a simulation model. Table Cargo Volume and Vessel Call Condition (2007 & 2025) Cargo Type Cargo Volume Vessel Calls Berth (Year) (for one year) (for one year) ,000 tons 1,276 General Cargo ,065,000 tons 1,185 Public Berth Private Berth Container Cargo Passenger Coal Timber & Log Others Source: JICA Study Team ,000 TEUs ,000 TEUs ,000 person ,000 person ,633,000 tons 2, ,200,000 tons 4, ,674,000 tons 2, ,900,000 tons 1, ,304,000 tons 4, ,661,000 tons 3,
25 Table Case 1 (4-Berth Scenario) Berth Conditions (2007 & 2025) Berth Nos. of Berth Productivity Working Hours (year) nos. 40 tons/hour 24 hours General Cargo nos. 40 tons/hour 24 hours Container Cargo Passenger Source: JICA Study Team nos. 24 TEUs/hour 24 hours nos. 24 TEUs/hour 24 hours no. - 2 days no. - 2 days Table Case 2 (6-Berth Scenario) Berth Conditions (2007 & 2025) Berth Nos. of Berth Productivity Working Hours (year) nos. 40 tons/hour 18 hours General Cargo nos. 40 tons/hour 18 hours Container Cargo Passenger Source: JICA Study Team nos. 20 TEUs/hour 18 hours nos. 20 TEUs/hour 18 hours no. - 2 days no. - 2 days Table Navigation Conditions of Mahakam River No. Navigation Condition Remarks 1. Maximum Vessel Size LOA = 153.0m, Draft = 6.80 m 2. Vessel Speed less than 12 knots/hour 3. Navigation Activity 24 hours 4. Traffic 2 Ways (except at Narrow Points) Source: IPC IV Samarinda Office Capacity Evaluation of Samarinda Short Term Plan (2007) One-way Traffic at 6 Points The output of the simulation over a span of one year (2007) is shown below. The average berth occupancy rate (BOR) is given in Table The average BOR of the container berths is 47.7% (Case 1) and 47.0% (Case 2), and do not differ very much from one another. The average berth waiting time is given in Table Case 2 requires a waiting time 30-92
26 of 128 minutes, considerably shorter than the 181 minutes in Case 1. Public Berth Table Berth Occupancy Rate (BOR on 2007) Case 1 (4 Berths Scenario) Case 2 (6 Berths Scenario) No. of Berth Average BOR No. of Berth Average BOR General Cargo 7 nos % 7 nos % Container Cargo 2 nos % 3 nos % Passenger 1 no % 1 no % Source: by WITNESS 2000 Simulation Result Table Berth Waiting Time (2007) Case 1 (4 Berths Scenario) Case 2 (6 Berths Scenario) Public Berth Average Berth Average Berth No. of Berth No. of Berth Waiting Time Waiting Time General Cargo 7 nos. 0 min. 7 nos. 2 min. Container Cargo 2 nos. 181 min. 3 nos. 128 min. Passenger 1 no. 69 min. 1 no. 138 min. Source: by WITNESS 2000 Simulation Result Capacity Evaluation of Samarinda Master Plan (2025) The output of the simulation over a span of one year is shown below. The average BOR is given in Table The average BOR of the container berths is 55.6% (Case 1) and 57.6% (case 2), and do not differ very much from one another. BOR in both cases can be judged reasonable. The input data for productivity and working hours need to be examined further. The average berth waiting time is given in Table Case 2 requires a waiting time of 88 minutes, slightly shorter than the 117 minutes of Case 1. With the waiting time less than 2 hours, both cases can be considered reasonable. Public Berth Table Berth Occupancy Rate (BOR on 2025) Case 1 (4-Berth Scenario) Case 2 (6-Berth Scenario) No. of Berth Average BOR No. of Berth Average BOR General Cargo 9 nos % 9 nos % Container Cargo 4 nos % 6 nos % Passenger 1 no % 1 no % Source: by WITNESS 2000 Simulation Result 30-93
27 Public Berth Table Berth Waiting Time (2025) Case 1 (4-Berth Scenario) Case 2 (6-Berth Scenario) No. of Berth Average Berth Waiting Time No. of Berth Average Berth Waiting Time General Cargo 9 nos. 2 min. 9 nos. 12 min. Container Cargo 4 nos. 117 min. 6 nos. 88 min. Passenger 1 no. 194 min. 1 no. 363 min. Source: by WITNESS 2000 Simulation Result 30-94


28
29 30.13 Economics of Port Master Plan Development at Samarinda General Introduction to Economic Evaluation The purpose of economic evaluation is to provide a view of the feasibility of investment from the national, resource viewpoint. It differs from financial analysis which provides information on the direct financial implications of investment including profitability. Economic evaluation, therefore, considers only resource costs and excludes transfers such as taxes. It also takes into account the price of local (non-traded) inputs which may be overpriced or underpriced relative to market conditions. In this project, the without scenario is defined as the existing port at Samarinda having minimal development and very little change occurring in infrastructure, equipment and operational procedures. In this project, under the without case, the existing port facilities will be used to their maximum capacity with an increasing degree of congestion and delay at the berths and in the terminals. This would result in increased waiting time, lower port efficiency and increased transport costs. Container traffic would also be handled at the existing general cargo berths at lower handling rates than would be anticipated at specialized berths. Ultimately, traffic would be increasingly diverted to other ports such as Balikpapan and this is already happening to some extent, although Balikpapan will not be an adequate alternative until the planned Kariangau terminal is built. Kariangau is expected by 2007 and is a key policy objective of East Kalimantan government. Under the with project scenario the specialized and additional facilities will enable cargo to be handled more efficiently and cost effectively with ships experiencing less queuing and faster on berth turnaround times Methodology This section evaluates the Master Plan in economic terms. Section 31.5 describes the economic analysis of the short-term programme of port development at Samarinda. Economic analysis is carried out by means of well-developed techniques and the EIRR (Economic Internal Rate of Return) and NPV (Net Present Value) are the two most often used. To calculate the NPV of a project, the discount rate is input and a discounted project value (i.e., the value of the project in today s values) is the output. If the output is greater than zero, the project is economically feasible. In Indonesia, in recent years, the minimum rate required for projects has been 15 percent for non-social projects and 12 percent for social projects such as housing
30 Both local costs and all benefits are shadow priced. The foreign portion is regarded as already at market prices so no adjustment is made for imported (traded) inputs. All costs and benefits are expressed in real terms (i.e., there is no allowance for inflation) although costs and benefits may be increased if there is expected to be an increase in real terms (i.e., above the general level of inflation). Costs and benefits are expressed in real or constant values in the base year of study which for this project is The exchange rate used throughout is US$1.0=Rp.9, Project Period Infrastructure projects are expensive but have long economic and physical lives. Hence, the evaluation period is usually at least 20 years, excluding construction, and often 30 years. Thirty years has been chosen for this project. Costs and benefits are specified for each of the project years. Discounting means that costs and benefits after about 20 years usually have relatively small impacts on the economic feasibility Project Costs Costs for each scenario are divided into capital costs and annual costs. Capital costs are incurred both for the initial investment, and any subsequent, phase and for replacement of fully depreciated assets within the 30 year period (usually equipment has an economic life of less than 30 years). Dredging at Samarinda is only required on an annual basis. The economic costs of implementing the projects have been estimated based on the financial cost including physical contingency. Price contingency, interest during construction and taxes and duties are then all excluded from the financial cost. In order to shadow price the projects costs and benefits, a standard conversion factor (SCF) of has been generally applied to non-traded (local portion) costs and benefits and a specific factor of 0.75 has been applied to unskilled labour. These factors are currently being applied in other Indonesian project evaluations. Annual costs (i.e., operating and maintenance costs) are assumed to have only a moderate local content and a SCF of 0.9 has been applied. All traded costs (foreign portion) have been valued at their border price (i.e., the SCF is assumed as 1.0). a. Capital Costs and Maintenance Costs These have been specified in Section and the assumptions made detailed therein. The without scenario envisages minimal development and so the capital and maintenance costs are the incremental costs. Current maintenance expenditure is minimal. b. Operating Costs 30-97
31 These have been projected originally for the branch based on 1999 and 2000 data and then converted to incremental costs based on incremental cargo volumes for each scenario. The estimates involve a two-stage process. First a realistic assessment of the base year data is needed to establish the reliability of the data and then the future year costs must be estimated taking into account that some costs will directly vary with cargo growth and other costs are fixed or semi-fixed. Base year costs were reviewed in relation to other Indonesian ports including on an IPC wide basis for the 4 IPCs. Secondly, cost data was disaggregated and an estimate made of the likely proportion of fixed sub-costs and variable sub-costs. Based upon a weighted average of these two, an estimate could be made of the link between cargo growth and operating cost growth. So for example, at Samarinda, as cargo growth increases by 10 %, operating costs were estimated to increase by 5%-6%. The basis of the estimation of operating costs is shown in Table c. Dredging Costs Dredging costs are subsidised (i.e., RUKINDO contracts are less than cost recovery price), and a substantially increased price was allowed. However, it is unclear as to whether any subsidy still remains in our estimated prices. Hence, only dredging costs were shadow priced by removing the taxable element. As dredging is capital intensive, the shadow pricing of dredging would have only a marginal impact in any case Benefits-Quantifiable The principal quantified benefits of each such project are reduction in ship time in port and/or queuing and avoided land transport and /or transshipment costs. The benefits of the land side passenger terminal area improvements include reduced passenger and vehicle waiting times. a. Ship Queuing and Savings to Ships Ship waiting time with and without the project are estimated with a simulation model and this was described in section The resulting time savings are then costed by applying the daily cost of the average vessel in key years. Vessel cost per day were established by surveys with ship operators and charterers. These costs are increased in real terms in line with the increased size of vessel projected over time. There is considerable competition in shipping rates at present with the economic recession in Indonesia and elsewhere but the possible increase in real costs over time is difficult to estimate. The three types of vessels handled at Samarinda public port are container, general cargo and passenger vessels. Since passenger vessels getting priority on arrival, are 30-98
32 relatively few and the proposed terminal is not planned until 2019, savings to passenger vessels were ignored at this stage of the economic analysis. Ship costs per day are interpolated between 2007 and Type of Vessel GRT, Tonne (t) or Year Cost per Day(Rp.m.) TEU Container 227 teu In teu By General Cargo 357 t./ grt In t./ grt By Notes: Conversion of tonnes to GRT or v.v. based on Indonesian fleet data and load factors Sources: Research in Indonesia with shipping companies and charterers. b. Ship Service Time on Berth and Savings to Ships Benefits are also generated by faster turnaround of vessels. The simulation model gives time on berth with and without project and annual savings are calculated and costed as in a) above. c. Avoided Transport Costs At the point at which the without project capacity is reached, overflow cargo is assumed to be handled elsewhere. In accordance with this likely situation, the Consultants have assumed 100% will be handled at Balikpapan/Kariangau some 105 km. from Samarinda. The avoided costs (benefits) are based on the economic cost and truck transport data used in Indonesia for highway planning. Road transport costs are based on cost models currently in use in Indonesia. These models are based on the World Bank Highway Development Manual and adapted over many years to Indonesian conditions. The main inputs are vehicle type, speed and road surface. Heavy truck costs are estimated to amount to Rp3,096 per truck/km assuming that each truck will carry 10 tonnes payload. A load factor of 90% has been assumed bearing in mind traffic imbalance but also probable truck overloads. It is quite possible that in a regional port study, there would be justification of including some additional capital costs for overflow ports and other infrastructure. In this study, since a specific Master Plan is being assessed, the regional infrastructure requirements have not been considered in detail. d. Transport Disbenefits Palaran is some 20 km from the existing Samarinda port and there will be some disbenefit from the additional distance. However, companies are likely to move in the longer term nearer the port and industrial development areas are planned in the 30-99
33 Palaran area. Further, Samarinda city will become increasingly congested and impose penalties on port users. The disbenefit is assumed to be on the same cost basis as the avoided costs above. However, for the reasons above, it is assumed that in year 1 of operation the disbenefit for container traffic will be 100 % of the maximum. By 2025 this percentage is assumed to fall to 20 % with the increasing relocation of businesses (In this regard, Palaran is assumed have a locational advantage over Marang Kayu). Traffic is forecast only up to 2025 and therefore, by convention, all benefits are kept constant thereafter to avoid overestimation Unquantified Costs and Benefits Environmental and social impacts are usually impossible or very difficult to quantify in monetary terms. Similarly, the generation of employment and employment opportunities, development of the economy and the facilitation of agriculture, trade and industry are all aspects which this project will help develop in a very important manner. As described in Chapters 8 and 9, East Kalimantan province is resource rich and requires improved river/sea transport to provide much needed support to exploit these resources. The Samarinda Port Master plan sets out to significantly support economic development through the phased implementation of infrastructure and equipment, together with associated operational and related improvements. The net benefits are shadow priced at Conventionally, only benefits to Indonesian shippers and others are included. Therefore, 10% of benefits were assumed to accrue to foreign entities Residual Values The cost of land was allowed to appreciate at 3 % in real terms per year as part of the residual value in It is also assumed that none of the equipment but that all infrastructure provided between 2020 and 2036 will have 50% life remaining. The resultant value (about US$18.0 million) has little discernable effect on the EIRR Results of the Economic Evaluation The EIRR for the proposed Master Plan was estimated as shown in Table which also shows the sensitivity analysis
34 Table EIRR Analysis for Samarinda Port Master Plan-4 Berth Option Samarinda Port Master Plan EIRR of the 4 Berth option All Costs: Plus 10% Benefits: Minus10% Costs and Benefits Reductions in columns (2) and (3) Combined (1) (2) (3) (4) EIRR (%) The EIRR analysis show that the Master Plan is economically viable and that even with two unfavourable factors, combined the EIRR remains well above 15 percent. At 15 % discount rate, the Net Present Value (NPV) amounts to Rp. 171,806 million. Any positive value of the NPV means the project is viable. Table EIRR Analysis for Samarinda Port Master Plan-6 Berth Option Samarinda Port Master Plan EIRR of the 6 Berth Option Cost + 10% Benefits-10% Costs and Benefits Reductions in columns (2) and (3) Combined (1) (2) (3) (4) EIRR (%) The 6-berth option costs significantly more than the 4-berth, but the incremental benefits between options are either small or not easily measurable. Therefore, the 6-berth imposes additional costs over the 4-berth, but very few additional and measurable benefits. The EIRR analysis show that the 6-berth Master Plan is economically viable but that with two unfavourable factors, combined the EIRR falls to 13.8 percent. At 15 % discount rate, the Net Present Value (NPV) amounts to Rp. 65,460 million. Any positive value of the NPV means the project is viable. It would appear, unless there are measurable benefits and differences between the 4- and 6-berth scenarios, that the 6-berth imposes additional costs for few additional benefits
35 Table ECONOMIC ANALYSIS EIRR AND NPV for SAMARINDA 4 BERTH -MASTER PLAN Nu mbe r Year Container Benefits General Cargo Avoided Cost Benefits Land Transport Disbenefits NET BENEFIT Capital Costs Maintenance and Dredging Costs NET COST BENEFITS ,678 0 (6,678) ,493 0 (110,493) ,280 0 (173,280) , ,574 77,274 (23,282) 44, ,204 29, , , ,527 (27,164) 61,773-1,460-15,564 44, , , ,350 (25,512) 82,105-57,391-15,935 8, , , ,424 (22,716) 103, ,414-17,217 (39,037) , , ,869 (26,387) 125, , , , , ,259 (29,778) 148, , , , , ,905 (32,395) 153, , , , , ,006 (34,776) 158, , , , , ,140 (36,906) 164, , , , , ,306 (38,776) 170,734-15,102-21, , , , ,297 (40,056) 177,139-46,401-22, , , , ,110 (41,133) 183, ,995-22,516 60, , , ,172 (42,008) 190, , , , , ,548 (42,683) 198,425-10,757-26, , , , ,543 (42,936) 206,518-5,622-27, , , , ,211 (43,253) 215, , , , , ,075 (43,201) 223, , , , , ,615 (43,193) 232, , , , , ,775 (43,031) 240,690-5,622-28, , ,690-59,346-28, , , , , ,690-4,345-28, , , , , ,690-32,879-28, , ,690-63,205-28, , , , , , , , , , , ,690-31,603-28, , ,690-20,724-28, , , , ,243 Residual Value Land 13,200 36,061 Infrastructure Total Capital and Annual Costs= (in 1,614,360 EIRR= 21.8% 171, SCF 0.9 Carried in Indonesian Ships
36 Table ECONOMIC ANALYSIS EIRR AND NPV for SAMARINDA 6 BERTH-MASTERPLAN Num ber Year Container Benefits General Cargo Avoided Cost Benefits Land Transport Disbenefits NET BENEFIT Capital Costs Maintenance and Dredging Costs NET COST BENEFITS (8,139) - (8,139) (129,851) - (129,851) (241,828) - (241,828) ,135 1,226 27,869 71,230 11,677 49,470 - (17,776) 31, ,202 1,242 45,099 89,542 11,213 65,068 (1,460) (17,776) 45, ,297 1,257 60, ,975 10,315 79,465 (54,526) (17,776) 7, ,423 1,271 75, ,339 9,377 93,838 (122,731) (18,675) (47,567) ,580 1,284 96, ,562 9, ,541 - (21,459) 91, ,769 1, , ,281 8, ,463 - (21,459) 111, ,991 1, , ,087 8, ,184 - (21,459) 117, ,247 1, , ,348 8, ,264 - (21,459) 124, ,539 1, , ,766 8, ,459 (30,674) (21,459) 101, ,867 1, , ,342 7, ,775 (104,073) (21,459) 35, ,233 1, , ,806 7, ,012 (22,372) (23,956) 121, ,638 1, , ,280 7, ,249 (20,930) (23,956) 130, ,083 1, , ,065 7, ,735 - (25,269) 157, ,570 1, , ,907 6, ,092 (10,757) (25,287) 155, ,100 1, , ,492 6, ,247 (31,057) (25,305) 142, ,675 1, , ,811 6, ,990 (79,722) (25,323) 102, ,296 1, , ,578 6, ,284 - (27,668) 188, ,965 1, , ,083 6, ,174 - (27,688) 197, ,683 1, , ,458 5, ,953 (5,622) (27,708) 200, ,953 (90,159) (27,708) 116, ,953 - (27,708) 206, ,953 - (27,708) 206, ,953 - (27,708) 206, ,953 (32,879) (27,708) 173, ,953 (94,808) (27,708) 111, ,953 (4,345) (27,708) 201, ,953 - (27,708) 206, ,953 - (27,708) 206, ,953 (31,603) (27,708) 174, ,953 (51,537) (27,708) 325, ,243 Residual Value Land 13,200 36,061 Infrastructure Total Capital and Annual costs= (in Rp. M.) 1,906,780 EIRR= 17.2% 65, SCF 0.9 Carried in Indonesian Ships
37 30.14 Preliminary Financial Analysis Objective and Methodology of Financial Analysis (1) Objective The purpose of the financial analysis is to evaluate the financial feasibility of the project. The analysis focuses on the viability of the project. (2) Methodology 1) Viability of the Project The viability of the project is analyzed using the Discount Cash Flow Method and appraised by the Financial Internal Rate of Return (FIRR). The FIRR is the discount rate that makes the discounted costs and revenues over the project life equal, i.e., the rate "r" that satisfies the following formula: n I=1 Bi Ci ( 1 + r ) i 1 = 0 Where, n : Project life Bi : Revenue in the i-th year : the first year is the base year Ci : Cost in the i-th year r : Discount rate The revenues and costs that are taken into account for the FIRR calculation are summarized in Table Table Revenues and Costs Employed in FIRR Calculation Revenues Costs 1) Operating Revenues by the Project 1) Investments for the Project (installation of handling equipment and replacement/overhaul of equipment) 2) Operating Expenses such as Maintenance, Repair, Rental, Personnel and Other Costs The revenue and cost items excluded from the FIRR calculation are summarized in Table Table Revenues and Costs Exempted the FIRR Calculation Revenues Costs 1) Fund Management Income 1) Depreciation Cost 2) Repayment of the Loan Principal 3) Interest on Loans
38 When FIRR exceeds a certain threshold, the project is assessed to be financially feasible. The weighted average of the interest rates of various funds generated for the project is used as the threshold Assumption for Financial Analysis (1) Scope of Analysis The viability of the project was assessed using the revenues and costs related to the project. 1) Base Year Price as of year 2001 is used in this financial analysis. Price escalation due to inflation for the future is not considered. 2) Project Life Taking account of conditions of the long-term loans and service lives of port facilities, the project life for the financial analysis is determined as 33 years including 3-year design and construction period. 3) Revenues and Port Tariff Revenues for the project will be generated from receiving vessels and handling cargoes charged according to the port tariff. The present Samarinda port tariff is basically incorporated in this financial analysis. 4) Costs Capital cost and annual cost for the project are summarized in Table and Table Maintenance dredging cost is included in the annual cost of the project. 5) Fund Raising It is assumed that 85 % of the total project cost is financed by foreign funds. The remaining 15 % of the total cost is assumed to be raised by domestic funds. The following conditions are employed for each fund in this financial analysis. a. Foreign Fund The foreign loan conditions are assumed as follows: - Loan period : 30 years - Grace period : 10 years - Interest rate : 1.0 % per annum - Repayment : Fixed amount repayment of principal - Ratio of investment : Less than 85 % of the project cost b. Domestic Fund The domestic loan conditions are assumed as follows:


39


40