COMMERCIAL VEHICLES, FUEL EFFICIENCY AND CO 2
|
|
|
- Lorena Scott
- 5 years ago
- Views:
Transcription


1 COMMERCIAL VEHICLES, FUEL EFFICIENCY AND CO 2 Challenges & Possible solutions ACEA POSITION CARS21 meeting on 15 April 2011 Brussels Stefan Larsson Director Regulatory Projects 1
2 ACEA Position Fuel Efficiency is Market Driven Fuel efficiency is one of the most important competitive factors in developing and selling trucks and buses. Therefore, market forces ensure continuous progress in fuel economy and CO 2 emission reduction in the most efficient way. Our Vision 2020 expects a 20% improvement of fuel efficiency by 2020 (compared to 2005) due to these market forces. Any product-oriented legal requirement regarding fuel efficiency and CO 2 emissions should aim to further strengthen these market forces. 2
3 Challenges with a regulatory approach Using the right metric for fuel efficiency Satisfying customers expectations on fuel efficiency The huge variety of complete heavy-duty vehicles Heavy-duty vehicles are often custom-built in several stages involving different manufacturers The high number of unique and different usage patterns Using test cycles that reflects actual vehicle usage The traditional use of the combustion engine is changing when operating in hybrid vehicles 3
4 liter/100 km is not a good fuel efficiency metric for commercial vehicles as it requires same duty cycles and vehicles with similar specifications Metric based upon Fuel Used/Work Done is more relevant Challenges Using the right metric for fuel efficiency Work with respect for transport of goods can be specified in tonne-km which focuses on the weight but as loading volume is becoming more important cubic meter-km is an option and for transport of people passenger-km 4

5 Challenges Satisfying customers expectations European goods transports on roads are characterized by: High fuel prices High weights and volumes Relatively long distances Fuel efficiency has therefore since long been a 1 st priority because of its major impact on the Total Operating Costs 5


6 Challenges Fuel consumption is a customer priority Source: European Truck Customer 2010, Oliver Wyman Analysis 2 TCO= Total cost of ownership 6
7 Challenges Fuel efficiency - European versus U.S. HDVs 70 gco2/tkm* U.S. EPA has published performance requirements for Heavy-Duty vehicles. Current European long-haul trucks have already better fuel efficiency** than the US 2017 target for long-haul Class 8 vehicles. 0 EPA Baseline 2010 US Target 2017 European long-haul trucks Compared to EPA 2010 baseline current European long-haul trucks show about a 30% better efficiency**. *at 75% utilisation of loading capacity ** Recognising that difference in vehicle specification of long haul trucks is to the European advantage - 4x2 in Europe versus 6x4 in US and the location of the fifth wheel in US which results in a larger gap between cab and trailer 7


8 Challenges Huge variety of complete heavy-duty vehicles Trucks and buses are often custom-built in several stages and adjusted to specific needs concerning load, driving patterns As there is an enormous variety of different vehicle designs and resulting payloads that have significant impact on CO 2 generation there are few uniform high-volume vehicle categories. This means that CO 2 emissions of trucks and buses cannot be addressed or influenced via one-size-fits-all policies. 8


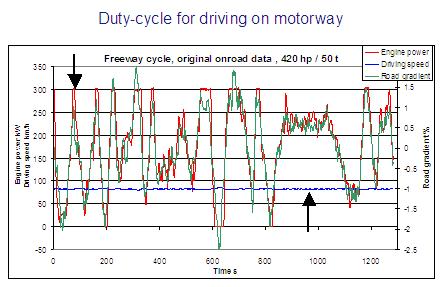


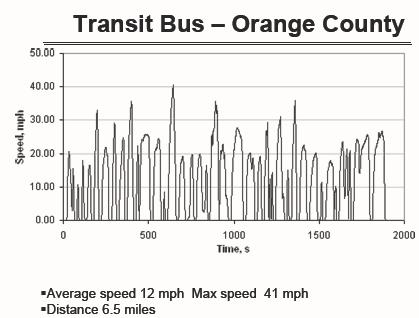
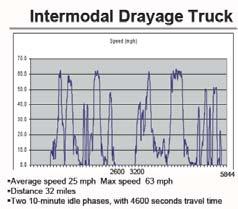


9 Challenges High number of unique & different duty cycles Due to the importance of fuel efficiency, the performance of complete HD vehicles are evaluated as close as possible to their actual usage. Millbrook driving cycle 9

10 Challenges The World Transient Vehicle Cycle (WTVC) The basis for evaluating air quality emissions from heavy-duty engines The WTVC is not an appropriate cycle for specific vehicle configuration and mission deviating from the average one, therefore cannot be used in a simulation to evaluate the fuel efficiency of complete vehicles in specific missions. Vehicle speed Engine power 10

11 Challenges The role of the combustion engines will change when operating in hybrid vehicles Parallel Hybrid Serial Hybrid This is the reason behind the OICA initiative to develop a certification procedure for HD powertrains of HEVs with respect to NOx and PM, based upon the Japanese HILS approach, as an annex to the existing WHDC GTR n 4 under the UN/ECE 1998 agreement. 11

12 DG Environment study - March 2008 European HDV Operational Efficiency Programme HDV Energy Efficiency Labelling Policy Instrument 1. Step 1: Labelling of the CO2 emissions from HDV engines as recorded by a standardised test procedure; 2. Step 2: Labelling of entire vehicles predicting the overall efficiency of a whole vehicle combination in operation. 3. Step 3: Labelling of vehicle components (such as superstructures, trailers and semi-trailers). Labelling of the fuel efficiency of tyres Revision of the Weights and Dimensions Market-Based Instruments Recommendations Recommendations 12
13 ACEA Position Possible solutions To satisfy a labelling (B2B) requirement ACEA promotes: The development of a method to calculate the fuel efficiency of complete heavy-duty vehicles according to the work done principle (g/tonkm, g/m3km or g/pass.km). Using computer simulation: - allows a large number of vehicle types to be efficiently evaluated in many different transport missions. Using a common simulation tool: - with agree assumptions and specific input data generated by agreed methods enables HDV manufacturers to provide the customers with a certified declaration of fuel efficiency for their different product offerings. A Certified declaration of fuel efficiency is the appropriate way to provide purchase guidance to professional customers 13
14 ACEA organisation WG-CO2HDV TF1 Input Data and Validation TF2 Scope and Mission TF3 Simulation Tool TF4 Green Public Procurement TF5 CO2 Buses 14
15 Possible solutions ACEA/EUCAR Project proposal ACEA and EUCAR developed a project proposal on a methodology to calculate fuel efficiency of HD Vehicles using computer simulation The project should: Define and develop common metrics and methodologies. Matching vehicle classes with missions and duty cycles. Develop a tool for calculating fuel efficiency and CO 2 generation of heavy-duty goods vehicles, buses and coaches 15
16 Simulation tool Possible solutions Chassis or combination specification, weight Rolling resistance INPUT - VEHICLE MODULES Air resistance Powertrain specification, Auxiliaries hybrids Engine map Gear box ECO equipment COMMON CORE SIMULATION PROCESSOR Mission (Speed, Road, Traffic ) Load factors Driver Climate Fuel INPUT - TRANSPORT TASK MODULES Input modules could be standardised, generic, or specific. With standardised interfaces to the core processor, input modules could be developed and improved over time Transparent declaration of inputs and results A tool generally available, (except with respect to proprietary data) to customers, manufacturers, authorities and researchers. A tool that supports an integrated approach 16
17 Possible solutions Vehicle classes and missions ACEA proposal Vehicle segmentation trucks >= 7,49 t Axle configuration Identification vehicle configuration Chassis configuration GVW Class Vehicle class 2 axles 4x2 Rigid + (Tractor) 7,49t-10t 1 R/GVW R/GVW R/GVW Rigid + (Tractor) >10-12t 2 T/R+T/GCW R/GVW R/GVW R/GVW Rigid + (Tractor) >12-16t 3 R/GVW R/GVW R/GVW Rigid >=16 t 4 R+T/GCW R+T/GCW R/GVW R/GVW R/GVW Tractor >=16t 5 T/GCW T/GCW T/GCW T/GCW 4x4 Rigid 7,49t-16t 6 R/GVW R/GVW Rigid >=16t 7 R/GVW R/GVW Long Haul One daytrip overnight Cycle allocation Tractor >=16t 8 T/GCW 3 axles 6x2/2-4 Rigid all GVW 9 R+T/GCW R+T/GCW R/GVW R/GVW Tractor all GVW 10 T/GCW T/GCW 6x4 Rigid all GVW 11 R+T/GCW R/GVW R/GVW Tractor all GVW 12 T/GCW T/GCW T/GCW 6x6 Rigid all GVW 13 R/GVW Tractor all GVW 14 T/GCW 4 axles 8x2 Rigid all GVW 15 R/GVW R/GVW 8x4 Rigid all GVW 16 R/GVW R/GVW 8x6/8x8 Rigid all GVW 17 R/GVW T = Tractor + Semitrailer R+T = Rigid + Body + Trailer R = Rigid + Body GVW = reference weight for FE simulation = vehicle individual GVW released by OEM but maximal up to legal limit (26 t for 3-axle rigid vehice) GCW = reference weight for FE-simulation = vehicle individual GCW released by OEM but maximal up to legal limit (e.g. 40 t for 18t 4x2 Tractor or 60 t for 6x4 R+T) Regional Delivery/Collectio Urban Delivery Municipal Utility Light Off-road Heavy Off-road 17
18 Possible solutions ACEA proposed cycles for truck >7.5 t GVW/GCW Vehicle cycle/mission Description Average yearly run distanc (km) Long Haul Delivery to international sites more than one day trip One daytrip Regional delivery/collection Urban delivery/collection Municipal utility Delivery to national/international sites on a 1 day trip. Distribution in cities or suburban sites of consumer goods from a central store to selling points (1 shift) (2 shifts) Regional delivery from a central warehouse to local stores (innercity or suburban, also mountain road goods collection, ) e.g. garbage trucks, road sweepers, Light off road- construction zone Off- road use - heavy off road Construction site vehicles on light mission (e.g concrete mixers) 10% off-road Construction site vehicles on heavy missions. 60% off-raod

 Vehicle performance")
![Geschwindigkeit [km/h] speed (km/h) 100 90 80 70 60 50 40 30 20 10 Definition of route Resulting](/docs-images/86/93645587/images/19-3.jpg "speed profile depending on vehicle performance/driver model 0 0 0.5 1 1.5 2 2.5 3 3.")
![5 4 Strecke [km] Distance (km) Driver model Cycles could be created by measurement of](/docs-images/86/93645587/images/19-4.jpg "representative, real and long routes and following shortening process with comparable slope, engine")
19 Drive cycles Possible solutions Main target for drive cycles is to give realistic fuel consumption values for all vehicle variants. Therefore the cycles should be defined as routes. This is the concept that most existing simulation tools have implemented. Route (grades versus distance, maximal speed limits, stops, trafic lights) Vehicle performance Geschwindigkeit [km/h] speed (km/h) Definition of route Resulting speed profile depending on vehicle performance/driver model Strecke [km] Distance (km) Driver model Cycles could be created by measurement of representative, real and long routes and following shortening process with comparable slope, engine load and engine speed profiles. The length of routes depend on the vehicle classes. 19
20 Possible solutions Additional issues under evaluation Reference cycles for all truck and bus missions Fuel map certification process Determination of total vehicle drag Power consumption of auxiliaries Concept to cover control strategies General concept on trailers and bodies 20
21 Key factors for success Possible solutions Develop a method to measure accurately the fuel efficiency of complete heavy duty vehicle. If you can t measure it, you can t manage it If it is not accurate it will not guide customer and therefore not strengthen market forces Certified declaration of fuel efficiency is also a validation activity of both the method and its accuracy 21
22 Integrated Approach Possible solutions Road freight (2010) Transport planning Vehicle Operation Road infrastructure Alternative Fuels New Vehicles Road freight (2050) CO2 emission reductions -X% Improved logistic Freight consolidation Optimised packaging -X% Use higher capacity vehicles like the EMS Share Best Practices - Improved utilisation - Driver training - Predictive driving. -X% Removal of bottlenecks Improved traffic flow (minimize stops) Telematic support -X% Biofuel mixing 2 nd and 3 rd generation biofuels. -X% Improved energy efficiency*. * Will also require changes of existing vehicle size and weight legislation Decoupling of CO2-emissions of road freight transport and economic growth can be achieved by an integrated approach. 22
23 ACEA survey on FE measures A recent ACEA survey have identified the following low cost FE measures: Chassis cab Biofuel mixing/biofuels Automatic gear shift logic Low rolling resistance tyres Super single Body Aerodynamic improvements* front, rear, side and top Trailers Low rolling resistance tyres Super single Aerodynamic improvements* front, rear, side, top and bottom Weight reduction ACEA results * Long haul 23
24 ACEA results ACEA survey on FE measures A recent ACEA survey have identified the following low cost FE measures: Vehicle usage Driver training Eco driving tool Driver support Freight consolidation Higher capacity vehicles (Wider use of EMS) Fuels Fee/Tax related to the global warming potential of fuels 24
25 ACEA further supports ACEA position Taking an integrated approach to further CO 2 emission reductions. Using cost-effectiveness as the basis for selecting policy measures for the different sectors. Studying the inclusion of road freight transport into an international, non-sector specific emission trading scheme. Pursuing globally harmonised policies for heavy-duty vehicles. 25


26 Vehicle manufacturers are already investing in new technologies to improve fuel efficiency and to reduce CO 2 Mercedes-Benz H2 FC City Bus SCANIA Ethanol Bus VOLVO Hybrid Bus Thank you for your attention! DAF Hybrid Truck IVECO Eurocargo Ibrido MAN Hybrid Distribution Truck 26
27 White Paper on Transport Policy Back up slides on the 2011 White Paper on Transport 27

28 White paper on Transport Policy The lack of specific road freight measures in the White Paper raises the following questions: Is the actual performance of rail becoming a political obstacle to cost-effective fuel-efficiency improvements of road freight? On what basis has the rail freight measures been evaluated? Reliable data to answer the above questions are non existing Source: Report for the 15th ACEA Scientific Advisory Group Meeting Brussels, 8th September 2010 Professor Alan McKinnon Logistics Research Centre, Heriot-Watt University, Edinburgh, UK 28


29 White Paper on Transport Policy White Paper on Transport Policy - Modal shift >? km Transport cost according to distance Local conditions and distances to main markets have a major impact on road freight transport distances The divide between road and rail solutions takes place according to a threshold distance, D 0, whereby, road is cheaper for short distances, rail for long distances. The value of this threshold is debatable, although the average of 500 km or even 800 km is often quoted. EU12 ~ 60% EU15 ~ 35 % % of road freight transports above 500 km EU policies must respect regional differences 29
30 White Paper on Transport Policy Rail and road are complementary modes - EU The value of goods in relation to transport modes Share (%) 100 Air 75 Road Sea Rail Source: Kenth Lumsden, CTH (1 =10SEK) Goods value ( /kg) Increase or decrease of road transport costs will not shift significant amount of goods to or from rail since road and rail handle goods of very different values 30
31 White Paper on Transport Policy Rail and road are complementary modes - USA Value of Shipments by Transportation Mode: 2009 (billions of 2007 dollars) Other & unknown 2% Multiple modes & mail 18% Air, air & truck 6% Water 2% Rail 3% Pipeline 4% Truck 65% Truck Rail Water Air, air & truck Multiple modes & mail Pipeline Other & unknown Source: U.S. Department of Transportation, Federal Highway Administration, Office of Freight Management and Operations, Freight Analysis Framework, version 3.1, 2010 Increase or decrease of road transport costs will not shift significant amount of goods to or from rail since road and rail handle goods of very different values 31
32 White Paper on Transport Policy European rail freight versus US US Congress passed the Staggers Act in October In short, Congress decided that railroads should be run by railroads, not by the government. To stay competitive with respect to cost all modes have to improve their efficiency The principle of co-modality. 32
 Alternative baseline scenario Includes for: Fuels Harmonisation of fuel prices (resources cost, excise duty, vat) Road User")
33 TREMOVE and White Paper on Transport Policy TREMOVE (only model trips above 500 km) Alternative baseline scenario Includes for: Fuels Harmonisation of fuel prices (resources cost, excise duty, vat) Road User charging on trucks and cars implemented as road charges on all interurban network (not only motorway) RAIL Liberalisation: 3rd railway package (gradual opening up of int. rail services to competition) White Paper on Transport Policy According to TREMOVE Alternative scenario HDVs will still in 2030 transport more than million tkm, by trips above 500 km, after all the envisioned measures have been implemented 33