The City of Burlington Asset Management Plan
|
|
|
- Ronald Cunningham
- 5 years ago
- Views:
Transcription

1 The City of Burlington 2016 Asset Management Plan

2
3 Table of Contents Executive Summary (Infographic) Introduction Importance of Asset Management at the City of Burlington Purpose of Developing an Asset Management Plan Factors Influencing the Asset Management Plan Asset Management Plan Methodolgy & Approach Summary Roadways Pavements State of Local Infrastructure Long Term Needs Expected Levels of Service Asset Management Strategy Bridges & Large Culverts State of Local Infrastructure Long Term Needs Expected Levels of Service Asset Management Strategy Storm Sewer Network State of Local Infrastructure Long Term Needs Expected Levels of Service Asset Management Strategy Pedestrian Network State of Local Infrastructure Long Term Needs Expected Levels of Service Asset Management Strategy Walls State of Local Infrastructure Long Term Needs Expected Levels of Service Asset Management Strategy
4 Parking, Traffic Control & Safety State of Local Infrastructure Long Term Needs Expected Levels of Service Asset Management Strategy Buildings and Facilities State of Local Infrastructure Long Term Needs Expected Levels of Service Asset Management Strategy Parks & Land Improvements Parks State of Local Infrastructure Long Term Needs Expected Levels of Service Asset Management Strategy Land Improvements Storm Water Management State of Local Infrastructure Long Term Needs Expected Levels of Service Asset Management Strategy Fleet - Vehicles & Equipment State of Local Infrastructure Long Term Needs Expected Levels of Service Asset Management Strategy Information Technology (IT) Services State of Local Infrastructure Long Term Needs Expected Levels of Service Asset Management Strategy Financial Section Plan Improvement & Monitoring Continuous Improvement and Monitoring Update Frequency Improvement Plan Short/Medium Term Targets Long Term Targets Training and Resourcing
5 Tables and Figures Figures Figure 1.1 Typical Local Road Cross Section Figure 1.2 Typical Local Road Pavement Cross Section Figure 1.3 Long-Term Needs Summary Figure 1.4 Arterial Road Pavement Cross Section Figure 1.5 Replacement Cost for Pavements by Type Figure 1.6 Average Age by Pavement Type Figure 1.7 Pavement Condition by Length Figure 1.8 Road Deterioration Curve with Strategies and Intervention Point Triggers Figure 1.9 Storm Point Replacement Cost Figure 1.10 Storm Point Age Distribution Figure 2.1 Long Term Needs Figure 2.2 Building Systems Pair-Wise Category Figure 2.3 Asset FCI Pair-Wise Category Figure 2.4 Requirement Pair-Wise Category Figure 3.1 Long Term Needs Figure Long Term Needs Figure 5.1 Annual Renewal Need Figure Long Term Needs Figure 7.1 Replacement Values by Asset Category [$Millions] Figure 7.2 Infrastructure Need [$Millions] Tables Table 1.1 Roadway Asset Category Inventory Summary Table 1.2 Asset Value - Pavement Assets Table 1.3 Asset Condition Grade Summary Table 1.4 Average PQI by Pavement Asset Type Table 1.5 Asset Value - Bridges & Large Culverts Table 1.6 Asset Useful Life Table 1.7 Asset Condition Grade System: Bridges & Large Culverts Table 1.8 Average BCI - Bridges Table 1.9 Average BCI - Large Culverts Table 1.10 Asset Value - Storm Sewer and Related Structures Table 1.11 Asset Condition Grade System - Storm Sewers Table 1.12 Average Condition Grade by Storm Sewer Asset Type Table 1.13 Condition Grade Distribution by Storm Sewer Asset Type Table 1.14 Condition Grade Distribution by Storm Sewer Structure Type Table 1.15 Asset Value Pedestrian Network Table 1.16 Asset Condition Grade System Pedestrian Network Table 1.17 Remaining Useful Life by Pedestrian Network Surface Type
6 Table 1.18 Asset Value Noise Walls & Retaining Walls Table 1.19 Noise Wall Condition Table 1.20 Retaining Wall Condition Table 1.21 Parking, Traffic Control and Safety Assets Table 1.22 Parking, Traffic Control and Safety Assets Table 1.23 Asset Useful Life Table 1.24 Asset Condition Grade System Parking, Traffic Control & Safety Table 1.25 Average Condition Grade by Parking, Traffic Control and Safety Assets Table 2.1 Facilities & Buildings Inventory Table 2.2 Asset Value Facilities & Buildings Table 2.3 Asset Condition Grade System Facilities & Buildings Table 2.4 Number of Buildings by Condition Grade Table 3.1 Asset Inventory and Asset Value Parks & Land Improvements Table 3.2 Asset Condition Grade System Parks & Land Improvements Table 3.3 Asset Condition Parks & Land Improvements Table 4.1 Stormwater Management Assets Table 4.2 Estimated Current Asset Value Table 4.3 Asset Condition Grade Summary Table 4.4 Creek Erosion Control Infrastructure Table 5.1 Asset Inventory Vehicles & Equipment Table 5.2 Asset Value Vehicles & Equipment Table 5.3 Asset Condition Grade System Fleet & Equipment Table 5.4 Fleet Vehicle & Equipment Condition Grade Table 6.1 Asset Inventory IT Services Table 6.2 Asset Value IT Assets Table 6.3 Asset Condition Grade System IT Services Table 6.4 Hardware Condition Processes Table 6.5 Hardware Condition Grade Table 6.6 Software Condition Grade Table 6.7 IT Services Key Performance Indicators Table 7.1 Unfunded Renewal Need by Asset Category [$Thousands] Table 7.2 Historical Capital Expenditures [$Thousands] Table 7.3 Historical Operating Expenditures [$Thousands] Table Yr. Average Renewal Need by Asset Category
7 Photo or graphic page to break up text/sections The City of Burlington 2017 Assest Management Plan
8 $2.94 Billion Total Replacement Value $67.5 Million Average Annual Renewal Need This includes roadways, facilities and buildings, fleet vehicles and equipment, parks and land improvements, stormwater management, and information technology services. $547 Million Facilities and Buildings $16,000 Is the per-capita share of the total replacement value $368 Is the per-capita annual cost to renew City infrastructure * $2.01 Billion Roadways $200 Million Parks and Land Improvements $66.5 Million Stormwater Management $70.6 Million Fleet * Based on population of 183,314. (2016 Census Profile) The per-capita renewal cost does not include operating expenditures $44.7 Million Information Technology Services

9 Photo or graphic page to break up text/sections The City of Burlington 2016 Asset Management Plan

10 Introduction This Asset Management Plan (AMP) is a comprehensive document outlining the management of the city s infrastructure assets and making informed decisions in order to support city services at costs that are reasonable and affordable to the public. In April 2016 Burlington City Council approved the new Strategic Plan, which sets in place the vision, where people, nature and business thrive and four strategic directions for the City over the next 25 years. The AMP supports the development of our strategic direction of an Engaging City through good governance of infrastructure and common corporate objectives and priorities. The Strategic Plan is supported by a number of key medium-term policy documents and short-term implementation plans. These documents and plans are the framework for critical decision-making about managing asset investments and/or resources. Asset management is embedded in most corporate plans and strategies, including but not limited to; the Official Plan, Long-Term Financial Plan, and the City s Budget. As recognized by the Strategic Plan, the City of Burlington is undergoing an important transition, and is facing a number of economic and demographic changes. The City, as part of its core mandate of providing a range of critical services, has adopted a new mandate: to actively city-build. As this shift occurs, the City needs to make planned investments in our existing infrastructure and be readily prepared for future infrastructure growth. The implementation of an asset management policy, strategy and plan is necessary to adapt to infrastructure challenges as the City continues to grow. Introduction
11 All levels of government have recognized that well planned and maintained public infrastructure is central to the support of crucial services delivered by municipalities Importance of Asset Management at the City of Burlington Asset management at the City of Burlington represents the management of infrastructure, using proven life-cycle strategies that have been evolving over a number of years. Throughout this time, the City has built an Asset Management System focused on putting in place the structure, people, systems, and decision support processes required to carry out infrastructure planning, and identifying emerging infrastructure challenges. This has culminated in the establishment of a long term strategy to address the City s investment in infrastructure. In the pursuit to develop into a mature asset management organization, a framework for a consistent and coordinated approach to the City s asset management practices was established. Recent initiatives and successes include the: Development of an asset management service business plan describing the role of asset management at the city, highlighting continuous improvements, and identifying short, medium and long term objectives; Formalized Asset Management Team, with expanded representation from across the Corporation; Development of an Asset Management Policy by the Asset Management Team, endorsed by the Burlington Leadership Team (BLT) and received by Council; Completion of data collection and condition assessment, and calculation of the current inventory and replacement value for a greater number of assets in the corporate portfolio; and Greater alignment with requirements set out in the ISO Standard and International Infrastructure Management Manual (IIMM) published by the IPEWA (Institute of Public Works Engineering Australasia) Purpose of Developing an Asset Management Plan All levels of government have recognized that well planned and maintained public infrastructure is central to the support of crucial services delivered by municipalities. In 2012, The Ministry of Infrastructure Ontario mandated that each municipality would have an AMP in place by December 31, A framework document was created entitled Building Together: Guide for Municipal Asset Management Plans which established general guidelines for municipalities to follow during the plan development process. This AMP is based on these provincial requirements outlined in the document, however was expanded to account for all asset categories within the city, all of which are not mandated. The result is a document that is comprehensive and accounts for the City s entire asset inventory (excluding City-owned land). The City of Burlington 2016 Asset Management Plan

12 Factors Influencing the Asset Management Plan This AMP has a number of dynamics associated with it and throughout its preparation the City has taken into account such issues as: What are the future levels of demand? Will required Levels of Service change? Will assets deteriorate at the assumed rate? How will risks change over time? What new technology will become available? What are the future changes in legislation and regulation? What will the economic business environment be like in the future? In addition, there are a number of global and macro-economic mega trends that will have a major impact on municipal asset management in the future. Given the long-term nature of infrastructure investments, it is critical that the City does not build tomorrow s infrastructure with a myopic view of today s needs. It is important that as part of the implementation and evolution of this AMP these trends are considered as the City selects specific projects that will be undertaken. Some of the key mega trends that may impact the City include: Continued Aging of Infrastructure; Impacts of Climate Change; Aging Demographic Trends; Urbanization and Intensification; Globalization and Productivity; Changing Economy and Workplaces; New Political and Fiscal Currents; Impact of Increased Cost of Debt; Evolving Asset Financing/Funding Responsibilities between Levels of Government; Scope and Pace of Technological Change; Demand for Energy and Conservation Measures; and Re-engineered Road-Intersections, Cycling, Pedestrian and Parking Arrangements. The actual impact of any of these trends, as well as the timing of the impacts cannot be accurately determined. Additionally, many of the strategies to address these issues will be driven by senior levels of government. However, it is recommended that the City consider these issues, and others that will arise over time, when making critical infrastructure decisions and to integrate flexibility and resiliency in design features. Introduction

13 A City that Grows > talent, good jobs and economic opportunity while having balanced, targeted population newcomers and seniors. A City that Moves >> People and goods move throughout the city more with regional patterns are the norm. Walkability within new/ transitioning neighbourhoods and the downtown are a reality. Asset Management Plan Methodology & Approach This plan was developed by the City to follow the best practices from the following sources: Ontario s Building Together Guide for Municipal Asset Management Plans, the National Guide to Sustainable Municipal Infrastructure (2002), also known as the InfraGuide and International Infrastructure Management Manual. The following asset categories are addressed in this report: Roadways Facilities & Buildings Parks and Land Improvements Fleet - Vehicles and Equipment Storm Water Management Information Technology (IT) Services Within each of the six asset categories listed, the AMP is organized into the following key areas of focus: Section 1: State of Local Infrastructure Section 2: Levels of Service Section 3: Asset Management Strategy A detailed questionnaire was populated by subject matter experts from across the Corporation in order to inform the asset category sections. Following the above three sections by asset category, the AMP concludes with a Financial Section providing a consolidated view of the City s infrastructure needs and is followed by a section on Continuous Improvement and Monitoring to highlight next steps in regards to advancing the AMP. The following describes in detail the three areas of focus for the AMP; A Healthy and Greener City > environment while encouraging An Engaging City >> Community members are engaged, empowered, welcomed and well-served by their city. Culture and community activities thrive, creating a positive community. The City of Burlington 2016 Asset Management Plan
14 State of Local Infrastructure The State of Local Infrastructure summarizes the quantity, or number of assets in data inventories, provides a replacment cost valuation of the assets, and summarizes the overall condition of each asset or asset group. Infrastructure Data Inventory - What infrastructure do you own? Analysis of existing data and of data sources; Transfer of physical characteristic information into databases; and Document inventory of all assets Replacement Costs - What is it worth? Define unit prices for replacement; Calculate replacement costs of all assets; and Input data in the Asset Information Systems (AIS) and analytical tools. Condition Assessment - What is its condition and remaining useful life? Collect condition assessment data; Computing condition assessment indices and grades; Statistical analysis to verify estimated useful lives; and Determination of useful life of all infrastructure assets Levels of Service Levels of Service (LOS) are a reflection of the quality, function and capacity of the City services being delivered. They support the technical and legislative requirements as well as Council directives that are influenced by the community s needs and expectations. The following factors have a direct impact on levels of service. Strategic goals, Mandatory requirements, legislated obligations to ensure infrastructure meets a certain technical requirement (primarily for public safety) Community expectations influence the accepted quality and function of an asset Affordability is the City s ability to fund strategic goals, satisfy mandatory requirements, and meet community expectations Asset Management Strategy The asset management strategy outlines specific planned actions and activities that enable the assets to provide desired levels of service What needs to be done to rehabilitate, replace, operate and maintain these assets? Upload condition data in AIS and process information; Review the effect of different rehabilitation/replacement options; Consideration of lifecycle costs and asset optimization; and Determine financial requirements to address the needs identified. Introduction
15 Financial Section This section provides a summary of the financial information presented as part of the individual asset category in order to have an overall understanding of the financial need of the city s infrastructure. The financial data and future projections are based on the current asset inventory and condition information to date. What is the long term need? Identification of the unfunded renewal need Development of a 60-year needs model; and Informs the Capital Budget & Forecast Summary The AMP will discuss the state of the local infrastructure, levels of service and asset management strategies specific to the six asset categories; Roadways, Facilities & Buildings, Parks and Land Improvements, Fleet, Storm Water Management and Information Technology (IT) Services. In essence they are mini asset management plans within the broader context of the overall City AMP. In each of these asset-category sections, there are asset valuations included; however the majority of financial information is summarized in the Financial Section in order to evaluate all corporate infrastructure collectively. As this is a living document, it will be continually edited and updated. Many of the expected changes to future versions of this AMP are summarized in the last section of this document under Plan Improvement and Monitoring. The City of Burlington 2016 Asset Management Plan

16 Acknowledgements The Asset Management Team wishes to acknowledge the contributions of all City of Burlington staff involved in this undertaking. The team is particularly thankful to the asset leads and subject matter experts who provided expertise that assisted in the compilation, analysis and final development of this Asset Management Plan.

17 Photo or graphic page to break up text/sections 2 The City of Burlington 2016 Asset Management Plan

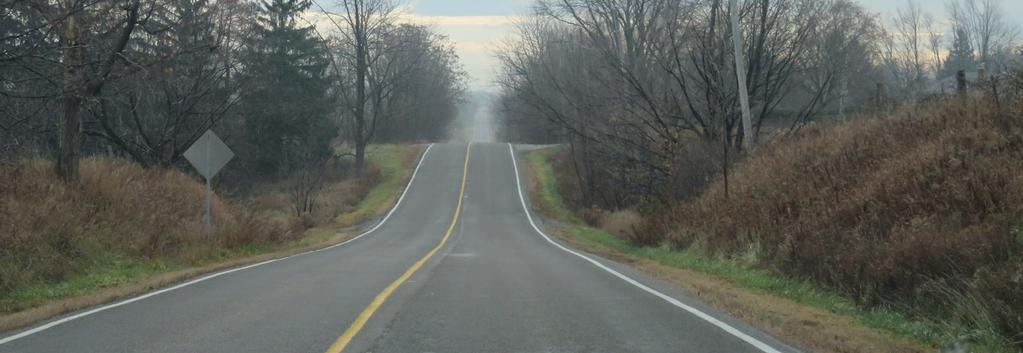
18 Roadways Roadways provide significant benefits as they are at the core of an integrated transportation system and they support services that are essential for the community in terms of quality of life, public safety, sustainability, and economic benefit. Roadways are Burlington s largest asset category in terms of replacement cost and quantity. Given the overall value of the roadway category, the effective management of these assets is critical. As per Burlington s Strategic Plan, 4.1 Good Governance, the city is committed to keeping infrastructure in good condition and properly maintained. The vision/mission, specific for Roadway assets, is that they will be maintained and upgraded according to service levels aimed at achieving the highest possible standards in terms of roadway safety, livability, aesthetics, convenience and mobility based on a sustainable financial plan. The overall goal in the management of roadway assets is to avoid significant network deterioration and maintain the current levels of service. This Council approved strategy optimizes the rehabilitation and replacement of city assets in order to achieve the longest service life at the lowest overall life-cycle cost. The Right of Way (ROW), or road allowance, is a type of easement granted or reserved over the land for transportation purposes. The ROW identifies the ultimate area which will be required to accommodate new or expanded infrastructure requirements for vehicular traffic, public transit, cycling facilities, pedestrian networks, utilities, street furniture and landscaping. All major infrastructure and related components that make up the transportation network and which fall under municipal jurisdiction are contained in the ROW (see examples in Figure 1.1). Infrastructure assets types within the Roadway asset category in this AMP include pavements, bridges and large culverts, storm sewers, pedestrian network, walls, and parking, traffic control and safety. Roadways 3
19 Figure Typical Local Road Cross Section HYDRO POLE WITH STREET LIGHTING TRAFFIC SIGNAL All major infrastructure and related components that make up the transportation network are contained in the right of way SIDEWALK Pavements SUBDRAIN CATCHBASIN PAVEMENT STRUCTURE WEARING SURFACE ASPHALT BASE ASPHALT GRANULAR A ROADBASE GRANULAR B ROAD SUBBASE STORM SEWER RIGHT OF WAY/ROAD ALLOWANCE RETAINING WALL Pavements are defined as the durable hard surfaces of the road. The primary function of pavement is to transmit loads to the sub-base and underlying soil. Modern flexible pavements contain sand and gravel or crushed stone compacted with a binder of bituminous material, such as asphalt, or tar. Such a pavement has enough plasticity to absorb shock. Rigid pavements are made of concrete, composed of coarse and fine aggregate and portland cement, and usually reinforced with steel rod or mesh. Figure Typical Local Road Pavement Cross Section 8.5m SIGN MAXIMUM 50 SUBDRAIN CATCHBASIN SIDEWALK Wearing Surface: 50mm HL3 Base Layer: 40mm HL8 Granular A: 150mm Granular B: 250mm Bridges & Large Culverts Under the Roadway asset category there are two significant types of structures; bridges and large culverts. Bridges and large culverts are defined as structures which provide a roadway or walkway for the passage of vehicles, pedestrians or cyclists across an obstruction, gap or facility and are greater than or equal to 3 m in span. 4 The City of Burlington 2016 Asset Management Plan
20 Storm Sewer Network The storm sewer network is composed of two types; storm sewer pipes and storm sewer structures. Pipes can come in many different cross-sectional shapes (rectangular, square, oval, and most commonly, circular). Pipes made of different materials can also be used, such as brick, concrete, polyvinyl chloride (PVC), high-density polyethylene (HDPE) or galvanized corrugate steel (CSP). Storm sewer structures are access points to the system for maintenance or inspection (i.e. Maintenance Hole MH) or inlet structures designed to catch the run off water from hard surfaces. Pedestrian Network Under the Roadway asset category, the pedestrian network is defined as sidewalks and/ or off-road multi-use pathways within the ROW. Sidewalks are paved (concrete) walkways that support pedestrian traffic and typically run parallel to the roadway. Off-road multi-use pathways are paved (asphalt) or unpaved (gravel) facilities, typically adjacent sidewalks and are used by a range of non-motorized travelers. Generally these paths are most frequently used by cyclists and joggers. All trails and/or pathways that exist outside the ROW property lines are captured in the Parks and Land Improvement section of the AMP. The only exception to this are pathways that extend perpendicular from the roadway into a park or an adjacent street. Walls Walls are constructed for very specific purposes within the ROW and as such are classified into two types; retaining and noise. Retaining walls are the primary type of earth retaining structure within the road ROW. They include any structure (not connected to a bridge) that is intended to stabilize an unstable soil mass by providing support or reinforcement. The noise walls acts as a solid obstruction, built in-place between the noise source and the receiver. They are used for absorbing and/or blocking unwanted noise from commercial/ industrial operations, or vehicular. Parking, Traffic Control & Safety Under the Roadway asset category, the components that make up the balance of the roadway assets are Parking Lots, Signs, Street Lights, Traffic Signals, Transit Shelters and Guiderails. These assets support the delivery of efficient and safe transportation throughout the city. Roadways 5
21 Summary Table 1.1 illustrates the approximate quantity of each asset type managed as part of Burlington s Roadway Asset category. Table 1.1 Roadway Asset Category Inventory Summary Asset Type Unit Quantity Pavement km 1,614 Bridges & Large Culverts ea. 140 Storm Network (Pipes) km 759 Storm Network (Structures) ea. 26,803 Pedestrian Network km Walls (Noise & Retaining) ea. 252 Parking Lots & Equipment ea. 156 Signs (Traffic & Highway Gateway) and Posts ea. 36,988 Streetlights (Fixtures and Plant) ea. 26,427 Traffic Signals & Communication Network ea. 120 Transit Shelters & Pads ea. 231 Guiderails km 22.5 Further details about each asset type are provided in the asset type-specific subsections below. Long-Term Needs Summary Figure 1.3 below provides a 60-year average capital renewal need for Roadways assets. This represents the estimated amount of capital the City requires to reinvest in its existing Roadways asset inventory on an annual basis to sustain the current level of service. The average need is based on optimized capital life cycle cost where assets are managed at the lowest cost and risk through their useful life. The average need for all Roadways assets is $42.7M The unfunded renewal need in the below chart is estimated at $108M. This is defined as the unfunded value of infrastructure renewal needs that require immediate attention as of the current year. Figure Long-Term Needs Summary Millions $120 $100 $80 $60 $40 60 Year Average Renewal Need, $42.7M $20 $0 Unfunded Now Need Unfunded Renewal Need Annual Renewal Need Average Renewal Need (60yr) 6 The City of Burlington 2016 Asset Management Plan

22 State of Local Infrastructure Pavement Asset Data Inventory With over 1600km of paved surface, having a good information system and an up to date comprehensive asset data inventory is critical for making informed decisions. The asset information system used to store, manage and analyze pavement data is called a PMA Pavement Management Application. It serves as the home for all data related to the geometry, performance, traffic volume, pavement structure, and rehabilitation history of all individual pavement sections. A section represents a length of pavement, typically intersection to intersection. Pavement sections are managed based on their construction cross section. The PMA currently tracks over 1900 sections of pavement across the city. As sections are rehabilitated or replaced, updates are made to the PMA database to reflect the current condition. Formal quality checks are performed on the data regularly to verify the completeness and accuracy. Connected to the PMA database, a decision support system is used to predict future rehabilitation treatments, timing and cost for a 60 year time horizon. Together, these synchronized systems can accurately predict pavement deterioration, required investment, and resulting condition for the city pavement assets. Asset Valuation The cross section and geometry of the pavement section needs to be understood in order to determine its replacement cost. Typically the pavement structure includes an underlying granular base for drainage, a base course of asphalt to support the traffic load, a wearing course or toplift of asphalt to provide a smooth riding surface, and the curb & gutter for the drainage of storm water. Figure Arterial Road Pavement Cross Section 7.0m Wearing Surface: 50mm HL3 Base Layer: 80mm HL8 Granular A: 150mm Granular B: 300mm The cross section of the road determines the pavement asset type. Road classes, such as Arterial roads, will have a much thicker structure than a Local road since it carries much more traffic and heavier loads. The PMA has been populated with these pavement cross sections using historic record drawings. There are two methods used to determine the replacement unit cost. A 3-Year historic construction cost average is used to obtain actual construction costs that the city has incurred. To account for bid fluctuations and differing project scopes, a standardized costing index was also utilized. The two costs are averaged and applied to all pavements, which allows for the calculation of the overall replacement cost of the pavement network. All associated costs related to the construction of a pavement section such as design, survey, construction, testing, contract administration, inspection, and final acquisition of the newly constructed asset are included in the unit cost. Replacement costs are calculated in current year dollars, and are reviewed and updated bi-annually. Roadways 7
23 Estimated Current Asset Value The value of pavement network is estimated at $1.3 Billion. Table 1.2 and the Figure 1.5 below provides detail on the pavement network by pavement asset type, including the estimated replacement value. Pavement represents 43% of the total asset base Table 1.2 Asset Value - Pavement Assets Pavement Asset Type Quantity (km) Arterial - Rural $13,300,456 Arterial - Urban $379,963,818 Collector - Commercial / Industrial $41,024,286 Collector - Residential $211,924,117 Collector - Rural $19,577,584 Local - Commercial / Industrial $23,475,300 Local - Residential $549,814,015 Local - Rural $34,110,857 Estimated Replacement Value Total 1, $1,273,190,433 Figure Replacement Cost for Pavements by Type 2% Local - Commercial/Industrial 1% Collector - Rural 17% Collector - Residential 3% Collector - Commercial/Industrial 30% Arterial - Urban 1% Arterial - Rural 3% Local - Rural 43% Local - Residential 8 The City of Burlington 2016 Asset Management Plan
24 Asset Useful Life The useful life of a pavement section is the time period from initial construction to full reconstruction. Although layers in a pavement structure (granular base, base asphalt, and wearing surface) have different useful lives; the average pavement section has an estimated useful life of 60 years. Over the life of the pavement section, maintenance and rehabilitation treatments will occur in order to maximize useful life before a full reconstruction is required. Figure Average Age By Pavement Type Age Arterial (no curb) Arterial (with curb) Arterial Composite Pavement Collector - Commercial / Industrial (no curb) Collector - Commercial / Industrial (with curb) Collector - Residential (no curb) Collector - Residential (with curb) Local - Commercial / Industrial (no curb) Local - Commercial / Industrial (with curb) Local - Residential (concrete pavement) Local - Residential (no curb) Local - Residential (with curb) Surface Treated Age Useful Life Mid Life Roadways 9
25 Asset Condition Assessments Pavements represent the largest investment in the City. Understanding the current condition or health of pavement sections allows staff to select the correct rehabilitation treatment and prioritize the construction program in a manner that optimizes the available funding. The PMA deteriorates the condition based on traffic volume, asphalt thickness, and soil conditions To collect the data required to populate the PMA, a specialized automated Road Analyzer (ARAN) vehicle is contracted by the city to collect surface distress defects and ride condition data. Surface distress defects (cracking, distortions, etc) are recorded, categorized, loaded into the PMA, and computed into a Surface Distress Index which reflects the surface condition of the entire pavement section. Ride Condition data, which is a measure of the roughness of the pavement, is collected using a laser profiler on the ARAN Vehicle; the collected data is loaded into the PMA and a Ride Condition Index is computed. The Surface Distress Index and Ride Condition Index are then calculated into an overall Pavement Quality Index (PQI) that represents the condition of the entire pavement section. A PQI score of 100 would represent a road with no surface distress and excellent ride condition. A score of 20 would represent a road that has been severely compromised and is no longer providing its intended level of service. In order to standardize the condition scoring across different asset categories, the PQI is normalized into a five point grading system (Table 1.3). Table 1.3 Asset Condition Grade Summary Grade Very Good >80 Condition Range (PQI) Good 60% to 79.9% Fair 40% to 59.9% Poor 20% to 39.9% Very Poor < 20% The City conducts these specialized pavement condition assessments on a 5 year cycle. To reflect the current pavement condition, the PMA deteriorates the condition based on traffic volume, asphalt thickness, and soil conditions. The deteriorated PQI is verified annually in the field by qualified staff to ensure the system is predicting the correct condition. 10 The City of Burlington 2016 Asset Management Plan
26 Current Asset Condition Table 1.4 and Figure 1.7 provide the average PQI by Pavement Asset Type and length. Table Average PQI by Pavement Asset Type Pavement Asset Type Average PQI Condition Grade Arterial - Rural 64 Good Arterial - Urban 67 Good Collector - Commercial / Industrial 68 Good Collector - Residential 68 Good Collector - Rural 68 Good Local - Commercial / Industrial 60 Good Local - Residential 72 Good Local - Rural 64 Good Overall Average 70 Good Figure Pavement Condition by Length Long-Term Needs Summary The 60 year average capital need for Pavement assets is $27.2M. This estimated amount of capital is what City requires to reinvest in its existing Pavement asset inventory on an annual basis to sustain the current level of service. Assumptions Cross section of the pavement has been assumed using historic drawings. Pavement sections are deteriorated based on thickness, traffic volume, and soil conditions Curbs and gutters are assumed as part of the pavement Road sections have been classified into 8 types Very Poor Poor Fair Good Very Good Replacement costs are reviewed/updated every 2 years Roadways 11
27 Levels of Service - Pavement Optimization of the investment in pavement rehabilitation and replacement means doing the right thing at the right time to the right asset Strategic The City s pavement inventory represents a $1.3 billion investment, which needs to be properly managed in order to provide a safe and efficient mode of transportation for the movement of goods and provision of services. Pavement is also a critical for the community s access to emergency services. Through the Strategic Plan, the city has committed to maintaining its infrastructure in a good condition state. Planning for the rehabilitation and replacement of the pavement inventory is an essential component of the sustainability of the community. As Burlington continues to intensify, the full life cycle costs related to new development in growth areas will need to be funded and the construction aligned with the renewal of existing pavement sections. Mandated Through the Minimum Maintenance Standards for Municipal Highways the Provincial government mandates that paved and non paved surfaces are inspected on regular interval. The frequency of inspections is defined by the pavement sections traffic volume and posted speed limits. Community Expectations The community expects that their investment is well managed through an optimized rehabilitation and replacement schedule. This results in the longest life pavement at the lowest cost. A well maintained pavement inventory provides a safe traveling surface, the ability to efficiently move goods and people throughout the city, and the provision of public, private and emergency services. This AMP outlines the current city practices required to achieve these community expectations. Affordability Optimization of the investment in pavement rehabilitation and replacement means doing the right thing at the right time to the right asset. A cost effective treatment applied at the right time can maintain the performance of the pavement and ultimately lower the overall cost of ownership. If rehabilitation is not done at the optimized time, the pavement will continue to deteriorate, and require a more extensive and more expensive rehabilitation treatment. For example, if a road is resurfaced at the optimum time, it will cost x dollars. Waiting 5-7 years before initiating the work will result in a minor reconstruction at the cost 3x dollars. Deferring a minor reconstruction will result in the continued deterioration to the point where the pavement will require full replacement at 10 times the cost of resurfacing. 12 The City of Burlington 2016 Asset Management Plan

28 Asset Management Strategy - Pavement Maintain or Improve Level of Service The current average pavement inventory condition is Good. In order to maintain this performance, continued infrastructure investment is required. As the city intensifies, funding for enhancements will need to be included in order for the pavement infrastructure to deliver the multi modal service the community desires. Lifecycle Management A typical pavement section consists of 3 layers; wearing surface or top lift asphalt, base asphalt, and the granular base layer. Using age of the granular base layer and section condition as selection criteria, the city applies three main treatments for the rehabilitation of pavements. A. Resurfacing or Shave and Pave is the removal and replacement of the top lift of asphalt. This treatment is selected when the surface cracking is beginning to expand and the age is within the first 1/3 of its life. B. Minor Reconstruction involves the removal and replacement of both layers of asphalt, Wearing Surface and Base Asphalt. This treatment is required when surface cracking is much more extensive and/or there is vertical movement in the road resulting in poor ride condition. C. Full Reconstruction is the complete removal and replacement of the entire pavement system, including the wearing surface, base asphalt, and granular base material. This treatment is for pavements that can no longer be resurfaced due to advanced age and typical involve replacement of underground services. All pavements are built to current design and construction standards. Figure General Road Deterioration Curve with Strategies and Intervention Point Triggers PQI Resurfacing Minor Rehabilitation Major Rehabilitation Time The pavement inventory is classified into 8 different types which have their own life cycle management model. The rehabilitation treatments are triggered by the condition and age of the pavement section. Thresholds for the various pavement types are set to optimize the funding investment with the goal of the longest pavement life at the lowest cost of Roadways 13
29 A well executed maintenance program is critical to providing safe, high performing, and cost effective Infrastructure ownership. The decision support system calculates the 60 year investment profile for each of the 1900 pavement sections. The predicted pavement rehabilitation need is summed up by year so the entire inventory need can be quantified, examined, and analyzed. A well executed maintenance program is critical to providing safe, high performing, and cost effective infrastructure. The Roads and Parks Maintenance (RPM) department deliver planned and reactive maintenance activities on all City operated pavements. They also provide winter control on City pavement and pavement owned by Halton region within the City of Burlington. The Minimum Maintenance Standards for Municipal Highways (MMS) is a provincially mandated inspection program that requires municipalities to review its pavement inventory on a frequency that is determined by traffic volumes and posted speed limits. The MMS inspection looks for shoulder drop offs, cracks, and pavement surface discontinuities that would compromise the travel ability of the pavement. Once a defect has been recorded, the MMS prescribes the maximum time for repair based on the traffic volume and posted speed limit. RPM also delivers planned maintenance programs such as crack sealing, minor asphalt repair, rural road surface treatment, street sweeping, shoulder maintenance, and curb repairs. If there is a sudden failure of the pavement (such as a sinkhole) RPM repairs the failure in a timely manner Risk Analysis Risk is the probability of an event happening multiplied by the consequence of that event. Pavement assets are assessed for risk when prioritized as part of the capital budget. As pavements age, the rehabilitation treatments become more expensive. Pavement sections that are at risk of cost escalation have a high weighting; addressing these sections at the optimized time will defer the more expensive rehabilitation and extend the asset life. The primary considerations for determining probability of asset failure are physical condition and adherence to regulatory standards. The safety risk to the public is the main consequence of asset failure. Coordination with Other Asset Renewal The rehabilitation of pavement assets presents an ideal opportunity to renew other assets in the ROW. Renewal of underground utilities such as Water and Waste Water pipes are coordinated with Halton Region. Storm Sewer assets owned by the city are included if the rehabilitation is warranted. Additional roadway needs are incorporated into pavement rehabilitation projects in order to maximize available resources, realize economies of scale, and minimize service impacts to the community. 14 The City of Burlington 2016 Asset Management Plan

30 Approach to Options Analysis The road renewal program focuses on a cost effective, long-term strategic approach to renew and rebuild the city s pavement assets. The majority of this renewal focuses on a replacing assets with similar function and equivalent utility, unless influenced by other factors of levels of service. Examples of options considered when planning road projects, include: Functional changes to the roadway necessitated by capacity or utilization demands; Upgrade to current pavement design standards (ex. building up the base or wearing surface thickness); Road cross-section upgrade (ex. transforming a rural cross-section to an urban crosssection with curbs); and Applying alternative construction techniques or materials (ex. utilizing a higher percentage of recycled aggregate) Future Demand The City s strategic plan is changing the way we grow. This initiative is designed to rework the roadway to increase the modal split allowing for more public transit and active transportation. Shifting traffic loading from the pavement will slow the rate of deterioration and increase the useful life of the pavement. In the short term, any increase in traffic volumes and heavy loading will accelerate the deterioration of pavement and shorten the time between rehabilitation treatments and negatively impact the useful life of the asset. As the requirements of new pavement cross sections are defined, the AMP must be utilized as a guide for implementation so that asset renewals can be coordinated with the growth needs of the City. Roadways 15
31 State of Local Infrastructure Bridges & Large Culverts (Structures) Asset Data Inventory The asset data inventory for the structures asset category is divided into two types; bridges and large culverts. There are 47 bridges and 93 large culverts under municipal jurisdiction located throughout the City. The structure types are further classified into single span and multi span bridges or large culverts. There are 37 single span and 10 multi-span bridge structures and 62 single span and 31 multi-span culvert structures. Multi-span bridges account for 7% of the inventory, but are 36% of the total bridge and large culvert replacement value For the purposes of classifying bridges and culverts in the city s inventory, the Canadian Highway Bridge Design Code (CHBDC) and the Ontario Structure Inspection Manual (OSIM) definitions are used. For the purposes of inspection, bridges and large culverts are defined as any structure with a span greater than 3 meter. Small culverts are less than 3 meters in span and are captured under the storm sewer asset section. Asset Valuation In establishing renewal and replacement costs for structures, the type of bridge or culvert needs to be considered. Replacement costs are established based on construction technique and structure components and have been calculated using a 3-year historic construction cost average. To account for bid fluctuations and differing project scopes, a standardized costing index was also utilized. The two costs are averaged and applied to all structures, which allows for the calculation of the overall replacement cost of the structure inventory. All associated cost related to the construction of a structure such as design, survey, construction, testing, contract administration, inspection and final acquisition of the newly constructed asset is include in the estimated unit cost. Replacement costs are calculated in current-year dollars and are reviewed biennially for accuracy. Estimated Current Asset Value Table 1.5 below provides financial summary of the replacement cost for bridges by span (single/multi-span) and large culverts. Estimated replacement cost is $332 million which is approximately 11.3% of the total asset base. Table 1.5 Asset Value Bridges & Large Culverts Asset Type - Bridges Quantity (each) Estimated Replacement Value Multi-Span Bridges 10 $121,845,511 Single-Span Bridges 37 $55,275,537 Subtotal 47 $177,121,048 Asset Type - Large Culverts Quantity (each) Large Culverts 93 $155,735,830 Subtotal 93 $155,735,830 Total 140 $332,856,878 Estimated Replacement Value 16 The City of Burlington 2016 Asset Management Plan

32 Asset Useful Life The useful life for bridges and large culverts is based on a review of historical replacement activities for similar assets over the years. This review is supported by benchmarking with peer municipalities, provincial authorities, vendors and manufacturers. Table 1.6 Asset Useful Life Asset Type Bridges 75 Large Culverts 75 Useful Life (Yrs.) Asset Condition Assessments In accordance with Ontario Regulation 104/97, condition information for bridges and large culverts is collected and verified through biennial inspections completed using the methodology outlined in OSIM. Structures are made up of various components that deteriorate at different rates. The OSIM inspections visually evaluate each component of the structure, and classify it by condition. These individual component condition scores are compiled into a Bridge Condition Index (BCI), which is an overall measure of the condition or health of the structure. A BCI of 100 would represent a newly constructed structure, while a BCI of 20 would represent a structure that requires significant rehabilitation or replacement. In addition to the visual inspection, completed OSIM s identify needs for further detailed condition inspection of the structure that will provide more information on the rehabilitation requirements. Current Asset Condition In order to standardize the condition scoring across different asset categories, the BCI is normalized into a five-point grading system (Table 1.7). Table 1.7 Asset Condition Grade System - Bridges & Large Culverts Grade Very Good >80 Good 60 to 79.9 Fair 40 to 59.9 Poor 20 to 39.9 Very Poor < 20 Condition Range (BCI) Tables 1.8 and 1.9 below provides the distribution of structures by condition grade and the average BCI. This information is based on the most recent (2016) OSIM inspections. Table Average BCI - Bridges Condition Grade Quantity (each) Average BCI Very Good 3 95 Good Fair 5 52 Poor 2 31 Very Poor 0 N /A Based on the current condition assessment, the overall bridge inventory is in Good condition. There are no individual bridges in Very Poor condition. It has been calculated Roadways 17
33 that scheduled capital works to bridges will increase the overall inventory average condition to Good. Table Average BCI - Large Culverts Condition Grade Quantity (each) Average BCI Very Good 5 92 Good Fair Poor 2 32 Very Poor 0 N/A Based on the current condition assessment, the overall large culvert inventory is in Good condition. There are no individual culverts in Very Poor condition. An overall condition grade for the structure inventory is Good Long-Term Needs Summary The 60 year average capital need for Bridge & Culvert assets is $8.2M. This estimated amount of capital is what the City requires to reinvest in its existing Bridge & Culvert asset inventory on an annual basis to sustain the current level of service. Assumptions The following assumptions were used in the development of the Bridges & Large Culverts information included in the AMP: Inventory represents structures owned by the city, there are several structure throughout the city that are owned by other agencies (i.e. Halton Region, Ministry of Transportation, CN Rail, CP rail) which are not part of this AMP Foot Bridges are included in the condition inspections and are part of the Parks and Land Improvements section of this plan Replacement cost calculated is to construct a structure with a similar function and equivalent utility Deterioration rates of structures is assigned by type Useful life applied is an average 18 The City of Burlington 2016 Asset Management Plan
. Achieving this target will result in a decreased risk to public safety, continued service and protection of the City s investment in its structures.")
34 Levels of Service Bridges and Large Culverts Strategic The City s Strategic Plan recommends maintaining infrastructure in good condition, which means maintain a minimum overall BCI of 70, with no single structures having a BCI below 20 (Poor). Achieving this target will result in a decreased risk to public safety, continued service and protection of the City s investment in its structures. The cost to replace or rehabilitate structures, risk to public safety, and economic benefit of structures is considerable. As such, the city makes structure work a priority in relation to other needs. Mandated Because of the critical nature of structures the city must meet legislated requirements in order to ensure the structures are safe. The following standards and regulations must be adhered to: Provincial government mandates, through Ontario Regulation 239/02 - Minimum Maintenance Standards for Municipal Highways, that bridges are inspected for deck spalling on regular intervals based on road class; Biennial inspections, completed in accordance with Ontario Regulation 104/97 using methodology outlined in the Ontario Structure Inspection Manual (OSIM). The City prioritizes any safety-related deficiencies identified during the OSIM inspection for immediate repair/renewal. Bridge and large culvert design work must be done in accordance with CSA S6-14 Standard Canadian Highway Bridge Code and Ontario Regulation 104/97: Standards for Bridges Community Expectations The community expects safe, functional and well maintained bridge and culvert structures. Given appropriate funding, an optimized rehabilitation schedule will provide the longest service life at the lowest cost of ownership. Affordability Regular inspections allow staff to properly plan for the eventual work and allocate funds in advance. When applicable, the project requirements are included in a road work project in order to realize the economies of scale. This approach allows for additional rehabilitation and reconstruction activities with the realized savings while maintaining the inventory in good condition. Roadways 19
35 Asset Management Strategy Bridges and Large Culverts Maintain or Improve Level of Service The overall average condition for bridges and large culverts is Good. In order to maintain this performance, sufficient funding is necessary. Further analysis may indicate that funding needs to be increased in order to meet the requirements of this critical infrastructure within the optimal time frame. Regularly scheduled inspections are vital for sustaining bridges and large culverts Lifecycle Management Regularly scheduled inspections are vital for sustaining bridges and large culverts. Inspection results and recommendations assist in determining current asset condition and are important for budget planning and optimal life-cycle analysis. Structure inspections are routine (biennial visual inspections) or can be unique in nature (emergency / special circumstance). Detailed Condition Inspections are more in-depth examinations of the entire structure or specific structure components. These inspections will go beyond the required visual inspection and samples of the structure may be taken for further analysis. The intent is to assess the safety and serviceability of the structure and determine the full scope of work required to be funded. Bridge and Large Culvert treatments are broken down into four main ideal maintenance/ rehabilitation activities to prolong the useful life of the asset: Capital Bridge Repairs (Age: Yrs.) Minor Rehabilitation (Age: Yrs.) Capital Bridge Repairs (Age: Yrs.) Major Rehabilitation\Replacement (Age: Yrs.) Well-executed maintenance is critical to providing safe, high performing and low risk infrastructure. Throughout the asset s life cycle, and within each rehabilitation age range or window, a series of maintenance activities must occur in order for the structure to sustain its function. When a structure is designed, it is assumed that a certain level of maintenance is required in order for the structure to meet its intended useful life. Rigorous inspections must be carried out and routine maintenance work should not be ignored or deferred. The following maintenance activities are typically associated with bridges and large culvert structures: Annual washing to remove debris from city winter operations (sand and salt); Crack sealing of the wearing surface; Regular re-coatings of railing systems; Preventative maintenance and cleaning of wearing items (bearings, expansion joints, etc); Regular clearance of debris around and within the structures. Monitoring for minimum maintenance standards (Safety system, signs, etc.) 20 The City of Burlington 2016 Asset Management Plan
 and fatigue. The consequence of failure is the effect, or impact, of the structure failing to provide its intended service or function.")
36 Risk Analysis The probability of structure failure for bridges and large culverts is attributed to overall deterioration due to aging, increased loading, cracking, corrosion, environmental effects (freeze-thaw) and fatigue. The consequence of failure is the effect, or impact, of the structure failing to provide its intended service or function. Factors considered when examining structure risk, include: Safety; Overall structure condition and age; Natural Hazards (wind, snow/ice, flooding, earthquakes, material degradation); Traffic growth (number of vehicles and gross weight of trucks); and Damage from impact Structures are also assessed for risk when prioritized as part of the Capital Budget & Forecast. They represent a considerable share of municipal investment and, as part of an integrated transportation network, are important to the local and regional economy. Coordination with Other Asset Renewal Structure renewal and replacement work is prioritized and cross-referenced against planned roadway projects as part of the Capital Budget and Forecast. Planned work may require coordination with other key agencies and stakeholders, such as Department of Fisheries and Oceans (DFO), Ministry of Natural Resources (MNR), Conservation Halton, Metrolinx, Canadian Pacific Railway (CPR) and Canadian Nation Railway (CNR). Approach to Options Analysis When planning rehabilitation, design considerations focus on incorporating new materials and new construction technologies to ensure component and structure reliability. Based on function, utilization, total cost and useful life, different structure types may be considered for new construction or replacement projects. For example, bridge structures may be replaced with small culverts to reduce maintenance and future capital costs for that crossing. In some cases, rapid bridge replacement techniques are utilized to allow for quick replacement of the structures, with minimal disruption to local residents and roadway users. Future Demand Bridges and Large Culvert structures will play a key role in the future transportation network for the city as they are integral in connecting people and facilitating the movement of goods and provision of services. As the city focuses on intensification, there will be changes to roadway traffic and utilization, which will create the need for additional pedestrian crossings specifically to provide a northsouth connection across the QEW. Enhancements to structures that increase their resiliency to climate change will be incorporated in new designs along with more provisions for active transportation. Climate change is negatively impacting the deterioration rates of bridge and large culverts. However, the use of more durable materials and improved construction processes will mitigate the impact. New trends in the areas of design and construction allow for faster replacements and more resilient structures with less disruption to the public. Roadways 21
37 The City manages 759 km of storm sewer pipe and over 26,000 related point assets State of Local Infrastructure Storm Sewer Network The drainage system is divided into 2 systems: the major drainage system and the minor drainage system. The major drainage system comprises the natural streams and valleys and man-made streets, swales, channels and ponds. It is designed to accommodate runoff from less frequent storms (e.g., 100 year or the Regional storms). The main purpose is to mitigate the risk of flooding. The major system is documented in the Storm Water Management section of the AMP. The Storm Sewer Network represents the minor drainage system which comprises swales, street gutters, catch basins and storm sewers pipes. It is designed to convey runoff from frequent storms (e.g., up to 2 or 5 year storms). The main purpose of this system is to minimize storm water ponding at intersections and pedestrian crossings by conveying rain water runoff to the creeks and receiving waters (i.e. Lake Ontario). Asset Data Inventory A good asset data inventory is essential for proper planning, especially with buried assets. The City manages 759 km of storm sewer pipe and over 26,000 related point assets, such as catch basins, maintenance holes and water quality control devices (WQCD) which can be located in the ROW or on city-owned properties such as parks. Halton Region is responsible for water and waste water assets within the ROW. The storm sewer inventory is derived from historical construction record drawings. The location and data on length, size, material and construction year is digitized in the inventory system (GIS). Condition data is managed in the CCTV inspection management system. The inspection system contains the inspection report data along with the CCTV video and is linked to the GIS inventory. The integration of the inventory system and inspection management system allows for the efficient management and sharing of storm sewer data. Rehabilitation strategies and costs are maintained in the decision support (DS) system, which applies the strategies and calculates the optimum rehabilitation schedule and costs for each storm sewer asset for the next 60 years. Asset Valuation To properly valuate the storm sewer network, historic construction costs were used to determine the average amount for excavation. A cost analysis was conducted where the material and size of the pipe were analyzed and unit costs were developed for pipes larger and smaller than 450mm. Pipes larger than 450mm are typically reinforced and thus cost more to procure. The material also influences the replacement cost of a pipe section, with concrete and polyvinyl chloride (PVC) pipes being the most common in the City. The unit cost of the pipe is combined with the average excavation and estimated soft cost to produce a unit replacement cost that is applied to all pipe sections in the network. Maintenance holes, catch basin structures and WQCD s are valued based on a three year historic construction cost and applied to each asset in the network. 22 The City of Burlington 2016 Asset Management Plan

38 Figure Storm Point Replacement Cost Maintenance Hole WQCD Catchbasin Estimated Current Asset Value Table 1.10 below provides quantities and replacement value for storm sewers and related point assets. The total replacement value is estimated at $192 Million, which is 6.5% of the total asset base.. Table Asset Value Storm Sewer and Related Structures Storm Sewer Pipes Asset Type Quantity (km) Catch Basin Lead 73 $11,170,914 Mainline 567 $62,366,986 Rear Yard Lead 91 $15,518,895 Small Culverts 29 $6,189,630 Estimated Replacement Value Subtotals 760 $95,246,425 Storm Sewer Structures Asset Type Quantity (each) Catch Basins $46,447,900 Maintenance Holes 9101 $50,165,800 WQCD 12 $240,000 Estimated Replacement Value Subtotals 26,803 $96,853,700 Grand Total $192,100,125 Roadways 23
39 Asset Useful Life The useful life for a storm sewer pipe is based on the material of the asset. For example, the useful life of concrete is approximately 75 years, while corrugated steel pipe is approximately 35 years. Storm sewer point assets are constructed of concrete and have a useful life of 75 years. Estimates on useful life are based on historical performance and manufacturer specification. Figure Storm Point Age Distribution 1400 A pipescore of 1 would represent a brand new pipe; a pipescore of 5 would represent a pipe that requires rehabilitation # of assets Asset Condition Assessments Age Storm sewer pipe inspections are completed using a CCTV camera system based on the CSA Pipeline Assessment and Certification Program (PACP) standards. Approximately 60% of the storm sewer inventory has been fully inspected to date. Inspection data is used to assess condition and confirm pipe length, material condition and is updated in the CCTV inspection management system. Maintenance, operational or safety needs identified in the inspection are addressed by RPM. Structural needs are aligned with road surface work as part of capital budget planning process. Pipes are inspected using a robotic crawler and camera system. The crawler is remotely piloted along the length of the pipe and a certified operator identifies and classifies maintenance, operational and structural defects. Based on PACP, the defects are rolled into a pipescore value, which represents the condition of the entire length of a storm sewer section. A pipescore of 1 would represent a brand new pipe; a pipescore of 5 would represent a pipe that requires rehabilitation. The condition of the storm sewer points is not collected by the city but the condition of the point asset is commented on as part of the mainline inspection. Any urgent issues relating to point assets are identified and scheduled for repair. Total 24 The City of Burlington 2016 Asset Management Plan
40 Current Asset Condition Table 1.11 categorizes the storm sewer infrastructure into a 5-point condition grading system based on the remaining useful life of the assets. Table 1.11 Asset Condition Grade System - Storm Sewers Grade Very Good Good Fair Poor Very Poor Remaining Useful Life +50 Years 21 to 50 Years 11 to 20 Years 1 to 10 Years Beyond Useful Life Table 1.12 below provides the average condition grade by type for the storm sewers. Table Average Condition Grade by Storm Sewer Asset Type Storm Sewer Asset Type Catchbasin Leads Mainline Pipes Rear Yard Leads Small Culverts Catchbasin Structures Catchbasin-Maintenance Holes Maintenance Hole Structures Rear Yard Catchbasins Water Quality Control Devices Overall Average Condition Grade Good Good Good Fair Good Good Good Good Very Good Good Table 1.13 and Table 1.14 below provide the condition grades, based on remaining useful life, for the storm sewer and storm sewer point assets. Table Condition Grade Distribution by Storm Sewer Asset Type Condition Grade CBLEAD MAINLINE RYLEAD Total Percentage Very Good % Good % Fair % Poor % Very Poor % Totals % Roadways 25
41 Approximately 90% of the storm sewers have a remaining useful life greater than 20 years, which denotes a network in relatively Good condition. However, 3% of the network (24 km of pipe) is at or beyond the expected useful life ( Very Poor ). Table Condition Grade Distribution by Storm Sewer Structure Type Condition Grade CB MHS WQCD Total Percent Very Good 5,752 2, , % Good 11,334 5, , % Fair , % Poor % Very Poor % Totals 18,210 8, , % Approximately 94% of the storm sewers have a remaining useful life greater than 20 years, which denotes a network in relatively Good condition. However, less than 1% of the network (158 structures) is at or beyond the expected useful life ( Very Poor ). Long-Term Needs Summary The 60 year average capital need for Storm Sewer assets is $2.9M. This estimated amount of capital is what the City requires to reinvest in its existing Storm Sewer asset inventory on an annual basis to sustain the current level of service. Assumptions The following assumptions are used in the development of the storm sewer pipes and related assets information included in the AMP: For all catch basin structures, it is assumed that there is a 3 m lead connecting to the mainline (the cost of which has been added to the unit replacement cost); Levels of Service Storm Sewer Network Strategic The inspection of buried assets is crucial to maintain a functional storm sewer network. In order to understand the current state of the network and predict future requirements, the city aims to inspect every pipe in the network on a 15-year cycle. This enhanced frequency allows the city to monitor the condition and understand how the pipe is deteriorating over time. An overall pipescore of 2 is set for the Storm Sewer Network, which would be within the good condition grade. An additional goal is to renew pipes that have an inspected condition of 4 (Poor) or 5 (Very Poor). These rehabilitations will occur as part of a capital project or immediately if the defect is severe. Mandated There is currently no legislative requirement to inspect storm sewers. However, due to the inherent risk of buried infrastructure, the City has taken a proactive approach by dedicating funding to an inspection program. 26 The City of Burlington 2016 Asset Management Plan

42 Community Expectations Mitigating risk, ensuring proper function, and effective management of the investment are expectations of the community. The storm sewer network exists to minimize storm water ponding at intersections and pedestrian crossings which can be hazardous to pedestrians and motorists alike. Proper maintenance of the network ensures the system functions as designed and mitigates the risk of flooding. The application of asset management principals allows the city to plan rehabilitations for the next 60 years and ensure that the funding is available to replace assets at the optimal timing and cost. Affordability Based on condition information, the storm sewer network is currently in Good condition; however 60-year projections indicate increased rehabilitation requirements due to aging infrastructure. Roadways 27
43 Asset Management Strategy Storm Sewer Network Maintain or Improve Level of Service The overall average pipescore condition is Good. In order to maintain this performance, sufficient funding must be in place when the rehabilitation and replacement is required. Further analysis of condition data may indicate changes to funding. The City will incorporate new technologies that allow for the rehabilitation of storm sewer lines without excavation of the pavement Lifecycle Management The storm sewer network uses a run to end of useful life strategy, which means the asset is operated to the end of its useful life and then replaced. With advancements in rehabilitation techniques, the City will incorporate new technologies that allow for the rehabilitation of storm sewer lines without excavation of the pavement surface. This trenchless technology will be incorporated into the life cycle model for storm sewer lines and will extend the life of the pipe, minimize disruption to the public and mitigate risk. All rehabilitation or replacement activities are typically coordinated with pavement rehabilitation projects unless the defect is critical and/or threatens public safety. Maintenance Activities RPM administers both scheduled and reactive maintenance activities related to the function of the storm sewer network. A program of catch basin cleaning is executed every year along with the regular cleanout of water quality control devices on a 4 year cycle. In response to minor flooding events, RPM directs the spot repair of a pipe section or the flushing of a drainage area to restore the proper function of the network. Risk Analysis Buried assets carry a notable amount of risk. An example of a high risk event would be a mainline pipe collapse under a roadway. This form of sinkhole would compromise the pavement structure, impact service and pose a significant hazard to the public. To mitigate the risk of catastrophic pipe failure, the CCTV inspection program priorities are based on pipe size, age and location. Priority is given to pipes with a larger diameter, under the road and in the last 1/3 of their life. 28 The City of Burlington 2016 Asset Management Plan
 replacements.")
44 Coordination with Other Asset Renewal Storm sewer replacements typically occur with pavement renewals, specifically during reconstruction activities. Storm sewer replacements are also coordinated with Regional service (water and waste water) replacements. Approach to Options Analysis Rehabilitation of pipes using traditional open cut trenching is expensive and disruptive. New trenchless technologies allow for the same rehabilitation of the pipe without the cost or disruption of excavation. This approach will be evaluated and implemented when applicable. Future Demand Climate change will increase the demands on the storm sewer network; however design innovations and new ways of thinking about storm water will help to mitigate the effects of these events. Enhancements to the system to become more resilient to climate change may require additional funding needs. To combat the impacts of climate change, new and emerging technologies are being reviewed on a regular basis. Low impact development infrastructure can be utilized to retain water, delay the water entering the storm sewer system, and promote infiltration back into the natural watercourse. Roadways 29
45 State of Local Infrastructure Pedestrian Network Asset Data Inventory The asset data inventory related to pedestrian network assets is managed in GIS and updated annually. Asset attributes such as length, width, material and construction year is based on historic record drawings and verified using aerial imagery and site visits. Information related to the rehabilitation schedules and replacement costs is managed in the decision support system. The City owns and maintains over 480km of concrete sidewalk Asset Valuation Replacement costs are calculated with a per linear meter unit cost which is based on a three-year historic construction average cost. All surfaces are reconstructed up to current design and construction standards. Unit pricing includes all project-related costs such as design, surveying, construction, testing, contract administration and inspection. The replacement cost is in current-year dollars and reviewed biennially for accuracy. Estimated Current Asset Value The estimated replacement value of the pedestrian network is $87 million dollars, which is 3.1% of the total asset base. Table 1.15 below summarizes the pedestrian network in terms of type, quantity and replacement cost. Table Asset Value Pedestrian Network Type Quantity Sidewalks - concrete 480 km $79,221,855 Multi-Use Pathways - asphalt 32km $8,008,277 Multi-Use Pathways - gravel 0.5 km $66,885 Estimated Replacement Value Total $87,297,017 Asset Useful life The useful life of a sidewalk or multi-use pathway is based on the longevity of its material. Concrete assets have a higher initial capital cost but will provide consistent service for approximately 60 years. Asphalt has a lower initial capital cost but typically requires replacement after 30 years. Gravel surfaces have the same useful life as asphalt and make up less than 1% of the overall inventory. Asset Condition Assessments The pedestrian network has mandated requirement for maintenance inspections. As part of the Minimum Maintenance Standards for Municipal Highways (MMS), cities are required to inspect sidewalks for trip ledges and repair any identified hazards in a timely manner. RPM conduct annual sidewalk inspection for more immediate repair and renewal. In order to improve the assessment methodology, future inspections should look at additional defect types in addition to maintenance defects. For capital planning related to pavement rehabilitation or reconstruction, a Pavement Management Application can be utilized for storing condition information and generating a Sidewalk Quality Index similar to a PQI. 30 The City of Burlington 2016 Asset Management Plan

46 Current Asset Condition Table 1.16 categorizes the pedestrian network into a 5-point condition grading system based on the remaining useful life of the assets. Table 1.16 Asset Condition Grade System - Pedestrian Network Grade Very Good Good Fair Poor Very Poor Remaining Useful Life 20+ Years 16 to 20 Years 11 to 15 Years 6 to 10 Years 1 to 5 Years An aged based condition breakdown is presented in Table 1.17 below. Assets with more than 20 years of remaining useful life would be considered Very Good while less than 5 years would be considered Very Poor Table Remaining Useful Life by Pedestrian Network Surface Type Condition Grade Pathways Asphalt Sidewalks Concrete Pathways Gravel Totals Percentage Very Good , , % Good 4, , , % Fair 8, , , % Poor 2, , , % Very Poor 16,744 53, , % Approximately 73% of the pedestrian network falls within the Poor to Good range, which translates to an average condition of Fair. Nearly 14% of the network has less than five years of useful life remaining, or has exceeded the estimated useful life. It should be noted that asphalt pathways, with an estimated useful life of only 35 years, make up a higher proportion of assets classified as Very Poor. Long-Term Needs Summary The 60 year average capital need for Pedestrian Network assets is $1.6M. This estimated amount of capital is what City requires to reinvest in its existing Pedestrian Network asset inventory on an annual basis to sustain the current level of service. Assumptions The following assumptions apply to the current asset management processes for the pedestrian network: Assets are properly managed to the end of useful life; Assets approaching the end of life will be renewed as part of road pavement projects to ensure a coordinated approach, and to capitalize on economies of scale; and Assets are constructed to current design and construction standards Roadways 31
47 Levels of Service - Pedestrian Network Strategic The current strategic plan is promoting active transportation and a healthy lifestyle in the community. There is an intentional shift towards providing a comprehensive and reliable pedestrian infrastructure as it offers a low-cost and enjoyable option that could replace short auto trips and reduce congestion and the carbon footprint. This, combined with the City s commitment to keeping existing infrastructure in a good condition, has a significant impact on sidewalks and multi-use pathway assets since they are the foundation of an active transportation model. Mandated As referenced in the Asset Condition Assessments Section, to comply with AODA and MMS, there is a program for addressing tripping hazards and sidewalk ramping associated with the pedestrian network. Community Expectations Walking promotes a healthy lifestyle and is an effective mode of transportation. In an effort in increase the modal split, the City s upcoming Integrated Mobility Plan/Transportation Plan will explore options to improve existing sidewalks and multi-use pathways as part of roadway renewal projects as well as opportunities to expand the pedestrian network. Affordability Based on condition information, the pedestrian network is currently in Good condition; however 60-year projections indicate increased rehabilitation requirements due to aging infrastructure. 32 The City of Burlington 2016 Asset Management Plan

48 Asset Management Strategy- Pedestrian Network Maintain or Improve Level of Service Current pedestrian network levels of service are based on maximizing the longevity of an asset while at the same time providing safe and reliable public infrastructure within the roadway. As Burlington continues to grow and shift towards a more active transportation model, design standards related to sidewalks and multi-use pathways will also evolve. Documents such as the Integrated Mobility Plan/Transportation Plan, the Urban Forestry Management Plan, and the Downtown Urban Design Guidelines will influence decisions about expanding the quantity and quality of the pedestrian network and priorities in financial spending. Life Cycle Management The pedestrian network uses a run to end of useful life replacement strategy, which means the asset is operated to the end of its useful life and then replaced. All rehabilitation or replacement activities are typically coordinated with roadway renewal projects unless the defect is critical and/or impacts public safety. RPM conducts annual reviews of all sidewalks to record, classify, and map defects related to sidewalk condition. Defects are prioritized and a contractor is dispatched to repair the deficiencies. Risk Analysis Every sidewalk in the City requires inspection for trip ledges on an annual basis. Inspection, data collection, repair work and all winter control operations (sanding, salting, and plowing) are carried out by RPM. Coordination with Other Asset Renewals The replacement of a sidewalk or multi-use path is typically part of a larger pavement (roadway) improvement project. This achieves economies of scale and reduces disruption to the community. Pedestrian network assets that are impacted by utility work (e.g. overhead power lines or below grade gas lines) are identified and coordinated during the Municipal Consent Process. Any restoration required must meet current city standards. Approach to Options Analysis Changes or options to materials, widths and quantity will be realized as part of the upcoming Integrated Mobility Plan, as well as other planning documents such as the Urban Forestry Management Plan and the Downtown Urban Design Guidelines. Future Demand As the City focuses its attention on the goals set by the current strategic plan, additional demand for roadway infrastructure is expected to focus on the improvement of pedestrian network throughout the city. Other influences such as changes in climate, technology, population, and economy will have a significant influence over investments in the future. Roadways 33
49 State of Local Infrastructure - Walls (Noise and Retaining) Asset Data Inventory The asset data inventories for wall structures includes 29 noise walls and 223 retaining walls and are maintained in GIS. Condition data is synchronized with a decision support system for life cycle modeling. Asset Valuation The useful life of a noise or retaining wall is based on the longevity of its material Replacement costs are calculated with per a linear meter unit cost which is based on a 3-year historic construction cost average. All walls are reconstructed up to current design and construction standards. Unit pricing includes all project-related costs such as design, surveying, construction, testing, contract administration and inspection. The replacement cost is in current-year dollars and reviewed biennially for accuracy. Estimated Current Asset Value Table 1.18 below provides details on the asset value for the City s wall assets. The estimated replacement cost is $8 million. Table Asset Value Noise Walls & Retaining Walls Noise Walls Quantity (km) Replacement Cost Concrete w/ Concrete Posts 2.81 $2,666,608 Concrete w/ Steel Posts 1.52 $1,438,978 Wood 0.16 $149,231 Subtotal 4.5 $4,254,817 Retaining Walls Quantity (km) Replacement Cost Armour Stone 0.92 $2,161,372 Brick 0.03 $18,715 Concrete 0.13 $480,739 Gravity Interlock 2.62 $883,950 Stone Mortar 0.64 $176,011 Wood 0.47 $105,687 Subtotal 4.8 $3,826,473 Total 9.3 $8,081,290 Asset Useful Life The useful life of a noise or retaining wall is based on the longevity of its material. Concrete or stone walls tend to have a higher initial capital cost but will provide consistent service for approximately 40 years. Wood has a lower initial capital cost but it requires replacement after approximately 20 years of service. Asset Condition Assessments All walls are assessed every three years. As per the OSIM methodology (similar to bridges and large culverts), retaining walls that are greater than 3m in height and are below a condition of good must be inspected every two years. Condition data and the age of the walls are used to assign an overall grade. 34 The City of Burlington 2016 Asset Management Plan
50 Current Asset Condition Table 1.19 provides a breakdown of the noise walls by asset condition grade. Table Noise Wall Condition Condition Concrete w/ Concrete Posts Concrete w/ Steel Posts Wood Total Percentage Very Good % Good % Fair % Poor % Very Poor % Total % The majority of noise walls are deteriorating much faster than predicted. The effects of freeze-thaw on the concrete walls and poor drainage have significantly impacted the overall condition of the noise wall inventory. Upcoming capital works are scheduled for many of the walls in the poor category which will increase the overall inventory performance. Further investigation and determination of scope is required to properly define the funding required to bring this category up to the good condition state. Table 1.20 provides a breakdown of the retaining walls by asset condition grade. Table Retaining Wall Condition Condition Armour Stone Brick Concrete Gravity Interlock Stone Mortar Wood Total Percentage Very Good % Good % Fair % Poor % Very Poor % Total % The overall condition of the City-owned retaining walls is Good, with over 83% in Good or Very Good condition. Long-Term Needs Summary The 60 year average capital need for wall assets is $13.2K. This estimated amount of capital is what the City requires to reinvest in its existing Wall asset inventory on an annual basis in order to sustain the current level of service. Assumptions Assets are properly managed to the end of useful life; Assets approaching the end of life will be coordinated with road pavement projects to achieve economies of scale. Assets are constructed to current design and construction standards Roadways 35
51 Asset Management Strategy Walls (Noise and Retaining) Maintain or Improve Level of Service Levels of service for walls are based on maximizing the longevity of the assets while providing safe and reliable public infrastructure in the ROW. Mitigating the risk of a wall failure, premature deterioration, and cost escalation is the primary concern of the inspection and rehabilitation program Life Cycle Management A run to end of useful life replacement strategy replacement strategy is used for wall assets, which means they are operated to the end of useful life and then replaced. With advancements in rehabilitation techniques, new technologies can be incorporated into the construction process to allow for the rehabilitation of walls that last longer, perform better and reduce the overall cost throughout its lifecycle. All rehabilitation or replacement activities are typically coordinated with pavement roadway projects unless the defect is critical and/or impacts public safety. Risk Analysis The probability of wall failure is attributed to overall deterioration due to aging, cracking, corrosion and environmental effects (freeze-thaw). The consequence of failure is the effect, or impact, of the wall failing to provide its intended service or function. Factors considered when examining wall risk, include: Safety; Overall structure condition and age; Natural hazards (wind, snow/ice, flooding, material degradation); Wall purpose (is it retaining soil or a sound barrier) Mitigating the risk of a wall failure, premature deterioration, and cost escalation is the primary concern of the inspection and rehabilitation program. Coordination with Other Asset Renewal The replacement of a noise or retaining wall is typically part of a larger pavement (ROW) improvement project. This yields financial savings by bundling projects together and reduces disruption to the community. Wall assets that are impacted by utility work (e.g. overhead power lines or below grade gas lines) are identified and coordinated during the Municipal Consent Process. Any restoration required must meet current city standards. Approach to Options Analysis Once an asset is identified for rehabilitation and funding is assigned, options can be considered. Replacing the asset with one that provides the same level of service is the standard practice. However, innovative approaches to design (both in terms of structure and appearance) are regularly considered in the planning stage. With more variety of attractive and greener building materials on the market, noise and sound walls have an opportunity to complement street design and minimize environmental impact while still performing its intended function. Future Demand Intensification may potentially increase noise and the need to construct new noise walls. 36 The City of Burlington 2016 Asset Management Plan

52 State of Local Infrastructure Parking, Traffic Control & Safety Asset Data Inventory The asset data inventory for Parking, Traffic Control and Safety assets are managed in a number of registries; GIS, work order management system, excel and decision support system. There is a moderate level of data sharing between the various systems. The GIS system stores information related to asset detail about location and condition. The decision support system stores information regarding lifecycle, renewal/replacement strategies and asset costing. Asset inventories are maintained through regular updates to asset data inventories and decision support systems as assets are replaced or acquired. Table 1.21 below provides an overview of the Parking, Traffic Control and Safety asset inventory. Table 1.21 Parking, Traffic Control and Safety Assets Asset Type Unit Quantity Parking Lots & Equipment Ea. 156 Signs (Traffic & Highway Gateway) and Posts Ea. 36,988 Streetlights (Fixtures and Plant*) Ea. 26,427 Traffic Signals Ea. 120 Transit Shelters & Pads Ea. 231 Guiderails Km 22.5 *-Streetlight plant consists of the pole, arm, duct and cable Asset Valuation The replacement cost has been calculated using a 3-Year historic construction cost average derived from contracts where these types of assets were built or replaced. The costs are averaged and applied as unit costs. Generally, the unit costs incorporate both construction and soft costs. The replacement cost is reported in current year dollars. For parking lots, a third-party assessment was undertaken to confirm the City s estimated replacement costs for each of the assets. Roadways 37

53 Estimated Current Asset Value Table 1.22 below provides details on the parking, traffic control and traffic safety assets, including the estimated replacement value. The value of the assets is estimated to be $119.8 million, which represents 4% of the total asset base. Table 1.22 Parking, Traffic Control and Safety Assets Asset Type Unit Quantity Estimated Replacement Value Parking Lots & Equipment Ea. 156 $35,966,120 Signs (Traffic & Highway Gateway) and Posts Streetlights (Fixtures and Plant) Ea. 36,988 $1,320,255 Ea. 26,427 $60,999,959 Traffic Signals Ea. 120 $14,739,050 Transit Shelters & Pads Ea. 231 $3,976,829 Guiderails Km 22.5 $2,807,833 Total $119,810, The City of Burlington 2016 Asset Management Plan

54 Asset Useful Life The useful life for the parking, traffic control and traffic safety assets is based on a review of historical replacement activities for similar assets types. This review may be supported by benchmarking with peer municipalities, vendors, manufacturers and engagement of third party subject matter experts as required. Table Asset Useful Life Asset Type Parking Lots & Equipment 20 Signs (Traffic & Highway Gateway) and Posts 15 Streetlights (Fixtures and Plant) 60 Useful Life Traffic Signals (Including Communication Network) Transit Shelters & Pads 15 Guiderails 50 Asset Condition Assessments Table 1.24 below provides an overview of the five point grading scale applied for all parking, traffic control and safety assets. Table 1.24 Asset Condition Grade System - Parking, Traffic Control & Safety Grade Remaining Useful Life Very Good >80% Good 60% to 79.9% Fair 40% to 59.9% Poor 20% to 39.9% Very Poor < 20% Visual condition assessments of parking lots are completed on a five year cycle. A formal condition assessment program for the City s signs and guiderails has not been undertaken. However, a check for asset deficiencies is routinely done through the following: Regular patrol by internal staff; Legislative requirements (inspections); and Feedback from RPM patrol staff Condition information for streetlight assets (15,000 fixtures and 11,000 poles) is interpreted based on bulb outages, underground faults and general visual condition of poles and other components. Currently there is not a formal condition assessment process for traffic signals and associated communication network. An internal condition assessment of the shelters and benches associated with the bus stop locations was conducted. Formal assessment of other component (e.g. posts and pads) has not been completed. Overall, an age-based condition assessment is applied for the assets related to traffic control and safety Roadways 39
55 Current Asset Condition Table 1.25 provides the average condition grade for the Parking, Traffic Control and Safety asset types. The overall grade is weighted by the percentage of asset value, so it accurately reflects the overall system average. Table Average Condition Grade by Parking, Traffic Control and Safety Assets Asset Type Unit Quantity Condition Grade Parking Lots and Equipment Ea. 156 Fair Signs (Traffic & Highway Gateway) and Posts Ea. 36,988 Good Streetlights (Fixtures and Plant) Ea. 26,427 Good Traffic Signals (Including Communication Network) Ea. 120 Fair Guiderails Km 22.5 Good Transit Shelters & Pads Ea. 231 Fair Overall Average Good Long-Term Needs Summary The 60 year average capital need for Parking, Traffic Control and Safety assets is $2.7M. This estimated amount of capital is what City requires to reinvest in its existing Parking, Traffic Control and Safety asset inventory on an annual basis to sustain the current level of service. Assumptions The following assumptions were used in the development of the Parking, Traffic Control and Safety information included in the AMP: Asset replacements are assumed to be to a similar function and equivalent utility ( like for like ), unless legislation or regulations dictate change/upgrade etc.; Costing per asset type includes soft costs Prediction model does not consider growth Replacement costs are reviewed/updated every two years Downtown parking is assumed to be self sustaining and is excluded from the 60 year average capital need analysis 40 The City of Burlington 2016 Asset Management Plan

56 Levels of Service - Parking, Traffic Control & Safety Strategic The condition-based LOS target for parking, traffic control and safety assets are to maintain them in an overall good condition, based on the defined condition grading system. Any assets in a very poor condition state that that do not satisfy mandated requirements are prioritized to be renewed or replaced immediately. The City is utilizing an age-based asset management strategy for its streetlighting, traffic signals, signs and guide rail infrastructure. As such, assets will be replaced when they have reached their useful life. Traffic signs are checked on a yearly cycle to gauge reflectivity. Regular patrols are done to check for deficiencies. Signalized intersections are reviewed on a yearly cycle and MMU testing is completed twice a year. Specific strategic initiatives in this category include the regular re-lamping of streetlight fixture bulbs on a 5-year cycle and patrols to inspect streetlight condition (outages) every year. There is also a proposed LED retrofit program that will commence in As such, the replacement of the fixtures beyond those currently in Poor and Very Poor condition could be aligned with the LED program. Mandated The City maintains compliance with the following standards and requirements in managing its Parking, Traffic Control and Safety assets: Maintenance Standards for Municipal Highways - Ontario Regulation 239/02 City Engineering Standards Ontario traffic manuals The City plans to comply with anticipated changes in the above requirements or other applicable legislation, such as AODA. For example, the City is committed to upgrading all non-accessible shelters to a standard that meets the AODA requirements during the next replacement activity. Community Expectations The community expectations for parking vary based on location within the City. Factors relating to expectations include: convenience, access to amenities, availability and quantity. Future development will influence the demand and expectation for parking in the city. For traffic control and safety assets, the public expects assets to be safe, functional and meet all mandated level of service requirements. Any future community-based LOS must be measurable, and must be able to be translated into financial terms to allow for integration into the Financing Strategy. Affordability Based on current condition information, the parking, traffic control and safety assets range from fair to good condition; however the 60-year need demonstrates a marked increase in the need for rehabilitation. These needs (related to renewal of existing infrastructure) are identified in the City s Long Term Financial Plan and part of the recommended funding to replace assets at the optimal time in its lifecycle. Optimization of the investment in asset rehabilitation and replacement means doing the right thing at the right time to the right asset. Roadways 41
57 Asset Management Strategy - Parking, Traffic Control & Safety The primary considerations for determining probability of asset failure is physical condition and adherence to regulatory standards Maintain or Improve Level of Service The current average condition for parking, traffic control and safety assets is Good. In order to maintain this performance, continued investment infrastructure will be required. The LOS for the streetlighting and traffic signal infrastructure is to renew all equipment that prior to the end of its useful life. The influence of technology (ex. converting streetlight fixtures to LED) can lead to an improvement in LOS for these assets. The LOS for the transit shelters is to maintain the current average condition of Good. Furthermore, all shelters that have exceeded their ESL will be replaced and all nonaccessible shelters will be upgraded to meet the AODA requirements at the time of replacement. The City has determined that its desired LOS for the guide rails is that all guardrails are maintained in Good condition. Doing so will improve the LOS for this asset type as 41 guardrails are currently in Poor condition. Lifecycle Management For the parking lot assets activities generally align with the optimized asset management approach outlined in the pavement strategy of the AMP. Parking lot maintenance activities are undertaken by RPM or Facility Operations staff. This includes inspection, pot-hole repair, crack-sealing, trip hazards, localized ponding/ settlement and line painting. Rehabilitation and reconstruction at critical life cycle intervals is administered by the Capital Works Department. The following guidance documents are used in determining the maintenance standards for the traffic control and safety assets. Maintenance Standards for Municipal Highways - Ontario Regulation 239/02; and Ontario Traffic Manuals. Risk Analysis Parking, traffic control and safety assets are assessed for risk when prioritized as part of the capital budget. The primary considerations for determining probability of asset failure for Parking, Traffic Control and Safety assets is physical condition and adherence to regulatory standards. Risk to public safety is the main consequence of asset failure. 42 The City of Burlington 2016 Asset Management Plan
58 Coordination with Other Asset Renewal Renewal and replacement of traffic control and safety assets are typically completed in conjunction with other road works. Parking lots and associated equipment are undertaken as stand-alone projects, or may be renewed at the same time as roads, parks or facility capital projects. Traffic signal infrastructure at intersections with regional roads is coordinated between the City and Region of Halton. Approach to Options Analysis For most parking, traffic control and safety assets, options are guided by regulations and mandated requirements. For parking, consideration of alternate options, such as surface lots verses parking structures in the downtown area or permeable pavement, is given. Other options may include the leasing of lots or utilizing privately owned, but publicly accessible parking. Future Demand Burlington is creating an Integrated Mobility (Transportation) Plan which will guide the future demand needs for the roadway assets. This will define the 20-year shared vision and strategy to support the city growing in place, by providing multi-modal options that are convenient, affordable and safe. This plan promotes a shift to better enable public transit, walking and cycling with less dependency on vehicles. Existing and future roadway infrastructure will need to adapt and evolve to support this vision. Roadways 43

59 Photo or graphic page to break up text/sections 44 The City of Burlington 2016 Asset Management Plan
 organizations.")
60 Facilities and Buildings Under the Facility and Buildings (F&B) asset category, the City owns 109 facilities ranging from large community centres, arenas and fire halls to smaller park buildings with an estimated building footprint of 141,143 square meters. 92 facilities are operated and maintained by the City and 17 buildings are operated and maintained by Joint Venture (JV) organizations. Table 2.1 and below provide a breakdown of the City s facility inventory. Table 2.1 Facilities & Buildings - Inventory Group # of Assets Square Metres Administration and Operations Facilities 14 42, % Fire Department 9 7, % Parks & Recreation 59 68, % Local Boards - Library 4 8, % Local Boards - Museum 4 1, % Local Boards - Performing Arts Centre 1 5, % Local Boards - Art Gallery 1 4, % Joint Venture Organizations 17 11, % % of Total Square Metres Total , % State of Local Infrastructure Facilities & Buildings Asset Data Inventory The asset data inventory for F&B is managed in a facility management application. The original data was populated through the completion of third-party building condition assessment (BCA) in Subsequently, staff is responsible for maintaining and updating the building data upon completion of capital renewal projects. The facility management application stores data related to condition and cost of all assets and/or components that collectively make up a building or facility. Specific condition assessments (e.g., roofing) are completed on a five year cycle. This data is then integrated into the facility asset information system for capital renewal decision support. Asset Valuation Current system component replacement values for F&B are based on pre-set values in the facility management application. Individual building components or system-level assets (e.g. HVAC system) are added together to generate an overall building system cost. These costs are used to develop condition scoring or Facility Condition Index (FCI) analysis in the AMP. To more accurately forecast capital funding requirements of an entire building, soft costs, current legislative and regulatory requirements are also included as necessary to determine Facilities and Buildings 45
61 an overall replacement value for the building. This replacement value is used to develop long term funding needs. The estimated replacement value for 109 city buildings is $548 million. Estimated Current Asset Value Table 2.2 below summarizes the estimated replacement value for 109 city buildings. The value of assets is estimated at $548 million, which represents 18.6% of the total asset base. Table 2.2 Asset Value Facilities & Buildings Asset Type Quantity Estimated Replacement Value Facilities & Buildings 109 $547,696,300 Total $547,696,300 Asset Useful Life The City utilizes expected useful lives for the various building systems that are present within a building. The system s annual renewal values provide data that are used in the City s 60-Year renewal forecast. A further review of the forecasted data will provide triggers on when to replace the entire asset. The buildings observed during the BCA were broken down into building systems and were assigned a system value for their expected useful life. The values for useful life are based manufacturer guidelines, industry standards, observation of the assets and experience with similar materials and systems in other City buildings. Based on the asset s overall reported and/or observed physical condition, a decommission date is determined that represents the end point of the assets lifecycle. This also represents the end of the best-value range where further renewal spending would not provide further value to the building moving forward. The decommission date is then used to trigger a funding milestone for renewal of the entire facility. The useful life of building assets is an estimated number that is a function of quality of materials, manufacturing and installation, as well as frequency and intensity of service, and the degree of maintenance afforded to the asset. Asset Condition Assessments Condition assessments for F&B are carried out by qualified assessors who provide objective information needed to optimize long term facilities investments. Standard, comprehensive and specialized (i.e. energy) assessments are carried out for any new facility or major revitalization to an existing facility. Information is then verified and updated on a regular basis. Current Asset Condition FCI is the de facto industry standard for benchmarking building condition across a portfolio of buildings. FCI = Sum of Renewal Needs in a Given Period of Time Current Replacement Value (CRV) The renewal needs for each facility is based on the condition data stored in the facility management application database. The CRV values were developed by the City leveraging 46 The City of Burlington 2016 Asset Management Plan

62 information from the database and internal experience related to construction costs and project soft costs. A five-year FCI is used for benchmarking the inventory. Although there is no industry standard condition rating system based on five-year FCI, the City uses the following Condition grade system presented in Table 2.3 Table 2.3 Asset Condition Grade System - Facilities & Buildings Condition Grade Very Good 0.00 to 0.05 Good 0.06 to 0.10 Fair 0.11 to 0.15 Poor 0.16 to 0.20 Very Poor >0.20 Facility Condition Index (FCI) Table 2.4 provides a breakdown of the City s inventory based on the FCI Condition grade. Table 2.4 Number of Buildings by Condition Grade Condition Grade Buildings % by Square Metres Very Good % Good 13 9% Fair % Poor 15 20% Very Poor % Total % Based on the current asset data, the portfolio-wide FCI for F&B is 0.08, which is considered to be Good condition. However, as outlined above, there are few facilities within the Good condition range. There are currently 56 buildings in Poor to Very Poor condition compared to 25 buildings in Very Good condition. It is important to note the correlation between condition and function. Many of the City s major buildings are in the Very Good to Fair range. Facilities and Buildings 47
63 Figure Long Term Needs Summary $20 Long-Term Needs Summary Figure 2.1 below provides a 60-year average capital reinvestment need for F&B assets. This represents the estimated amount of capital the City requires to reinvest in its existing F&B asset inventory on an annual basis to sustain the current level of service. The average need is based on optimized capital life cycle cost where assets are managed at the lowest cost and risk through their useful life. The average need for all F&B assets is $8.9M Millions $15 $10 60 Year Average Renewal Need, $8.9M $5 $0 Unfunded Now Need Unfunded Renewal Need Annual Renewal Need Average Renewal Need (60yr) The unfunded renewal need in the above chart is estimated at $11.8M. This is defined as the unfunded value of infrastructure renewal needs that require immediate attention as of the current year. Assumptions The following assumptions were made in assembling F&B information for the AMP document Recommended replacement of building systems and equipment is based on replacing assets to a similar function and equivalent utility with no added built-in enhancements; Replacement values and capital needs includes applicable soft costs and current standards/codes; Capital average need is based on 1.7% reinvestment rate, as recommended in the 2016 Canadian Infrastructure Report Card (Informing the Future); Costing applied to systems is adjusted based on a standardized cost index (RSMeans); Prediction model does not consider growth/expansion; The City leases office space and is responsible for various items that are identified in the individual lease agreements. The fitting, furniture and equipment associated with the leased facilities has not been included; and Underground infrastructure (e.g. sanitary and water services) outside of the building envelope have been excluded from the analysis. Joint Ventures are excluded from the 60-year average need calculation 48 The City of Burlington 2016 Asset Management Plan


64 Levels of Service Strategic The current LOS target for F&B is that the inventory-wide FCI will be maintained at This is in keeping with the strategic plan goal of maintaining infrastructure in a good condition state. Mandated Building systems are influenced by legislative and regulatory requirements. Specific examples include: Ontario Building Code (OBC) AODA Burlington Accessibility Guidelines Canadian Safety Authority (CSA) Standards Fire & Life Safety issues are addressed immediately upon notification of the concern. Disturbing or removing designated substances must comply with Ontario regulations Community Expectations To-date, the City has yet to actively engage its residents in developing a comprehensive desired LOS for its facilities. However, as the AMP evolves, the City is planning to move beyond condition-based and internally developed LOS. Based on current information, facilities and buildings generally range from very good to fair condition; however the 60 year need demonstrates a marked increase in the need for rehabilitation. These renewal needs are identified in the most recent AM Funding Plan and part of the recommended funding to replace assets at the optimal time in its lifecycle. Facilities and Buildings 49
65 Asset Management Strategy Maintain or Improve Level of Service The determined LOS for F&B is to maintain its portfolio-wide FCI at or below 0.10, which is met by maintaining its current FCI of Achieving this LOS will maintain its portfolio-wide condition as Good. Lifecycle Management When renewing existing systems or equipment and constructing new facilities, Lifecycle Cost Analysis (LCA) is used to analyze different renewal options to determine which has the lowest total cost of ownership over the lifetime of the systems. Currently, the City has implemented a corporate preventative maintenance (PM) program for all City-maintained facilities, as outlined in the Corporate Standards for Facility Preventative Maintenance. The PM program includes preventative maintenance tasks that typically extend the service life of building systems and equipment, which in general will lower the overall lifecycle costs for a facility. It has been developed based on preventative maintenance standards for corporate service contracts, legislative/regulatory compliance and industry best practices. The PM program defines the following for each piece of equipment: Asset category (type of equipment); Task/Activity; Regulatory reference; Recommended frequency; and Responsibility (internal staff or external contractors). The recommended preventative maintenance tasks are based on manufacturer recommendations, industry standards and best practices, and the City s knowledge and experience with its facility portfolio. Facility types included in the PM program include P&R, Fire, Transit, Operations, Animal Shelter and Corporate/Administrative facilities. The maintenance of the Joint Venture properties are managed by Joint Venture partners and therefore not included in the City s PM program. Risk Analysis The City utilizes a Pair-Wise based prioritization program embedded within the Facility Management Application. The Pair-Wise system allocates the requirements into the following categories: Building Systems; Asset FCI; and Requirements Type. Figures 2.2 to 2.4 below provide the relevant pair-wise weighting for each category utilized in 2016 to determine the prioritization it the renewal needs. It should be noted that over the duration of the implementation of the AMP, the City may adjust the pair-wise analysis to address evolving corporate and facility needs. Figure Building Systems Pair-Wise Category Less than or Equal to and Above Less Importance More 50 The City of Burlington 2016 Asset Management Plan

66 Figure Asset FCI Pair-Wise Category Less Importance More Plumbing Distribution Special Construction Stairs Hazardous Materials Floor Finishes Ice Rinks Structure Exterior Envelop Roofing Interior Construction Interior Finishes Conveying Plumbing Fixtures Site Improvements HVAC Electrical Emergency Systems Facilities and Buildings 51
67 Figure Requirement Pair-Wise Category Less Importance More Operations Building Code Environmental Beyond Useful Life Functionality Grandfathered Code Accessibility Life Safety Appearance Air and Water Quality Miscellaneous Reliability Upgrade Coordination with Other Asset Renewal When developing multiyear capital plans based on the data provided in the Facility Management Application, the following opportunities are considered: Creating multi-component projects for specific buildings; For example, replacing the roof, windows and HVAC systems in a single building; Creating multi-building programs for similar building components; For example, replacing multiple roofs in a single project year across the portfolio. Combining multiple asset classes (Roadways, F&B, Parks & Land Improvements) into a single project at a specific site; For example, replacing a park building concurrent with capital work within the park, or renewing a building parking lot in conjunction with a nearby road project. The first project-based approach minimizes the disruption to the operations of the City buildings when compared to spreading projects over multiple years. Additionally, by designing integrated projects, the opportunity to improve the efficiency or functionality of 52 The City of Burlington 2016 Asset Management Plan

68 the systems is enhanced. For example, if higher quality roof and windows are installed in a building then perhaps a more efficient or smaller capacity (i.e., more energy efficient) HVAC system would be required. This, for example, could result in both capital and operational cost savings. A program-based approach, such as a roofing program, which has been employed by the City to-date, can reduce capital costs as a result of bulk purchasing, as well as streamlined project management for City resources as it is easier to manage a single contract across multiple sites than multiple contracts across multiple sites. A combined asset approach utilizes funding across multiple asset classes and leverages a single Project Manager, allowing for more efficient project completion. Additionally, by combining multiple assets into a single project the overall disruption to residents is minimized. Approach to Options Analysis To enable more effective business decisions, and to assist in addressing the unfunded renewal needs that exist for facilities and buildings, the City should consider looking at whole-asset replacement as opposed to renewing or rehabilitating. The buildings and sites with the highest 5-Year FCI values within the inventory will be analyzed for potential redevelopment. By replacing a building in Poor Condition, the newly constructed asset will provide a much greater LOS to residents, and will also result in a decrease in the overall portfolio-wide 5-Year FCI profile. In many cases, the FCI of individual buildings will likely decrease over the evaluation period as capital dollars are invested. Conversely, some facilities, which have relatively lower FCI s may be allowed to increase slightly based on their relative better condition. As an example, a building with a 0.01 may be allowed to slip to 0.04, which is still within the Very Good condition range. For assets that do not fall into any of the above categories, renewal needs should be included in the on-going capital planning process. Future Demand In forecast years, the City does not expect major geographic expansion and will concentrate on intensification of existing areas of development. As a result, the future expansion of its facilities portfolio will likely focus on the construction of additions to existing facilities and/ or the development of multi-use facilities within the downtown core. Facilities and Buildings 53

69 54 The City of Burlington 2016 Asset Management Plan

70 Parks & Land Improvements Burlington s park system spans over 700 hectares (1,700 acres) and contains extensive infrastructure that ranges significantly in terms of type and value. A five tier park classification system is used to align how parks are used and policy objectives. This begins to define a standard for delivery and essential supporting infrastructure for the parks system. Each classification of park is unique in size, location, service area, configuration, use and level of service. This influences the quantity, quality and type of assets throughout the parks and open space system. A City Park is a large area that offers a variety of uses of interest to the City. They are generally larger than 8 hectares (~20 acres) and often take advantage of significant environmental areas or landscapes. They are typically used as tournament sites with special events programming and linked by community trails and transit. Park infrastructure at these sites comprise of all asset types. Examples include shoreline protection, pavilions, lit sports fields, playgrounds, trails and unique assets such as a pier. There are 10 city parks in Burlington. A Community Park is a larger venue designed to serve between 15,000 and 25,000 residents and are generally between 6 hectares (~15 acres) to 10 hectares (~25 acres) in size. They are intended to be a destination in support of recreational, cultural and social needs as well as organized sports use. Other considerations involve linkages to the community trail system, the provision of off-street parking and the conservation of woodlots or other natural areas to enhance the naturalization of the site. Park infrastructure at these sites include most asset types, such as lit sports fields, playgrounds, multi-use courts, community gardens, splash pads and skate parks. There are 11 community parks in Burlington. A Neighbourhood Park is a smaller area usually between 2 hectares (~5 acres) and 4 hectares (~10 acres) intended to serve a defined neighbourhood area in regards to their outdoor recreational and sporting needs. Such sites typically serve a population of approximately 5,000 within an 800 metre radius. Examples of park infrastructure at these sites include trails, sports fields and playgrounds. There are 58 neighbourhood parks in Burlington. A Parkette is the smallest type of park at approximately 0.8 hectares (~2 acres) or less in size. These sites support passive recreational activities and social spaces. Examples of infrastructure at these sites include trails, seating areas and playgrounds. There are 26 parkettes in Burlington. Special Resources Areas and Linkages are defined as open spaces that are generally sustained in their natural state and used for conservation and/or preservation purposes. These parcels are typically developed around key qualities and attributes of the natural resource base that constitutes the venue such as waterfront lands, forested areas, ponds and marshes. These natural factors will also often determine the size and the location. Examples of infrastructure at these sites include trails, signs and site furniture. There are 18 special resources and/or linkages in Burlington. Parks and Land Improvement 55
71 Non-City Owned Lands are properties owned by outside agencies such as Halton Region, Conservation Halton, Hydro One and Halton District School Board that contain a number of assets owned and maintained by the City of Burlington. Examples of infrastructure include trails, playgrounds, pedestrian bridges and site furniture. Land Improvements - Infrastructure discussed as part of the land improvement section are park-type assets that are generally located within the ROW and around major buildings on non-park sites. Examples include cemeteries, fire stations, multi-pad arenas, etc. Land Improvements include living assets, street furniture in the downtown, facility landscapes and public art. State of the Infrastructure - Parks Asset Data Inventory Park asset data inventories are managed in GIS and decision support systems which are synchronized to allow for efficient sharing of data. The GIS system contains information about asset age, location and condition. The decision support system stores information regarding lifecycle, rehabilitation and replacement strategies and costing. Asset inventories are maintained through regular updates as assets are replaced and/or new assets are acquired. Asset Valuation The estimated replacement value for the park infrastructure assets has been calculated using a three-year historic construction cost average. Unit costs include both hard and soft costs such as design, survey, decommissioning, construction, contract administration, inspection and final acquisition of the newly constructed asset. The replacement cost is reported in current year dollars. Estimated Current Asset Value Table 3.1 below provides a high-level estimate of asset type, quantity and replacement value. The estimated replacement cost is approximately $156 million, which represents 5% of the total asset base. Table Asset Inventory and Asset Value Parks & Land Improvements Asset Type Quantity Estimated Replacement Cost Pathway 100 km $35,025,000 Sports Field 128 $29,815,000 Playgrounds 131 $24,350,000 Unique Assets* 5 $19,950,000 Shoreline Protection 3.9 km $17,702,500 Site Furniture 3727 $7,492,900 Pedestrian Bridges 101 $3,508,625 Signs 589 $2,508,250 Shade Structure 24 $2,910,000 Fencing 32 km $2,715,300 Courts (tennis, basketball) 34 $2,633,350 Skate park 7 $2,150,000 Retaining Walls 271 $1,971,450 Splash pads 5 $1,250,000 Stairs 6 $1,100,000 Irrigation (non-sport) 16 $464,000 Community Garden 4 $320,000 Leash Free Facilities 4 $200,000 Subtotal $156,066,375 *Unique Assets include the Brant Street Pier, Centennial Terrace, special events portable power system, Fairfield School Portico and Kerncliff Park guardrail. 56 The City of Burlington 2016 Asset Management Plan
, best practices investigations with other municipalities or consultation with third party subject matter experts.")
72 Asset Useful Life The asset useful life for park infrastructure is determined using historic information (e.g. how long assets last in the field), best practices investigations with other municipalities or consultation with third party subject matter experts. Asset Condition Assessments There are several legislated requirements and industry standards that drive regular inspections of specific assets and/or asset components. Playgrounds are inspected monthly and backflow preventers are inspected annually. The Spencer Smith Park Seawall has above-water inspections every year and below assessments every 3 years. Pedestrian bridges are included as part of the Ontario Structure Inspection Manual (OSIM) review every two years. All other assets types are on a five year condition assessment rotation outside of regular condition-related feedback from park supervisors and park patrons/user groups. A five-point grade scale has been used to allow reflect physical condition of each asset (see Table 3.2 below). Table 3.2 Asset Condition Grade System - Parks & Land Improvements Condition Grade Very Good % Good 50-74% Fair 25-49% Poor 1-24% Very Poor % Useful Life Remaining Beyond Useful Life Parks and Land Improvement 57

73 Current Asset Condition Table 3.3 below demonstrates the average condition of park asset types. The overall average condition is Good for park infrastructure across the City. Table Asset Condition Parks & Land Improvements Asset Type Pathway Sports Fields Playgrounds Unique Asset Shoreline Protection Site Furniture Pedestrian Bridges Sign Shade Structure Fencing Courts (tennis, basketball) Skate park Wall Splash Pads Stairs Community Garden Leash Free Irrigation (non sport) Average Condition Grade Good Good Good Good Good Good Fair Good Good Fair Good Very Good Fair Very Good Good Very Good Good Good Good Long-Term Needs Summary Figure 3.1 below provides a 60-year average capital renewal need for Park assets. This represents the estimated amount of capital the City requires to reinvest in its existing Park asset inventory on an annual basis to sustain the current level of service. The average need is based on optimized capital life cycle cost where assets are managed at the lowest cost and risk through their useful life. The average need for all Park assets is $5.6M 58 The City of Burlington 2016 Asset Management Plan
74 Figure Long Term Needs Summary $20 Millions $15 60 Year Average Renewal Need, $5.6M $10 $5 $0 Unfunded Now Need Unfunded Renewal Need Annual Renewal Need Average Renewal Need (60yr) The unfunded renewal need in the above chart is estimated at $6.3M. This is defined as the unfunded value of infrastructure renewal needs that require immediate attention as of the current year. Assumptions The following assumptions were used in the development of parks information included in the AMP. Park buildings are in Section 2 Facilities & Buildings Park parking lots are in Section 1 Roadways Some underground assets (sanitary, storm, electrical) are not yet captured Forecasting asset replacement is based on similar function and equivalent utility Prediction model does not consider growth Levels of Service Strategic As part of the City s current strategic plan, there are a number of objectives related to park levels of services including intensification, increased connectivity, healthy lifestyles, environmental and energy leadership and good governance. Mandated Park infrastructure levels of service are directly influenced by many legislative and regulatory requirements. Specific examples include: Ontario Building Code AODA and Burlington Accessibility Guidelines CSA Guidelines Safe Drinking Act Conservation Halton Policies and Guidelines Parks and Land Improvement 59
75 Every resident to live within a minute walk from parks or green space Community Expectations Levels of service are heavily influenced by park stakeholders who include the general public and sport user groups from the community. Over the past few years, a number of community outreach initiatives have taken place with feedback influencing the function and quality of park assets Playgrounds- Have your Say and later in 2015 Love your Playground were public engagement processes that were conducted to collect data and public input about playgrounds. As part of the Community Trails Strategy, the public was surveyed to provide feedback related to the use and improvements to the trail network. services-for-you/resources/initiative%20projects/community_trails_strategy/community_trails_strategy-nov2015.pdf 2015 As part of the 2015 public engagement process for the City Strategic plan, park design and development was listed as part of the top ten important services that the City provides The Sport Unit from the P&R Department surveyed approximately 50 Burlington sport groups for feedback related to quality and satisfaction of sports fields. Feedback from this engagement was used, in part, to inform future capital budgets and to support improved maintenance practices on irrigated sports fields, as reported in Council Report PR Yardstick Park Check Survey was sponsored by three city departments to collect feedback from park stakeholders regarding the importance of and satisfaction with park-specific amenities. Overall, results showed that about 90% of those park patrons surveyed are satisfied with city parks. Affordability Based on current condition information, park assets are generally in good condition; however the 60 year need demonstrates a marked increase in the need for rehabilitation. These renewal needs are identified in the most recent AM Financing Plan and part of the recommended funding to replace assets at the optimal time in its lifecycle. 60 The City of Burlington 2016 Asset Management Plan

76 Asset Management Strategy Maintain or Improve Level of Service Park renewals are based on the strategy of optimizing the value of infrastructure by replacing assets at the end of their anticipated useful life, at the lowest cost while mitigating risk. As park sites are forecasted for renewal, more detailed analysis of how the park is used and customer expectations is conducted as this influences which assets can be decommissioned, rehabilitated or replaced to similar function or equivalent utility. Lifecycle Management The majority of park infrastructure has a run-to-failure life cycle. Other park assets have more complex life cycles that include rehabilitation before a full reconstruction in order to sustain the asset to the end of its anticipated useful life. Examples include artificial turf fields, the seawall, and pedestrian bridges. In most cases, the City is shifting towards bundling park infrastructure renewal either by site or major asset type for improved efficiencies both in terms of cost and resources. Maintenance strategies are designed to enable existing assets to operate to their useful life. There are two types of maintenance. Scheduled Maintenance - work carried out proactively based on regularly scheduled activities specifically tailored to individual asset type, intended to achieve the lifecycle of the asset. Reactive Maintenance - work carried out in response to reported problems (e.g. an asset or component failure). Although some asset maintenance is undertaken on a reactive basis, park supervisors meet on a regular basis with Parks & Open Space staff to plan and prioritize asset rehabilitations and replacements. Risk Analysis When prioritizing park projects that are included in annual capital plans, the City first focuses on addressing specific assets that are considered critical to public health and safety. For example, the Spencer Smith Park seawall is proactively maintained to avoid asset or component failure. In addition to critical assets, specific issues or deficiencies associated with public health and safety, as well as legislated requirements are prioritized. City staff then rely on asset condition ratings and age to allocate the remainder of the annual capital funding. Coordination with Other Asset Renewal The Parks & Open Space section works closely with other service areas such as RPM and F&B to coordinate budgets and workplan for renewal work. This coordination is essential to reduce disruption to the community and create opportunities to save costs by achieving economies of scale associated with bundling larger scoped projects. Parks and Land Improvement 61
77 Approach to Options Analysis The majority of park renewal focuses on a replacing assets with similar function and equivalent utility unless influenced by other factors of levels of service. Future Demand As the City focuses its attention on goals set by the current strategic plan, additional demand for park infrastructure is expected to focus on the recreational trail network throughout the City and expansion of urban parks in the downtown core. Other influences such as changes in climate, technology, population, and economy will have a significant influence over investments in future park infrastructure. Land Improvements Land Improvements are comprised of park-like assets that are located within the ROW or on other City property. The land improvement assets captured in the AMP include living assets (urban trees), downtown street furniture, facility landscapes and public art. The total replacement value of land improvement assets is approximately $44.2 million. The condition and long term needs analysis will be updated in future versions of the AMP. Living Assets As the City continues to intensify, more emphasis will be on Low Impact Development (LID) and increased green infrastructure to mange changes in social, economic and environmental expectations. As per Burlington s 2010 Urban Forest Management Plan, it is estimated that each street tree provides $67 in net benefits annually by providing healthy canopies for shade, reducing energy use and improving air quality. With over 69,000 street trees, there is an estimated $4.6 million value of environmental benefits. Assets classified under the Living Assets category are urban trees. The Urban Forest Management Plan is intended to improve the overall stewardship and management of trees throughout the City, in an effort to improve tree health, and diversity while reducing risk to the public and maximizing the benefits of a healthy urban forest. Future versions of the AMP will broaden the scope of this category to possibly include assets such as green roofs, bio swales and living walls. Street Furniture in the Downtown There are approximately 400 site furnishings that populate the downtown core of the City. These assets exist in the ROW and are similar in asset type to park infrastructure. 62 The City of Burlington 2016 Asset Management Plan

78 Facility Landscapes There are 18 buildings on City-owned properties outside the parks network and include, Appleby Ice Arena Burlington Operations Centre Civic Square (City Hall) 8 Fire Stations Greenwood Cemetery Ireland House Property Joseph Brant Museum Mainway Arena Tansley Wood Community Centre Transit Operations Centre Tyandaga Golf Course Each property has infrastructure similar to the park asset types such as pavements, lighting, signs, flagpoles, site furniture, railings and retaining walls. Public Art Public art refers to works of art that have been created with the specific intention of being sited or staged in a public space. The Public Art Program enhances the quality of life for residents by bringing the work of recognized artists to the city centre and neighbourhoods throughout Burlington. In 2009, the City published a Public Art Master Plan to provide a 10-year roadmap for the public art program and a vision for how public art can enhance Burlington s public spaces. Currently the public art collection consists of 80 artworks with an estimated value of $1.2 million. The City manages a public art reserve fund to pay for maintenance and conservation of the public art collection. Parks and Land Improvement 63
79 64


80 Stormwater Management State of Local Infrastructure Stormwater management assets are built to minimize downstream flooding and erosion, support the capturing and settling of pollutants and play a vital role with improving water quality. Stormwater infrastructure presented in this section includes creek erosion control assets and stormwater ponds. Storm sewer pipes and structures are reported on in the roadways asset category section. Asset Data Inventory The City monitors ten watersheds that include major creek tributaries, and is responsible for over ten kilometres of creek erosion control infrastructure such as bank protection walls, weirs and drop structures. The City is responsible for 26 storm ponds including in/outlet structures, storage pools and maintenance access connections. The asset data inventory and condition information is stored in GIS. All relevant information related to stormwater facilities has been updated into this database. Original design drawings are also available within historic subdivision files. Table 4.1 Stormwater Management Assets Creek Erosion Control Infrastructure Asset Type Quantity Units Armourstone Retaining Walls 4125 m Bank Treatment 416 m Channel Treatment 3842 m Crossing 50 m Dam 1 each Drop Structure 85 m Gabion 896 m Other 240 m Pipeline Crossing 42 m Retaining Wall 1044 m Weir 38 m Asset Type Quantity Units Ponds 26 each Stormwater Ponds As of 2016, the City owns a total of 26 stormwater management ponds. Most of these are retention (wet) ponds providing quality and quantity control benefits. Six of these ponds are detention (dry) facilities which provide peak flow control only. In addition to the City-owned ponds, there are underground storage tanks, privatelyowned ponds, MTO-owned ponds, as well as one pond jointly-owned by the City, MTO, and Stormwater Management 65
81 Conservation Halton. These assets were not included in the AMP given that other entities are responsible for the operations and renewal of the ponds. Asset Valuation The total estimated replacement value of stormwater assets is $67 million The estimated replacement value for the creek erosion control infrastructure assets has been calculated using a three-year historic construction cost average. A standardized costing index was also used to help account for bid fluctuations and material costs. The two costs are averaged and applied as unit costs. The unit costs include both hard and soft costs such as design, survey, decommissioning, construction, contract administration, inspection, and final acquisition of the newly constructed asset. The replacement cost is reported in current year dollars. The estimated replacement value for the stormwater management ponds includes the design, associated hydrologic and hydraulic modeling, appurtenances, related structures, earthworks as well as permits and approvals. The represented cost excludes the land value. Estimated Current Asset Value Table 4.2 below provides details on the stormwater management assets by asset type. The total estimated replacement value is $67 million, which represents 2.3% of the total asset base.. Table 4.2 Estimated Current Asset Value Asset Type Estimated Replacement Value Armourstone $16,659,500 Bank Treatment $1,435,200 Channel Treatment $12,624,950 Crossing $78,000 Dam (each) $26,000 Drop Structure $202,800 Gabion $3,755,700 Other $7,800 Pipeline Crossing $163,800 Retaining Wall $6,074,900 Weir $715,000 Subtotal $41,743,650 Asset Type Estimated Replacement Value Ponds $24,830,000 Subtotal $24,830,000 Total $66,573, The City of Burlington 2016 Asset Management Plan

82 Asset Useful Life For most of the creek erosion control infrastructure, the assets have been designed to last indefinitely. Armourstone has a much longer life cycle than natural channel treatments. Repair or replacement of creek infrastructure assets is more likely to be required as a result of being damaged, as opposed to age-based deterioration. However, useful lives have been developed for all assets for the purposes of forecasting future capital need. Actual capital spend will be more dependent upon impacts due to climate change events, which cannot easily be predicted. The estimated useful life of a stormwater management pond is determined at the design stage by estimating the number of years it will take for the pond forebay to get half-filled with sediment or the number of years it will take for the quality treatment capability of the pond to get reduced by 5%. Asset Condition Assessments The City employs a 5-tiered condition grading summary that is applied to all stormwater management assets. Table 4.3 below provides an overview of the grading system, which is based on the percentage of the useful life remaining. Table 4.3 Asset Condition Grade Summary Grade Very Good >80% Condition Range Good 60% to 79.9% Fair 40% to 59.9% Poor 20% to 39.9% Very Poor <20% Creek erosion control infrastructure condition information is collected and verified through visual inspection by the walking of the creek by a fluvial geomorphologist every five years. The creek assessment study report identifies erosion sites in the creeks and prioritizes them according to the established evaluation criteria listed above. The report provides a list of priority sites based on: Risk Assessment Rating (slope instability, public safety and land use); Material and Performance Condition Rating (Erosion, Structure effectiveness & performance); and Environmental and Creek Characteristics Rating process. High priority sites are selected as those sites whose assessment score is 83 or above. It is noted, however, that creeks are dynamic systems and that since completion of the field investigations, changes may have occurred to creek systems that change the ranking and prioritization. The 10-Year creek restoration and rehabilitation capital program is developed/updated accordingly. The stormwater management ponds are regularly surveyed to detect accumulation of sediments. The results of sediment surveys and the physical condition of the pond is presented in the form of a detailed report. The City s Capital Works department has records which not only provide the accurate conditions of the ponds but projects the operational capacity of the facilities in the future. Stormwater Management 67
83 Current Asset Condition The overall condition for the City s stormwater management assets are Fair to Good Table 4.4 provides the condition ratings for each stormwater management assets class included in the AMP. The creek erosion control assets have been divided into linear (expressed in metres) and point assets to allow for categorization and comparison. Table Creek Erosion Control Infrastructure Linear Asset Type Condition Grade Very Good Good Fair Poor Very Poor Armourstone Bank Treatment Totals Channel Treatment Crossing Drop Structure Gabion Other Pipeline Crossing Retaining Wall Weir Total ,778.1 Percentage 0.53% 71.78% 8.13% 4.32% 15.24% % Point Asset Type Condition Grade Very Good Good Fair Poor Very Poor Dam Stormwater Ponds Asset Type Condition Grade Very Good Good Fair Poor Very Poor Pond Totals Totals Percentage 15.38% 30.77% 23.08% 23.08% 7.69% % The overall condition for the City s stormwater management assets are Good to Fair, with over 72% of the linear creek assets and over 46% of the stormwater ponds in Good or Very Good condition. However, approximately 20% of the linear creek infrastructure and the single dam are in Poor or Very Poor condition. Approximately 30% of the stormwater ponds are in Poor or Very Poor condition. 68 The City of Burlington 2016 Asset Management Plan
84 Long-Term Needs Summary Figure 4.1 below provides a 60-year average capital renewal need for Stormwater assets. This represents the estimated amount of capital the City requires to reinvest in its existing Stormwater asset inventory on an annual basis to sustain the current level of service. The average need is based on optimized capital life cycle cost where assets are managed at the lowest cost and risk through their useful life. The average need for all Stormwater assets is $1.2M Note that Stormwater management needs are highly sensitive to environmental impacts such as storm events which are difficult to predict. The 2014 storm event is an example where the short term capital need increased substantially enough, effectively advancing the 60 year average renewal need. Assumptions The following assumptions were used in the preparation of the stormwater management section of the AMP: Stormwater management pond condition data is based on a sedimentation rating, not a life-cycle rating; Forecasted cleanout frequency is based on standardized calculations completed by the City. Actual cleanout is undertaken when the sediment accumulation is confirmed by a sediment survey; Once the pond is cleaned, the operational capacity is assumed to be restored to 100%. As the ponds age, the condition indicator is gradually reduced until it requires renewal by dredging; The detention ponds do not require regular clean-out as they are not designed to capture sediment. It is therefore assumed that the detention ponds have a servicing life of 20 years for the purposes of calculating the condition rating; Ponds that have sufficient capacity, but have sediment accumulation and therefore require a cleaning operation, are assumed to have an additional five years of life remaining for the purposes of calculating the condition rating; and Privately owned ponds and ponds owned by other agencies have been excluded from the analysis for City s AMP. Figure 4.1 -Long Term Needs Summary Millions $4 $3 $2 $1 60 Year Average Renewal Need, $1.2M $ Annual Renewal Need Annual Renewal Need (60yr) Stormwater Management 69
85 Levels of Service Proper maintenance of storm ponds and creek blocks mitigates the risk of flooding by efficiently conveying rainwater to the receiving waters Strategic The City has determined that its desired LOS for its stormwater management assets is to have all assets in a condition of fair or higher by the end of The stormwater management ponds are designed to retain storm runoff to reduce flooding up to a 100-Year Regional Rain event. The water level may reach various levels during a given rain event. The capability of the stormwater facility to retain the runoff generated from the design event is a direct measure of its flood control performance. The ponds are also designed to filter suspended solids from the storm runoff. They are designed to meet the Enhanced (80% removal of suspended solids) or Level 2 (70% removal of total suspended solids) quality treatment levels. As the sediment levels rise within the pond, the quality control functionality is gradually reduced until a cleaning is required to restore the design functionality. Based on the above criteria the City has developed the following Key Performance Indicators and targets for stormwater ponds: Performance Measure; Ability to provide flood control for the design event; Ability to remove suspended solids from runoff; Targets; Retain flood waters generated from a 100 year or a regional Rain event; Remove up to 80% of suspended solids from the runoff; Timeframes The ponds have different timeframes when they require cleaning operation, which depends on the type of the drainage area as well as the design and shape of the pond. Typically, a wet pond will require cleaning anywhere within 10 to 15 years. The dry ponds require less frequent cleaning. Mandated The creek erosion control infrastructure must abide by the following regulations: Provincial Technical Guide River and Stream Systems in assessing unstable slopes; Methods for Assessing Habitat in Flowing Waters: Using the Qualitative Habitat Evaluation Index (QHEI), June 2006; and HADD assessment as per Fisheries Act. There is no legislated LOS associated with stormwater ponds. Community Expectations Mitigating risk, ensuring proper function and effective management of the assets are the main expectations of the community. Proper maintenance of storm ponds and creek blocks mitigates the risk of flooding by efficiently conveying rainwater to the receiving waters (i.e. Lake Ontario). The application of asset management principals allows the City to plan rehabilitations for the next 60 years and ensures that funding is available to replace assets at the optimal timing and cost. 70 The City of Burlington 2016 Asset Management Plan
86 Affordability In selecting an LOS, it is critical that achieving the target must be reasonable from a financial perspective. Although an LOS is meant to be a stretch goal, the target must be achievable without creating an unreasonable funding gap that the City will have a low probability of achieving. Based on condition information, the storm water management assets are currently in Fair however extreme weather events are a risk to the overall asset management strategy which could result in greater rehabilitation needs. Asset Management Strategy Maintain or Improve Level of Service The City has determined that its desired LOS for stormwater management assets is to have all assets in fair or better condition by This is an improvement from its current status, wherein approximately 25% of the assets are in Poor or Very Poor condition. Lifecycle Management Regular visits by City staff are completed to confirm performance of the stormwater ponds and to identify any maintenance needs. In addition, regular and more efficient street cleaning will greatly enhance the life of the stormwater management facilities. Employing low-impact development strategies within the new and infill development will reduce the pressure on the end-of-pipe stormwater facilities by promoting infiltration and capturing sediment during the runoff conveyance stage. When installing new stormwater management assets and renewing major components of existing assets, Lifecycle Cost Analysis (LCA) should be used to analyze different renewal options to determine which has the lowest total cost of ownership over the lifetime of the systems. For the creek erosion control infrastructure, debris and removal of fallen trees in creek flow path and minor erosion control works to stabilize creek banks (if a safety concern) are completed as required. Detailed creek inspections are conducted every 5 years. If necessary, minor erosion control repairs are carried out on an ongoing basis. The City s Capital Works department, in collaboration with the Parks and Roads Department, regularly monitors the ponds and any identified deficiencies are rectified. The City also undertakes regular sediment surveys which provide an opportunity to inspect the ponds and undertake needed repairs. In addition, City staff also visit and inspect facilities to look for any unauthorized use of the ponds including unauthorized release of fish, trespassing and dumping. The primary renewal activity for stormwater management ponds assets is regular sediment cleanout, which rehabilitates the facility to the original design capacity. Certain pond features and components are more vulnerable to deterioration and require frequent maintenance. These features include slopes, vegetation, emergency spillways and outlet structures and appurtenances. The emergency spillways are monitored closely and on a regular basis after rainfall events for evidence of any erosion. The ponds are also regularly inspected for any unauthorized access and if the bollards, fences or gates are found damaged, they are repaired. If maintained regularly and vigilantly, the stormwater management facilities have a long, Stormwater Management 71

87 almost indefinite, useful life. Stormwater management facilities are built as part of the subdivision development. Once the City assumes ownership of the built subdivision, the stormwater management facilities are maintained by the City. If a stormwater management pond was to be built by the City, it will require a detailed design which includes hydrologic modeling and permitting from the review agencies including the local conservation authority and the MOE. Risk Analysis The following considerations associated with asset criticality and risk are applied to the decision making process associated with the creek erosion control infrastructure: The City relies on the reports and data collected as part of the Creek Inventory and Assessment report completed every 5 years. This information feeds the 10-Year Capital Budget & Forecast and the Minor Erosion control works program. Extreme weather events are a risk to the overall asset management strategy and such events have a potential to change the priorities. Two major resources that the City relies on to effectively offset risks associated with the asset management strategy for stormwater ponds: Technically qualified staff: As mentioned in the sections above, the stormwater management facilities require regular inspection and monitoring in order to ensure the intended and a continued level of service. This is possible by having appropriately trained and educated technical staff to provide the technical know-how to manage and maintain the stormwater management facilities. Retention of qualified Water Resources Professionals and Hydrologists is essential for the City to continue to provide the flood control and stormwater management service. The same qualified staff is responsible to review the pond designs and confirm fulfillment of all assumption and certification requirements before the City takes over maintenance of the facilities from the developer. Investment: As per the sections above, the stormwater management ponds have to be cleaned and dredged on a regular basis to maintain their serviceability. Dredging is an expensive operation which, depending on the size of the pond, could go beyond $100,000. It is essential that predictable infrastructure investment is maintained in order to keep the stormwater management facilities functional and to reduce the risk of flooding of private properties and public infrastructure. This will also assist to maintain the facilities to prevent erosion of the natural channels and keep our water bodies in their pristine condition. 72 The City of Burlington 2016 Asset Management Plan

88 Coordination with Other Asset Renewal Renewal and replacement activities at where creeks are crossing roads or other linear infrastructure is prioritized and cross-referenced against planned projects before being incorporated into the Capital Budget and Forecast. Planned work may also require coordination with other key agencies and stakeholders, such as Department of Fisheries and Oceans (DFO), Ministry of Natural Resources (MNR), Conservation Halton, Metrolinx, Canadian Pacific Railway (CPR) and Canadian Nation Railway (CNR). Approach to Options Analysis When planning rehabilitation to creek infrastructure or channel treatments, design considerations should focus on incorporating the right materials, taking into consideration capacity, environmental and cost factors. Future Demand The main concern that is likely to impact the expected level of service is rapidly changing weather. Rain events have become more severe and intense which, together with the urbanized landscape, produce flood events that exceed the retention capability of the stormwater detention pond. Furthermore, the ponds could become filled up with sediment quicker than anticipated which will require more frequent cleaning, exerting pressure on the financial resources to maintain the flood control and sediment control services. Stormwater Management 73
89
, Fire and Transit.")

90 Fleet Vehicles and Equipment The City owns and maintains 255 vehicles and 780 pieces of fleet-related equipment. Infrastructure is managed across three areas: Corporate Fleet (Roads and Parks Maintenance), Fire and Transit. The corporate fleet assets include heavy, medium and light vehicles that perform a variety of services from earth moving to snow plowing. The equipment includes heavy, medium and light equipment, from zambonis to trimmers, mowers and blowers. Tyandaga Golf Club assets are also managed by RPM. Transit s fleet service provides conventional and specialized transit transportation. Transit operates over thirty routes with weekday, weekend and holiday service. The fleet consists of conventional forty-foot buses, conventional thirty-foot buses, Handi-Vans (Access), support and MV-1 vehicles. Transit Shelters and Benches are in the roadways sub-section Fire s fleet is a collection of vehicles and equipment required to respond to emergencies. The assets used include fire suppression and support vehicles and an assortment of emergency services equipment. Fleet Vehicles and Equipment 75
91 State of Local Infrastructure Asset Data Inventory The estimated replacement value of the City s fleet and equipment is $71 million The fleet asset data inventories are maintained in a work order management system for tracking vehicles and equipment, issuing/managing work orders, preventative maintenance and inspection programs, parts inventory, purchasing fuelling and associated costs. Some data related to transit fleet assets is managed within department inventory databases. Regular updates to the inventory are completed after regularly scheduled maintenance activities, renewal and replacement of fleet assets. Table 5.1 below details the quantity of assets each service area is responsible for: Table 5.1 Asset Inventory Vehicles & Equipment Service Area Asset Type Quantity (each) Corporate Fleet Fire Transit Vehicles 145 Equipment 495 Vehicles 44 Equipment 280 Vehicles 66 Equipment 5 Total Vehicles 255 Total Equipment 780 Grand Total 1,035 Asset Valuation RPM and Fire develop their current replacement values by using historical cost and inflation. The relatively short life of fleet assets and the availability of off-the-shelf vehicles and prices make this practice feasible. For more complex equipment and vehicles (requiring a degree of customization or the addition of equipment to a base vehicle), additional time is required to assess replacement values at the anticipated time of purchase. The replacement value for transit vehicles is determined by reviewing the costs based on recent purchases, current market costs, regulated codes and requirements and related soft costs. 76 The City of Burlington 2016 Asset Management Plan

92 Estimated Current Asset Value The estimated replacement value of the City s fleet is $71 million, which represents 2.4% of the total asset base. Table Asset Value - Vehicles & Equipment Service Area Corporate Fleet Fire Transit Asset Type Estimated Replacement Value Vehicles $11,503,809 Equipment $10,054,523 Vehicles $15,105,256 Equipment $4,852,609 Vehicles $28,893,439 Equipment $188,702 Total Vehicles $55,502,504 Total Equipment $15,095,834 Grand Total $70,598,338 Asset Useful Life The average lifecycle of an asset is 10 years, with the shortest being 2 and the longest 30. Once an asset has reached its end of useful life, it is removed from service and auctioned off. Transit fleet vehicles operate on a defined life cycle. This replacement strategy is based on every 12 years (buses) and 7 years (support vehicles). Supporting assets, such as presto and fare boxes, radios and miscellaneous equipment may have different useful lives and can be transferred to new vehicles at the time of replacement. The useful life for Transit fleet vehicles is based on a review of historical replacement of similar assets, best practices investigations with neighboring municipalities and consultation with a third party. The Fire department has a predetermined life cycle for each class of equipment. Industry best practices and manufacturer s recommendations are utilized to determine the expected useful life of emergency equipment. Front line emergency response vehicle life cycles are guided by National Fire Protection Association standards. Fleet Vehicles and Equipment 77

93 Asset Condition Assessments Corporate fleet and equipment are inspected at regular intervals to meet regulatory requirements and evaluated for any major changes in condition or ability to meet estimated useful life. Additional inspections on RPM vehicles and equipment are completed when an asset reaches the end of its expected useful life, at which point factors such as overall condition, hours used, service needs and industry trends all impact the decision to either extend or replace the unit. Corporate fleet and equipment are inspected at regular intervals to meet regulatory requirements There are several legislated requirements and industry standards that drive regular inspections of Transit vehicle components, such as: brakes, engine controls, steering, suspension, electrical components, tires and wheels. For Fire, annual mandatory testing is performed on some specific pieces of equipment. Front-line emergency response vehicle life cycles are guided by National Fire Protection Association standards. For all fleet assets, condition is verified in the following ways: Visual inspections; Legislative requirements such as safety certifications; Feedback received from operators, supervisors and other stakeholders; Preventative maintenance performed on the unit; and Inspections performed by mechanics during regularly scheduled maintenance. Current Asset Condition The City has developed the following condition grade system presented in Table 5.3 below. The system is based on the percentage of remaining useful life for each vehicle or equipment asset as a result of operations. Table 5.3 Asset Condition Grade System - Fleet & Equipment Condition Grade Very Good 76% to 100% Good 51% to 75% Fair 26% to 50% Poor 0% to 25% Very Poor Less than 0% % of Useful Life Remaining 78 The City of Burlington 2016 Asset Management Plan
94 Table 5.4 below provides the condition grade breakdown by department for the fleet vehicles and equipment. Table Fleet Vehicle & Equipment Condition Grade Condition Grade Corporate Fleet Fire Transit Total % Veh Equip Veh Equip Veh Equip Very Good % Good % Fair % Poor % Very Poor % Totals % Long-Term Needs Summary Figure 5.1 below provides a 60-year average capital reinvestment need for Fleet assets. This represents the estimated amount of capital the City requires to reinvest in its existing Fleet asset inventory on an annual basis to sustain the current level of service. The average need is based on optimized capital life cycle cost where assets are managed at the lowest cost and risk through their useful life. The average need for all Fleet assets is $6.6M Figure Long Term Needs Summary Millions $12 $10 60 Year Average Renewal Need, $6.6M $8 $6 $4 $2 $ Annual Renewal Need Annual Renewal Need (60yr) Assumptions The assumption for corporate fleet inventory is that vehicles and equipment being replaced based on a similar function and equivalent utility. The following assumptions were used in the development of Transit Fleet information included in the AMP: Transit operations centre and downtown transit buildings are in Section 2 - Facilities & Buildings section 60-year average renewal need does not consider service growth/expansion Fleet Vehicles and Equipment 79
95 Levels of Service Strategic The performance and success of the fleet assets is measured by the setting of strategic targets. Overall, the City will continue replacing vehicles when they reach the end of their useful life. As part of the City s strategic plan, there are a number of objectives related to Transit fleet levels of service. Many of the objectives published in the plan are part of current Transit fleet service levels with some new objectives such as adapting to an aging demographic, environmental responsibility and technological advancements. For Fire, front-line emergency response vehicle life cycles are guided by National Fire Protection Association standards. Mandated Establishing levels of service helps to ensure that all of the following regulatory requirements are met: Ontario Ministry of Transportation (MTO) On-Road Vehicle and Engine Emission Accessibility for Ontarians with Disabilities Act (AODA) Highway Traffic Act and Public Vehicle Act Supporting documentation related to asset performance measures include: Commercial Vehicle Operations Registration (CVOR) Reports; Preventative maintenance records; and Training records Community Expectations Seeking community input to levels of service provides Transit with information on which aspects of the service will make a difference to customers. This input helps balance the needs of the community with available infrastructure funding. Levels of service are influenced by ridership levels as well as results from public engagement initiatives. Burlington Transit is in the early stages of creating a Transit Master Plan and will be gathering input from the community on desired levels of service for public transit. Engagement with customers ensures needs and expectations are met, assets are maintained/operated properly, and vehicle and equipment replacements are individually reviewed for best fit for the service. As internal services, corporate fleet engages with internal customers to ensure that community expectations and needs are met. Asset Management Strategy Maintain or Improve Level of Service The overall operations and maintenance strategy is intended to maintain the current levels of service and mitigate risk while minimizing cost. Fleet vehicles are replaced and disposed at the end of their expected useful life. Replacing assets too soon is inefficient and replacing assets beyond their useful life increases levels of risk. Lifecycle Management In order to manage assets at the lowest lifecycle cost within the assets useful life, the City adopts various best practices for its fleet and equipment such as: Performing regular vehicle inspections; Documenting issues during vehicle circle checks; Following a scheduled maintenance approach, a full vehicle assessment is performed at the time of maintenance to ensure any other issues are addressed; Adhering to the manufacturer s preventative maintenance schedule; Providing operations personnel with driver and equipment training to address proper use and maintenance for each asset; Performing yearly condition assessments of assets due for replacement to ensure items are replaced at the correct time; and Fleet asset management utilizes principles and templates that are designed to optimize the asset s lifecycle. Fleet maintenance strategies are designed to enable existing assets to operate to their service potential over their useful life. There are two types of maintenance: Reactive Maintenance - Work carried out in response to reported problems (e.g. an asset or component failure); and Scheduled Maintenance: Work carried out based on regularly schedule activities specifically tailored to individual asset type, intended to meet the expected useful life of the asset. Fleet maintenance is performed mostly in-house by the mechanic staff, however in certain cases can be outsourced if the repairs require specific technical expertise. Once the assets have reached their end of useful life, staff conducts a needs assessment with relevant stakeholders to understand current use of the assets. Such consultation allows a thorough review of service need vs. available technology and as a result, assists in the development of extensive specifications to be included in the document for bid. Once the new unit is received, the old is 80 The City of Burlington 2016 Asset Management Plan

96 disposed by decommissioning and auctioned. Funds received from the sale of the vehicle are returned to the reserve fund and applied to the replacement of existing assets. Emergency response vehicles are checked daily and sign off is completed by the operator. Any outstanding issues are documented in a defect report which is monitored by the Fire Department staff. A preventative maintenance program is in place with regularly scheduled checks of each apparatus to monitor, note or repair any and all vehicle related issues. Emergency response equipment is checked and maintained daily by Fire Department staff. This work is documented in the form of defect reports. Risk Analysis Fleet vehicles and equipment are assessed for risk when prioritized as part of the capital budget. Vehicles and equipment, where utilization and mileage is high, would have a greater probability of failure. Any fleet asset of significant financial value or fleet assets relating to fire and transit are considered to have a high consequence of failure. Assets where there is little to no redundancy (spares) are also deemed to have a high consequence of failure. Transit buses and Fire trucks are primarily purchased through U.S. vendors, which expose the City to exchange rate fluctuations. Coordination with Other Asset Renewals The renewal or replacement of fleet vehicle and equipment assets are not typically undertaken in coordination with other asset category renewals. Approach to Options Analysis Full life cycle costs, equipment compatibility and environmental factors are considered against other options at the time of acquisition, renewal, replacement and disposal. Future Demand Factors that will impact the future demand for fleet vehicles and equipment will include: Future growth and development. Transit, in particular, has the potential to contribute to a more economically vibrant, healthy and sustainable city. The need to realize this potential in Burlington will become increasingly important; Population growth, changing demographics and mobility for individuals who do not have access to a private automobile; New technology; and Green Trends (for example: electric vehicles and equipment, alternative fuels, etc.) Fleet Vehicles and Equipment 81
97 Photo or graphic page to break up text/sections 82 The City of Burlington 2017 Assest Management Plan
.")

98 IT Services IT Services provides professional consulting services by proactively assisting the business with technology solutions that meet business objectives. IT Services manages a large portfolio of projects varying in size and degree ofcomplexity. An annual project work plan is approved by the corporate IT Steering Committee (ITSC). Work plan adjustments are made throughout the year using a change management process which is managed by the ITSC. ITS works with customers throughout the life of a project, defining needs, assisting with procurement, and often managing the implementation. IT Services deliver desktop hardware and software support, business application management and support, security, training and general consulting. IT Services is also responsible for managing the City s data centres, network, internet access, and telephone system. IT Services manages the life-cycle of all IT assets ensuring ongoing system reliability. IT Services coordinates major upgrades, applies fixes, responds to requests for improvements and provides general support to the user community. The information technology (IT) environment is extremely complex and consists of more than 150 business applications that are delivered through a combination of vendor hosted services and internally delivered applications. IT Services manages contracts and relationships with the IT vendors who supply the systems. A core set of six to ten systems form the foundation of the City s critical business systems and serves the needs of multiple service areas. IT Services supports application integration to facilitate automated data transfer between business systems. IT Services staff support more than 1,200 user IDs and about 2,900 devices (including PCs, phones, laptops and servers). IT Services manages all computer-related issues for the City through a centralized service desk and responds to approximately 12,000 incidents and requests each year. The City s computer network extends to 39 facilities throughout Burlington. A secure internet connection provides access to services outside the City s network. IT Services 83
99 State of Local Infrastructure Asset Data Inventory IT Services retains information about hardware and software assets in a variety of applications and data systems. Existing methods of compiling and retaining IT asset information include: the estimated replacement value of IT assets included in the AMP is over $44 million Excel spreadsheets related to previous asset calculations for the Public Sector Accounting Board (PSAB) standards. The vast majority of information in these spreadsheets originated from SAP reports, generated for financial planning purposes; Desk telephones are tracked with an Excel spreadsheet; Application Support Library (ASL) is also maintained as an Excel spreadsheet. The ASL is a listing of known and current business applications, and functions as an inventory that includes information about maintenance contracts and software vendors; Questica, the City s budget planning data system, is the primary source of financial information related to the ongoing maintenance support costs; ServiceDesk is the central system used by IT Services to manage the Help Desk for incidents, requests, problems, and changes related to technology. The ServiceDesk application contains information on the number and type of hardware and desktop software applications (e.g. Adobe, Visio). ServiceDesk does not include information about business applications or enterprise systems assets; and Agreements can be a helpful source of unstructured information on IT assets, containing in some cases valuable details on the expected costs, requirements, and maintenance for hardware and software. However, agreements are typically dispersed corporate-wide in a variety of storage formats and locations, with varied ownership and governance depending on the individual agreement. Table 6.1 below provides the details of the IT assets that have been included in this section of the AMP. The hardware assets consist of servers, telephones, switches and workstations. Servers include storage, appliances, firewalls, controllers. The software assets consist of major and minor software that resides on City servers as well as externally hosted solutions. Table 6.1 Asset Inventory - IT Services Hardware Asset Type Quantity Servers 300 Telephones 864 Switches 102 Workstations 924 Subtotal 2,190 Software Asset Type Quantity Major 14 Minor 100 Hosted solutions 9 Subtotal The City of Burlington 2016 Asset Management Plan
 and cell phones (consumable).")
100 Note: The data above does not include assets that are maintained in another asset area or that are consumable. Examples are Uninterruptable Power Supplies, cabling (facility assets) and cell phones (consumable). Asset Valuation Given the short lifespan of IT assets, the replacement values maintained by the City are based on the most recent purchase price or license fee for an asset. However, given the dynamic schedule for both software and hardware IT assets, the City also updates asset values based on changing market prices from its vendors and suppliers. Estimated Current Asset Value Table 6.2 below provides details on the IT management assets by asset type, including the estimated replacement value. For the City, the value of IT assets included in the AMP is estimated at $44.7 million, which represents 1.5% of the total asset base. Table 6.2 Asset Value IT Assets Hardware Asset Type Quantity (each) Estimated Replacement Value Servers 300 $1,220,000 Telephones 864 $1,220,000 Switches 102 $650,000 Work-stations 924 $982,000 Subtotal 2,190 $4,072,000 Software Asset Type Quantity (each) Estimated Replacement Value Major Software 40 $29,106,000 Minor Software 100 $7,500,000 Hosted Solutions 9 $4,054,000 Subtotal 149 $40,660,000 Total 2,339 $44,732,000 Asset Useful Life Using industry standards, as well as historical patterns for asset performance and replacement, the City has developed useful lives for each hardware asset type for forecasting purposes. However, given the pace of change, some hardware systems are replaced prior to the end of their useful life due to functional or performance requirements by City staff. Based on historical patterns for upgrades, the City has developed an expected schedule for major upgrades of software assets. However, replacement or upgrading of software is driven by the actual upgrade cycles implemented by the software vendors. IT Services 85
101 Asset Condition Assessments The City employs a 5-tiered condition grading summary that is applied to all IT assets. Table 6.3 below provides an overview of the grading system. Table 6.3 Asset Condition Grade System - IT Services Condition Grade Very Good >75% % Useful Life Remaining Good 50% to 74.9% Fair 25% to 49.9% Poor 1% to 24.9% Very Poor Beyond Useful Life Table 6.4 below provides details of the processes used by the City to determine the condition of its hardware assets. Table 6.4 Hardware Condition Processes Asset Type Servers Telephones Switches Workstations How Condition Information is Verified Servers are regularly monitored by different tools, including SolarWinds, Cisco and AlertSite. Reports are available from each of these tools and some produce regular alerts to further assist with infrastructure maintenance and operations. Functional and performance issues are reported by end-users via ServiceDesk. Health checks are performed by the desk telephone vendor as required, upon request. N/A Incidents and problems related to desktops and laptops are recorded and verified in ServiceDesk, along with the particulars of an original service request and details of the resolution. Current Asset Condition Table 6.5 provides the condition rating information for the hardware assets included in the AMP. Table Hardware Condition Grade Condition Servers Telephones Switches Workstations Total Percentage Very Good % Good % Fair % Poor % Very Poor % Totals % 86 The City of Burlington 2016 Asset Management Plan
102 Table 6.6 provides the condition rating information for the software assets included in the AMP. Table Software Condition Grade Condition Major Software Minor Software Hosted Solutions Total Percentage Very Good % Good % Fair % Poor % Very Poor % Totals % As demonstrated in the above condition grade tables, over 50% of hardware and software assets are in Good or Very Good condition. No assets are in Very Poor condition as hardware is typically replaced when it reaches the end of their useful lives. Software conditions tend to be Good or Very Good as ongoing upgrades are applied throughout their life ensuring the asset condition does not deteriorate. The hardware and software assets that are in poor condition (i.e. less than 25% of useful life remaining) are valued at over $5,000,000. Long-Term Needs Summary Figure 6.1 below provides a 60-year average capital renewal need for IT assets. This represents the estimated amount of capital the City requires to reinvest in its existing IT asset inventory on an annual basis to sustain the current level of service. The average need is based on optimized capital life cycle cost where assets are managed at the lowest cost and risk through their useful life. The average need for all IT assets is $2.4M The unfunded renewal need as per the above chart is estimated at $390K. This is defined as the unfunded value of infrastructure renewal needs that require immediate attention. Figure 6.1 -Long Term Needs Summary Millions $5 $4 $3 60 Year Average Renewal Need, $2.4M $2 $1 $0 Unfunded Now Need Unfunded Renewal Need Annual Renewal Need Average Renewal Need (60yr) IT Services 87
103 Major and Minor Software applications can continue to provide service beyond their expected lifecycle provided that maintenance for the system is effective and ongoing Assumptions The following assumptions were made in developing the IT Services section of the AMP. Current software mix of hosted and on premises can shift over time having an impact on the funding requirements. For the purposes of this analysis the current mix of hosted and on premise software solutions was assumed going forward; Replacement costs include the expense and complexity of migrating data from legacy systems; Replacement costs currently assume that Major and Minor Software will be replaced with a like-for-like system, though this will not always be the case in reality. As systems and business requirements constantly evolve, systems are expected to gradually consolidate over time in future years; Lifecycle calculations assume that all hosted solutions will utilize full contract extensions at least once before renewal or replacement is required; Major and Minor Software applications can continue to provide service beyond their expected lifecycle provided that maintenance for the system is effective and ongoing; Existing system vendors will remain in business and provide support indefinitely; Customers will not object to the use of existing applications indefinitely; Upgrades may have an operating or capital budget impact; and Frequency of major upgrades is assumed to be every three years. 88 The City of Burlington 2016 Asset Management Plan
104 Levels of Service (LOS) As this is the first AMP that the City is developing it has selected a purely condition-based LOS for its IT assets throughout the 10-year time horizon. Details of the specific LOS for each asset class will be provided in the appropriate subsection below. Strategic At present the City s desired LOS for its IT assets is to replace the assets when they have reached the end of their useful life and are classified as being in Very Poor condition based on the City s condition rating scale. IT Services has established a set of Key Performance Indicators (KPI) in its service business plan. The KPIs are currently used to track performance of assets as well as providing a guideline for when to replace an asset. Going forward, the City is looking to expand its LOS to be based on the KPIs that it measures for its IT assets. Table 6.7 below provides details of the specific IT asset KPIs that are tracked by IT Services, as well as actual results for previous years. Table 6.7 IT Services Key Performance Indicators KPI Asset Type Tracked? Notes Actuals Number of ServiceDesk tickets received (incident and requests) Number of devices supported Operational uptime of critical systems % Customers satisfied with IT Services All Desktops, Laptops, Telephones Software Major Applications All Yes Yes Yes Yes -indicates number of break / fix -included in service plan -included in service plan -included in service plan -goal is 99.90% uptime -included in service plan -measured by annual survey -goal is 80% by , , , , , , , % % % % % % % Mandated There are no specific legislative requirements that drive LOS for the City s IT assets. Affordability Any future changes to LOS must be measurable and capable of being translated into financial terms to allow for integration into the Financing Strategy IT Services 89
105 Asset Management Strategy Maintain or Improve Level of Service The City has determined that its target LOS for its IT assets is that all assets will be replaced when the end of the useful life is reached, and they are considered to be in Very Poor condition. In achieving this LOS, the City will be maintaining the current LOS as currently no IT assets are in Very Poor Condition. The City balances a wide range of issues that drive demand for IT assets Lifecycle Management IT asset lifecycles are managed using a number of different methods including; extending the useful life of the asset through ongoing preventative maintenance activities; renewal of assets beyond useful life through the procurement process; and decommissioning assets once they are no longer in use. Part of maintaining IT assets includes the procurement of replacement and new assets. IT Services is bound by the City s Procurement By-law. The IT Services Team works with project managers to determine the best and most appropriate procurement method, including the requirement for a legal agreement, negotiation, purchase order, RFQ / RFI / RFP etc., and determination of associated risk. Technology procurement can be governed by licensing agreements including shared services agreements and Public Sector Licensing requirements from the Provincial Government. The City utilizes Value-Added Resellers for some hardware and software purchases, where appropriate. Risk Analysis Data and information is dispersed across multiple asset data inventories and systems, including Excel, ASL and ServiceDesk. This introduces risk for the accuracy and reliability of information associated with IT assets. For hardware infrastructure, IT Services relies on a below-grade, on-premises data centre. This poses a risk of major data loss or service interruption in the event of flooding, a sprinkler release, or other catastrophic event at City Hall. For software, the overall number of systems that are managed and/or supported by IT Services is steadily increasing. The continued increase of unique data systems has been identified as a significant risk for information duplication, compromised accuracy and lost opportunities for corporate reporting. The Enterprise Application Integration and Business Intelligence project will help to mitigate this profusion through the utilization of an effective middleware solution, however the risk of further system proliferation remains. Data is a vital asset that needs to be adequately secured and protected. Security breaches are increasing industry-wide. These can be very costly and affect an organization s integrity and customer trust. Maintaining secure systems is a bigger challenge in an increasingly complex IT world and requires ongoing diligence and attention. Future Demand Given the dynamic nature of IT innovation and capabilities, as well as evolving needs of City staff and departments, the City balances a wide range of issues that drive demand for IT 90 The City of Burlington 2016 Asset Management Plan
106 assets. The following sections provide details of many of the main drivers of future demand: Pace of Change and Agility Technology is changing more rapidly than ever. Customers expect that new technologies will be made available quickly for their use. With staff resources consumed largely by operational needs, it is difficult to adopt new technologies in a timely manner. Mobile Technology Mobile technology provides the opportunity to consider alternative ways of working by giving staff the ability to access information at any time from anywhere. Mobile technology can help reduce the need for dedicated office space, streamline operations, and improve customer service. Data and Information as Corporate Assets The millions of data fields, tables, and the information gleaned from them are valuable corporate assets in their own right that require effective management. IT Services and the Corporate IT Strategy intend to champion corporate data and information as assets, and apply the principles of asset management in order to inventory, assess and estimate the replacement value of data and information resources within the organization in future. Changing Industry Trends Information and technology services are shifting increasingly to a cloud-based delivery model, moving away from the traditional provision of all required technology services via systems and staff located on-premises. Increasing levels of IT services are now delivered through agreements with third parties for infrastructure as a service, application hosting, mobile application development and technical support. The scope and range of available cloud services is expected to increase in coming years, along with customer interest in leveraging cloud services due to advantages that include shorter deployment timelines, flexible delivery models, and lower implementation costs. It is yet to be determined what the long-term impacts of greater cloud service adoption will be at the City of Burlington, including a full understanding of increased operating maintenance costs, skill sets and professional development, security and information governance concerns. As the delivery model for IT services shifts from on-premises to cloud-based, the City will need to develop new methods of identifying, assessing and managing the condition of technology assets. Where a component of infrastructure or a major system has shifted from an on-premise to cloud-based model, for example, previous replacement costs and maintenance fees may lose their relevance. This trend is expected to add complexity to the exercise of projecting future investment requirements for successful IT service delivery within the organization. IT Services 91
107


108 Financial Section The City has developed an Asset Management Plan (AMP) to effectively manage and sustain the city s infrastructure. The AMP in conjunction with a long-term financing plan will ensure that the City is managing its infrastructure in a manner that is fiscally responsible and sustainable over the long-term. The key objective is to ensure the city has predictable investment in infrastructure to mitigate time-varying pressures such as aging, deterioration, increasing demand and climate that affect the current state and the overall long term performance of the city s assets. This section provides a summary of the financial information presented as part of the individual asset category in order to have an overall understanding of the financial need of the city s infrastructure. The financial data and future projections is based on the current asset inventory and condition information to date, focused on optimal asset lifecycle, value based level of service and meet current legislative requirements. The Financial Section of the AMP is summarized in the following sections; Predictable Infrastructure Investment Replacement Values & Unfunded Renewal Need Capital and Operating Historical Expenditures Future Renewal Need Risks & Assumptions Importance of Full Life Cycle Costing Financial Section 93
109 Predictable Infrastructure Investment City of Burlington has been proactive in providing a base level of dedicated infrastructure funding to the city s capital program over a number of years while the city moves forward to asset management based on full lifecycle costing. This dedicated funding has provided the flexibility and liquidity required to finance current infrastructure needs, as well as assist in addressing the unfunded renewal needs. The following presents a historical overview of City s investment in renewing the city s infrastructure A dedicated infrastructure renewal levy of 0.7% was introduced and incremental increases to the levy have continued The city directed the annual GTA Pooling dollars towards infrastructure renewal which amounted to approximately $6.4 million annually by 2013 once fully realized City Council introduced a further $550,000 annually dedicated to roads resurfacing (shave and pave) in an effort to address a greater amount of roads renewal needs in order to mitigate more costly rehabilitation in the future The city undertook a detailed review of infrastructure renewal needs over a 60-year time horizon and adopted a 20-year holistic financing plan to mitigate the unfunded renewal needs and address future infrastructure needs. Below is a summary of the 20- year scenario. For more information, see Report Asset Management Financing Plan Funding Options (F-39-13) Repurposing of Hospital Levy, beginning in 2018 Dedicated infrastructure levy of 1.25% (up to 2022), reducing to 1% ( ) and further reducing to 0.5% (2034 and beyond) City Council approved an additional $20 million in funding to the roadways capital program over four years ( ) for the renewal of roadway infrastructure. For further details, see Report Asset Management Plan Update (CW-20-15) 0.2% levy beginning in 2020 to address the renewal needs of a growing asset inventory The AM Financial Strategy utilizes financial modeling to determine revenue requirements to finance the City s wide infrastructure in a sustainable manner. The model is updated on an annual basis to reflect changes in policy and strategy. An update to the Asset Management Financing Plan will be presented in a separate report in 2017, following Council s approval of the City s AMP. 94 The City of Burlington 2016 Asset Management Plan

110 Replacement Value The City is responsible for the provision of a diverse range of services to meet community needs and expectations. A significant number of these services are provided through infrastructure and other assets. The City acquires, creates, manages and maintains assets that are valued in the order of $2.9 billion. The figure below identifies replacement values by asset category. Figure Replacement Values by Asset Category ($Millions) Parks & Land Improvements, $200.3, 6.8% Fleet Vehicles & Equipment $70.6, 2.4% Information Technology Services $44.7, 1.5% Stormwater Management $66.6, 2.3% Facilities & Buildings $547.7, 18.6% Roadways, $2,013.4, 68.4% Based on the asset inventory data that was complied for each asset category, a valuation was undertaken based on 2016 replacement cost. The assets valuations are based on most recent market replacement data. If unavailable, the city s Tangible Capital Asset (TCA) system was relied upon. All replacement costs are based on a similar function and equivalent utility. For further details of how replacement values were calculated, refer to the individual asset category sections of the asset management plan. Asset values are expected to change as the city aims to strike a balance by strategically choosing between investing in what we have, building future expansions, revitalization of current assets or divesting what may no longer be required. Financial Section 95
111 Unfunded Renewal Need Unfunded renewal need is defined as the unfunded value of infrastructure renewal needs that require immediate attention as of the current year. Addressing the unfunded renewal need in a timely manner is critical to managing assets in a cost effective manner. Providing sustainable service by the way of adjusting services and service levels, rationalizing assets and increasing revenue can assist in managing the unfunded renewal need. The estimated Unfunded Renewal Need of $126.5M is as follows: Table Unfunded Renewal Need by Asset Category ($Thousands) Asset Category Buildings and Facilities $11,800 Roadways $107,975 Stormwater Management - Parks & Land Improvements $6,284 Vehicles & Equipment - Information Technology $390 Total Unfunded Renewal Need $126,449 Unfunded Renewal Need The year approved capital budget and forecast projects spending of approximately $533.3M towards the renewal of the city s infrastructure. This level of investment will minimize overall risk, prevent premature deterioration of the city s infrastructure and assist in managing the unfunded renewal need. Projections will be improved with further refinement of asset data. 96 The City of Burlington 2016 Asset Management Plan
112 Capital & Operating Historical Expenditures The following tables provide historical capital and operating expenditures for the previous five years. As reflected in Table 7.2, on average, the City has invested approximately $34 million towards existing infrastructure per year, with roadways representing the largest share of capital needs for asset renewal. Table Historical Capital Expenditures ($Thousands) Asset Category Buildings and Facilities Roadways Stormwater Management Parks & Land Improvements Vehicles & Equipment Information Technology Total Expenditure Type YEP 5-year Average Renewal $4,127 $7,982 $13,793 $10,504 $6,271 $8,535 New/Growth 8,344 5, ,003 3,272 Renewal 15,696 18,858 14,523 15,725 24,777 17,916 New/Growth 4,521 7,601 3,024 8,842 9,053 6,608 Renewal ,088 1,471 1,007 New/Growth 380 1,749 1,997 1, ,246 Renewal 734 1,858 2,248 1,921 2,899 1,932 New/Growth 6,719 7,199 3,717 1, ,893 Renewal 7,090 2,756 3,306 6,411 2,596 4,432 New/Growth 2, ,000 Renewal New/Growth , Renewal $29,024 $32,281 $35,529 $35,907 $38,462 $34,241 New/Growth $22,911 $22,900 $11,168 $14,107 $12,423 $16,702 The City s operating budget expenditures, as reflected in Table 7.3, represents the operating expenditures of each asset category and together with capital costs, provides complete life cycle costing. Operating expenditures include costs for maintenance and operation activities. Table Historical Operating Expenditures ($Thousands) Asset Category YEP 5-year Average Buildings and Facilities $13,100 $13,072 $13,807 $14,630 $14,652 $13,852 Roadways 7,554 7,641 7,666 7,995 7,852 7,741 Stormwater Management , Parks & Land Improvements 5,292 5,047 4,757 5,265 6,255 5,323 Vehicles & Equipment 10,849 11,435 12,187 12,030 11,778 11,656 Information Technology ,045 1,150 1,313 1,048 Total $38,228 $38,768 $40,934 $41,861 $42,752 $40,509 Note: 2016 Year End Projections (YEP) as of November 2016 The year-over-year increase in operating expenditures is primarily due to growth in the asset base and inflation. Financial Section 97
113 Future Renewal Need This section of the asset management plan estimates the 60-year need to deliver City services in a sustainable manner. This is the estimated amount of capital the City needs to reinvest in its existing asset inventory on an annual basis to sustain the current level of service. This analysis is based on lifecycle management strategies for various asset types and condition assessment data. For this plan, the life cycle analysis represents the investment needed to rehabilitate and replace assets; the cost of operational maintenance was not included. Operational maintenance costs will be included in future updates to the AMP as part of full life cycle cost analysis. The City s capital needs are expected to increase steadily over the 60-year time frame (see Figure 7.2). The estimated average need over a 60-year period is approximately $67.5 million which the City requires to sustain its existing inventory of assets. These needs are mainly driven by the roadways network and facilities and buildings, which together comprise over 87% of the total replacement value of the City s assets. The dollars can be roughly translated into the volume of capital work required. Figure Long Term Needs Summary Millions $120 $100 $80 60 Year Average Renewal Need, $67.5M $60 $40 $20 $0 Unfunded Now Need Unfunded Renewal Need Annual Renewal Need Average Renewal Need (60yr) (Note: Costs are in current dollars) The following table summarizes the 60-year average need by asset category. Refer to individual asset category section for details on how needs were developed. Table yr. Average Renewal Need by Asset Category ($Millions) Asset Category Facilities and Buildings $8.9 Roadways $42.7 Stormwater Management $1.2 Parks & Land Improvements $5.6 Vehicles & Equipment $6.6 Information Technology $2.4 Total Average Renewal Need $ yr. Average Renewal Need Note that the estimated need does not reflect any improvements to current asset management practices, such as optimized operational maintenance, adjustments to level of service (LOS) and use of other innovative techniques or the application of other funding sources (grants and subsidies). By optimizing approaches to maintain assets, the City could realize significant cost savings over the useful life of its infrastructure. Should unplanned revenues become available, it would be prudent to apply them towards mitigating the Unfunded Renewal Need. As further information becomes available, these financial projections will be improved. 98 The City of Burlington 2016 Asset Management Plan
114 Over the past number of years, Council has endorsed, in principle, master plans and other strategic initiatives that may increase new infrastructure in the city. Examples include possible parks and recreation initiatives stemming from the Parks Master Plans, cycling roadway infrastructure from the Transportation Plan, information technology systems resulting from the corporate IT strategy and other initiatives from the City s Strategic Plan. Currently, the above 60-year average need analysis does not include the initial and ongoing costs to construct new assets. However, any new assets will require capital contributions for future refurbishment and replacement for effective infrastructure management. Such contributions should be based on optimal lifecycle costing, risks and level of service. Risks & Assumptions Risks The AMP notes the following risks that can impact the timing and value of renewal needs. Weather Changes to LOS targets Economic conditions Legislative requirements Affordability Assumptions The following are assumptions made throughout this section when compiling data for the AMP. No inflation is added to 60-year needs analysis Land values are excluded from analysis For Roadways, Parks & Land improvements and Facilities & Buildings asset categories, the capital need was determined by decision support software. Importance of Full Life Cycle Costing Life cycle costs should include all costs that are anticipated to occur during the ownership of an asset. This includes capital, operating and maintenance and disposal expenditures. Unless these full life cycle costs are defined, it is difficult to effectively plan for complete infrastructure costs going forward. Once these expenditures are further understood, the City can utilize cost-effective management strategies by doing the right activities at the right time. The City will be able to understand both the type and timing of treatments that lead to optimal infrastructure management. It is important that the City continues to analyze projects and manage existing assets based on full and optimal life cycle costing. This will ensure that current and future infrastructure will have sufficient funds available when needed. Plans for the ongoing improvement of information quality and the planning process will be an integral part of the City s Asset Management system going forward. Financial Summary This section is intended to cover the financial basics and also meet the Ministry of Infrastructure guideline through describing Burlington s current asset management financial snapshot. As the City s asset management program proceeds, better information will become available regarding its infrastructure and needs. This improved understanding will help decision makers make the right investments in infrastructure for the right amount at the right time. Financial Section 99
115

116 Plan Improvement & Monitoring Continuous Improvement and Monitoring This section outlines the improvement and monitoring program to enhance future revisions of this plan and the associated asset management strategies and financial projections. The City is using the continuous improvement methodology approach indicated below: The benefit of this approach is to enhance the AM systems to more effectively deliver desired AM outcomes. This continuous improvement plan was generated due to gaps in data and processes that became evident during the development of this AMP. However, a more robust information gap analysis of the City s current AM capabilities and competencies will be carried out to better understand appropriate current and future AM practices. Assess AM Performance Monitor Effectiveness of Outcomes Implement the Improvement Plan Identify Improvement Actions Develop Prioritised Improvement Plan Update Frequency This plan is intended to be a living document that will be revised annually to include updates of asset data inventories (condition and cost), as well as continuous improvements tasks. A comprehensive update to the AMP will take place every five years. It should be noted that Bill 6 Infrastructure for Jobs and Prosperity Act, 2015, will initiate the development of a regulation of asset management planning for municipalities. As a result, this AMP document may be updated prior to January 2018 to ensure full compliance with this new regulation. Improvement Plan As asset management practices evolve, so will the completeness and quality of future AM plans. The following planned improvements are required in order to maintain the City s commitment to effectively manage infrastructure and support delivery of safe, reliable and quality municipal services. Plan Improvement and Monitoring 101