CITY OF OSHAWA ITMP THE CORPORATION OF THE CITY OF OSHAWA INTEGRATED TRANSPORTATION MASTER PLAN
|
|
|
- Joanna Cooper
- 5 years ago
- Views:
Transcription


1 CITY OF OSHAWA ITMP THE CORPORATION OF THE CITY OF OSHAWA INTEGRATED TRANSPORTATION MASTER PLAN DRAFT REPORT FEBRUARY 2015
2 Table of Contents 1.0 INTRODUCTION A USER S GUIDE What does the Integrated Transportation Master Plan (ITMP) do? How was the ITMP Developed? What is in the ITMP? TRANSPORTATION IN OSHAWA TODAY Current Policy Context Provincial Policy Regional Policy City Policy Physical Context Current Population, Employment and Land Use The Existing Transportation Network Behavioural Context Current Travel Patterns and Travel Demand Impacts Associated with the Current Transportation System FORECASTING APPROACH Trip Generation and Distribution Mode Split Sub-Model Assignment Sub-Model Implications of the Travel Forecasting Approach THE CURRENT TRAJECTORY Actions and Assumptions Population Transportation Networks Travel Behaviour Results Active Transportation Transit Road Network i
3 4.3 Implications Selecting a Preferred Alternative MOVING IN A MORE SUSTAINABLE DIRECTION Goals Improving Mobility Alleviating Congestion Encouraging Sustainability Uniting the Goals: Multi-modality Actions Mobility Hubs Improving Connectivity in the Downtown Active Transportation Transit Transportation Demand Management (TDM) Goods Movement Roundabouts Roads Indicators CONCLUSIONS What the ITMP Means Going Forward Short Term Action Plan List of Tables Table 1: Year 2023 Horizon Road Improvements Table 2: Year 2031 Horizon Road Improvements Table 3: Modelling Results for 2011 Existing and 2031 Alternative Scenario Conditions ii
4 List of Figures Figure 1: 2011 Population by TAZ... 7 Figure 2: 2011 Employment by TAZ... 7 Figure 3: Destination of PM Peak Period Trips... 8 Figure 4: Mode Split for PM Peak Period Trips Originating in Oshawa... 9 Figure 5: Road Improvements by Horizon Year (North Half) Figure 6: Road Improvements by Horizon Year (South Half) Technical Memoranda TM1: Policy and Planning Context TM2: Model Validation, Current and Future Conditions TM3: Transportation Demand Management and Parking TM4: Goods Movement TM5: Alternatives Generation and Assessment TM6: Public and Stakeholder Engagement TM7: Implementation and Funding Plan TM8: Monitoring Plan iii
5 1.0 INTRODUCTION A USER S GUIDE 1.1 What does the Integrated Transportation Master Plan (ITMP) do? The purpose of the ITMP is to guide the City of Oshawa with respect to transportation-related decisions in the coming years. This guidance is based on achieving a balanced, sustainable, multi-modal transportation system in the City of Oshawa - a vision that is reflected throughout this document and is confirmed through the City s Official Plan and Strategic Plan. The ITMP is informed by the performance of the current transportation system, analysis of the projected future transportation system and a review of best practices relevant to Oshawa. Drawing on these sources of information, the ITMP helps the City to more effectively anticipate future challenges and opportunities, and recommends solutions to achieve a balanced, sustainable, and integrated transportation system. The ITMP also serves to fulfil the requirements of Phases 1 and 2 of the Municipal Class Environmental Assessment (MCEA) process. Phase 1 of this process involves identifying the problems and opportunities that may require new infrastructure to be constructed. Phase 2 involves identifying a set of alternative solutions that address these problems and opportunities. A comprehensive network approach that involved public consultation was undertaken to fulfil the Phase 1 and 2 MCEA requirements. As the name of the document suggests, integration is a key theme in the ITMP, and is reflected on two levels. First, the ITMP is based on an integrated vision for transportation in the City of Oshawa. This means that different transportation modes are intended to work together seamlessly. Examples of this range from cycling infrastructure that connects with transit hubs to parking configurations that facilitate walking between nearby destinations. On a higher level, the ITMP integrates transportation with related policy areas to identify interdependencies and common goals. This approach acknowledges that transportation policy can play a role in achieving goals in other policy areas such as encouraging active transportation to achieve public health goals and that other policy areas support and are supported by transportation goals such as the symbiotic relationship between land use policies in the Official Plan and a multi-modal transportation system. The ITMP therefore breaks apart traditional silos between disciplines and departments to achieve better outcomes. 1.2 How was the ITMP Developed? The development of the ITMP began with the Terms of Reference (ToR) issued by the City of Oshawa. The ToR defined the scope and objectives of the ITMP. After taking an inventory of the existing context, the consultant team further refined the problem and opportunity statements and held a Public Information Centre (PIC) on January 29, 2014, to present information regarding the existing transportation system in the city and to gather input, direction and ideas on opportunities and challenges from the public and stakeholders at an early stage. The consultant team also prepared an online survey that was posted on the study website in order to further engage the public and seek feedback on pressing transportation issues and ideas to improve mobility in the city. The consultant team then used 1
6 the information collected in person and online to assist in the analysis of future transportation trends and the development of transportation solutions. All transportation modes are considered in the ITMP and due to the interest expressed by the City in active transportation, a separate Active Transportation Master Plan (ATMP) was developed concurrently with the ITMP. Active transportation is seen as an important mobility tool in travel demand management in Oshawa and active transportation improvements have been linked directly with planned road improvements through the concurrent development of the ATMP and ITMP. A second PIC was held on July 17, 2014, to elicit public and stakeholder feedback on the draft findings and recommendations of both the ATMP and ITMP. Two themes of the feedback received throughout the study were the desires for alternatives to automobile travel and the provision of safe active transportation facilities, which often meant facilities separated from vehicular traffic. Feedback from both the public consultation and the forecasting analysis was used to develop the ATMP, Technical Memoranda of the ITMP and ultimately this ITMP Final Report. Throughout the process, regular meetings were held between the consultant team and City staff. Details of the public and stakeholder engagement, including presentation materials used at each PIC, are provided in Technical Memorandum # What is in the ITMP? The geographic scope of the ITMP focuses on the City of Oshawa while acknowledging that developments outside the City boundary will affect transportation within the City. A 20 year time horizon was used to forecast future travel conditions to 2031, relative to the base year of This Final Report is designed to provide a synthesis of the analysis that was undertaken and to highlight the recommendations contained in the Technical Memoranda. The general structure is as follows: Section 2 outlines the context for transportation planning from the perspective of policy, physical transportation networks and travel behaviour; Section 3 explains the modeling approach used to anticipate key changes in the transportation system; Section 4 presents the current trajectories of population growth and transportation investment and presents the expected outcomes from these trajectories ; Section 5 focuses on goals and actions for achieving more sustainable outcomes than those associated with the current trajectories; and Section 6 reflects on lessons learned from the analysis in the ITMP and indicates how the ITMP can be used going forward. This section concludes with a two-year action plan of next steps for the City to begin implementing the ITMP. 2
7 The ITMP has been formatted to comply with AODA accessibility requirements and the Oshawa Accessibility Plan. Given the theme of integrating transportation with other policy areas, the Final Report has also been written to be accessible to a wide audience, enabling practitioners from other disciplines and engaged citizens to understand the ITMP and to use it meaningfully to achieve the goals contained in the ITMP and in other policy documents. The ITMP report is supported by eight technical memoranda that provide a detailed review of various components that make up the ITMP. 3
8 2.0 TRANSPORTATION IN OSHAWA TODAY This section explores the context that forms the baseline for the ITMP. The policy context is important because it sets the desired trajectory for the evolution of the transportation system in Oshawa, and outlines the role that the city plays in defining the transportation system. Key provincial, regional and local initiatives that support the desired trajectory are outlined in Section 2.1. The physical land use patterns and transportation networks that the ITMP will build on are reviewed in the next section. Since travel behaviour is a fundamental aspect of transportation, the current mobility patterns of residents are summarized in Section 2.3. The economic, environmental and social impacts of the current system are explored at the end of this chapter. Taken together, the components of this section provide a baseline which can be used to monitor the implementation of the ITMP at regular intervals in the future. 2.1 Current Policy Context A fundamental principle of transportation master plans is to develop transportation policies informed not only by transportation analysis but also by other policy areas. This means that transportation policies are designed, in part, to achieve goals that have traditionally fallen outside the realm of transportation. For example, this ITMP includes measures to foster greater physical activity through active transportation, thereby achieving a public health goal. Similarly, the ITMP acknowledges that the transportation goals included in this plan rely, in part, on measures that will need to be included in other policy documents. An example of this would be increasing the intensity of land uses in areas that are well-served by transit. Given this level of policy integration, this section outlines the most important policies that have been considered in the development of the ITMP. A comprehensive review of the current policy context is provided in Technical Memorandum # Provincial Policy The integration of transportation and land use planning is a recurring theme that can be found in many provincial policies. A central goal of integrated transportation-land use planning is to shift a greater share of travel from single occupancy auto use to active transportation and transit. The Metrolinx Big Move Regional Transportation Plan and the Province s #CycleON Cycling Strategy set goals for providing viable alternatives to auto travel. These plans are complemented by the Growth Plan for the Greater Golden Horseshoe (GGH) and the Greenbelt Plan, which set goals for intensifying land uses and protecting the natural environment in the GGH. Importantly, these four plans also outline detailed strategies which are currently being implemented to achieve these goals. The 2014 Provincial Policy Statement is consistent with these policies and reiterates the provincial government s commitment to sustainability and integrated transportation-land use planning. At a more detailed level, provincial policies also provide guidance on various aspects of design that support the strategies and goals discussed above. The Ontario Ministry of Transportation Transit-Supportive Design Guidelines provide direction on land use planning, urban design, facility design and operational procedures in order to create an environment that supports greater use of transit. Ontario Traffic Manual Book 18: Cycling Facilities 4
9 provides guidance on the design of cycling networks and facilities. In addition, the Accessibility for Ontarians with Disabilities Act outlines design requirements that make the built environment, including transit vehicles and facilities, more accessible Regional Policy Several regional level plans have been considered in the development of the ITMP. The 2005 Durham Region Transportation Master Plan (DRTMP) identifies specific projects such as road widening and transit corridor improvements in Oshawa based on a 20 year horizon. The DRTMP is complemented by the 2013 Durham Region Official Plan (DROP), which lays out a vision for how land should be used and how growth should be accommodated at the regional scale. The future land use patterns outlined in the DROP will shape the future transportation needs in Oshawa, which makes these land use patterns an important foundation for the recommendations contained in this report. Beyond the DRTMP and DROP, a number of more specific regional policies also affect the ITMP. These include the 2012 Durham Region Cycling Plan, which proposes a primary cycling network that includes several spines in Oshawa. The 2010 Durham Region Long Term Transit Strategy establishes a long term vision for transit that proposes three major transit corridors in Oshawa Simcoe Street, Taunton Road and King Street to eventually be served by Light Rail Transit (LRT). Bus Rapid Transit (BRT) is recommended as an interim higher order transit enhancement for these corridors in the Durham Region Long Term Transit Strategy. Further, the 2010 Durham Region Transportation Demand Management Plan includes a number of measures designed to provide alternatives to peak hour single occupancy vehicle travel. Where appropriate for the Oshawa context, these measures have been integrated into the recommendations of the ITMP City Policy The ITMP has also been shaped by numerous local municipal policies. The Oshawa Strategic Plan establishes five guiding principles economic prosperity, social equity, cultural vitality, environmental responsibility and accountable leadership. The City will implement these principles with financial stewardship in mind, and together with the parameters outlined in the Oshawa Financial Strategy, they help establish the key goals outlined in Section 5.1 of this ITMP. Land use in the City of Oshawa is guided by the Oshawa Official Plan (OP). The OP provides a detailed vision of future land use in the City, and identifies the land use planning instruments that are to be used to achieve that vision (such as through secondary plans, zoning by-laws and site plan control). Further guidance for land use in the downtown area can be found in the Plan 20Twenty Action Plan for Downtown Oshawa. Several plans that address very specific aspects of land use and transportation in Oshawa have also been considered in the development of the ITMP. The 2008 Airport Business Plan has been reviewed, and transportation connections to the airport will be maintained or improved in the ITMP, recognizing the important role that the airport plays in the local economy. The 1999 Cycling Network Study Report was used to inform the 2010 preliminary 5
10 draft Oshawa Walking and Cycling Master Plan, which was subsequently rolled into, updated and rebranded as the Active Transportation Master Plan (ATMP). The ATMP has been developed as a technical report concurrent with the ITMP. It also should be noted that this ITMP Final Report complies with AODA requirements and the Oshawa Accessibility Plan. 2.2 Physical Context Current Population, Employment and Land Use In 2011, the City of Oshawa had a population of 152,483 residents, as reported in the Durham Region Long Term Transit Strategy (LTTS) model. The population distribution pattern is relatively dispersed, as shown in Figure 1, with most of the Traffic Analysis Zones (TAZs) in Oshawa containing at least some residents. Employment, on the other hand, is considerably more concentrated, with the GM Assembly Plant, GM offices, Oshawa Centre shopping mall, downtown Oshawa and the University of Ontario Institute of Technology (UOIT)/ Durham College having high concentrations of employment, as shown in Figure 2. The total number of jobs in Oshawa was 64, 260 in 2011, once again as reported in the Regional LTTS model. Reciprocal patterns are shown in Schedule A of the Oshawa Official Plan. Land designated for residential purposes occupy the greatest portion of the developed area, with industrial areas located near the waterfront, north of the airport, and along the future Hwy 407 corridor. Commercial and institutional land uses constitute a much smaller portion of the developed area, and are located near downtown Oshawa and in a number of other clusters. Open space and recreation areas occupy a significant amount of land on the waterfront and along the waterways within Oshawa. Much of the developed area in Oshawa is dominated by single uses. From a transportation perspective, this may be a challenge since the separation of land uses is typically associated with longer trip lengths, especially for commuting trips. 6


11 Figure 1: 2011 Population by TAZ Figure 2: 2011 Employment by TAZ The Existing Transportation Network Oshawa has an extensive road network with 861 lane kilometres of roadway owned by the City and an additional 6,765 lane kilometres owned by the Region. Currently, approximately 16% of the total vehicle kilometres travelled is associated with congested conditions. The transit network comprises approximately 20 different Durham Region Transit bus routes, with a network length of approximately 418 route kilometres. Oshawa is also served by three regional GO stations, including Oshawa GO station which offers full day train service along the Lakeshore East corridor to Toronto in addition to GO Bus service, the Oshawa Bus Terminal and a hub at UOIT / Durham College. The active transportation network currently consists of 62.8 kilometres of routes excluding sidewalks. 2.3 Behavioural Context Current Travel Patterns and Travel Demand The behavioural context is important because it provides an indication of how Oshawa residents use the transportation system, both in terms of where they go and how they get there. Valuable information about travel behaviour patterns can be found in the Transportation Tomorrow Survey (TTS). The weekday p.m. peak period (3:30 to 6:30p.m.) was chosen for analysis as this period has the greatest traffic volumes and also because the Regional LTTS model is based on the p.m. peak hour. Figure 3 shows the number of 7

12 weekday p.m. peak period trips originating to Oshawa destined to different Greater Toronto Area (GTA) municipalities. The top five destinations are the City of Oshawa (i.e. selfcontained trips), Town of Whitby, Municipality of Clarington, City of Toronto and Town of Ajax. While the municipality of Clarington is a significant trip attractor, the dominant travel pattern features destinations that are located to the west of Oshawa. Figure 3: Destination of PM Peak Period Trips At a local scale, average trip length is an important indicator since it reflects the potential for active transportation. Approximately 59% of PM peak period trips both begin and end in Oshawa, and the length of many of these trips is well suited for active transportation. Feedback gathered from the joint ATMP / ITMP Public Information Centres also supported the notion that there is strong potential for active transportation. Many of the residents who attended the PICs stated that they did not feel safe using the facilities that are currently available for active transportation, and that they would consider travelling more frequently with active modes if improvements, such as designated active transportation (AT) facilities, could be implemented that would provide users with a greater sense of safety. With respect to how people currently travel to their destinations, Figure 4 shows the current (year 2011) modal split. While auto driver is clearly the dominant mode, 27% of trips are taken by modes other than the single-occupant vehicle. Non-single occupant vehicle trips play an important role in reducing congestion in the current transportation system, and have potential to play an even larger role in the future transportation system (see Chapter 5). The transit system, while associated with only a modest mode share of 6%, nonetheless has more than 20,000 boardings per day. 8

13 Figure 4: Mode Split for PM Peak Period Trips Originating in Oshawa 2.4 Impacts Associated with the Current Transportation System While transportation systems provide tremendous benefits to individuals and to the economy, they are also associated with a variety of negative economic, environmental and social impacts. The overview of the physical and behavioural context of the transportation system in Oshawa suggests that the current system is largely dominated by auto travel. The following discussion reviews common impacts associated with auto-dominated transportation systems. From an economic perspective, a significant impact associated with auto-dominated transportation systems arises from congestion. The current economic cost of congestion due to commuter delay in Oshawa is estimated at $50 million annually, and is projected to rise. Congestion can also have a negative impact on economic competitiveness if travel times for both passenger travel and freight movement increase significantly. On the other hand, addressing congestion by increasing roadway capacity also entails economic impacts, since increasing capacity typically requires significant financial investment. Moreover, these investments may not be effective if the capacity increase induces even greater traffic volumes, as has been observed in many cities. The greatest environmental impact associated with auto-dominated transportation systems involves air quality and the production of greenhouse gases. While car pooling and transit produce greenhouse gases, single occupancy vehicles typically produce much higher levels of greenhouse gas emissions on a passenger kilometre basis. From a social perspective, well documented impacts of auto-dominated transportation systems relate to public health and public space. While active transportation and to some extent transit are associated with greater physical activity and better overall health, reliance on auto travel has been linked to negative health outcomes. Auto-dominated transportation systems can also have negative impacts on public space, since the accommodation of high 9
14 volumes of auto traffic negatively affects the quality of the pedestrian realm and also reduces the amount of physical space available for public use including landscaping and streetscape elements. These economic, environmental and social impacts are important to consider in the ITMP, which will shape the future transportation system in the City of Oshawa. At the provincial, regional and local municipal level, government policies align to promote the development of a more multi-modal transportation system that mitigates the negative consequences described above. While the desired trajectory of the transportation system in Oshawa is clearly laid out in policies from all levels of government, the path to achieving this vision must be developed specifically for Oshawa. Drawing on local insight and detailed analysis, the ITMP outlines specific implementation strategies and goals to achieve a more balanced transportation system that mitigates negative economic, environmental and social impacts and accommodates future growth in Oshawa. 10
15 3.0 FORECASTING APPROACH The purpose of this section is to review the forecasting tools that were used in this study. These tools provide an indication of how factors such as population and employment growth and transportation investments will affect transportation system performance in the future. Understanding how these tools work provides context for the following chapter where the results of the forecasting analysis are presented. The travel forecasting approach used in the ITMP is based on the classic four-step travel demand forecasting model. An existing model, the Durham Region Long Term Transit Strategy (LTTS) model, was used to generate travel forecasts for the AM peak hour using EMME software. While the LTTS was calibrated in 2012 for a different forecasting exercise, further calibration and validation was undertaken for this analysis using 2011 Transportation Tomorrow Survey (TTS) data. From a transportation supply perspective, the current network was reviewed and compared with travel speed data from the Ontario Ministry of Transportation (MTO). Where significant discrepancies in travel speed through the network were manifest, MTO speeds were used in the route assignment sub-model. The following sub-sections describe each travel demand modeling step and review findings from the validation analysis. Further details about the forecasting approach and validation outcomes can be found in Technical Memorandum # Trip Generation and Distribution The first step in the travel demand forecasting model is trip generation. Both the number of trips originating in a particular Traffic Analysis Zone (TAZ) and the number of trips destined for a particular TAZ can be estimated based on the land use patterns that are observed in the TAZ. Trip generation rates used in the model were compared with the generation rates contained in the Institute for Transportation Engineers (ITE) Manual 9.0. Overall, the two sets of generation rates corresponded closely; the one exception was addressed by scaling the generation rates to reflect the ITE estimates. Trip distribution is the second step in the travel demand forecasting model. In this step, the volume of traffic originating at any given location is assigned to all relevant destinations proportionately based on observed trip length patterns. The result is a specific traffic volume for each origin-destination pair. The origin-destination trip volume matrix produced previously for the 2012 validation recommended using a masking matrix origin-destination specific traffic volume adjustment factors to improve the accuracy of the final model outputs. This masking matrix was reviewed and revised based on various data sources. 3.2 Mode Split Sub-Model Once trip volumes from each origin to each destination have been established, the third step of the model uses an iterative process to establish the percentage of trips that are taken with each mode. Of the four modes considered auto driver, GO Transit, local transit and active transportation the estimated mode share for auto driver and active transportation converge closely with the estimates from the TTS. The mode share for local transit is somewhat underpredicted, while the mode share for GO Transit is somewhat over-predicted. 11
16 3.3 Assignment Sub-Model The final step in the travel demand forecasting model assigns a specific route for each trip that is taken. This step predicts the traffic volume for each link in the network. These predicted volumes are then validated against observed screen line traffic volumes. Convergence between the predicted traffic volumes and observed traffic volumes is high, suggesting that the adjustments made to the model have increased its overall accuracy. In addition to several screen lines in and near Oshawa, traffic volumes are also predicted for Hwy 407, given its future expansion into Oshawa. The predicted values for Hwy 407 are reasonably accurate. Consistent with the under-prediction of local transit mode share, the predicted local transit ridership is significantly lower than observed ridership, which is an important consideration for the interpretation of forecasted transit ridership. Finally, modeled auto travel times along several corridors in Oshawa were compared with observed travel times. The results indicated a very strong correlation, and support the overall validity of the model. An important finding from the model output is that there are no current systemic constraints in the network. 3.4 Implications of the Travel Forecasting Approach The LTTS model is used as a strategic tool in the ITMP to predict future travel patterns for various long term scenarios. While the overall validity of the model appears to be reasonably strong, it is not designed to predict volumes on specific links with a high degree of precision. Rather, it provides an overall indication of the traffic volumes that are expected at a network level. 12
17 4.0 THE CURRENT TRAJECTORY This section examines where the transportation system is currently headed based on expected population growth and previously planned and budgeted transportation investments. Three separate scenarios were generated based on 2031 population and employment forecasts. These scenarios are defined as a Do Nothing option, where no transportation improvements are implemented; a scenario based on the improvements that are currently within the 10 year capital works budget; and a third scenario that includes these improvements as well as additional improvements that are contained in the 20 year capital budget. This section summaries the analysis of the 2031 alternative scenarios. Details on the process to generate and assess these alternatives are provided in Technical Memorandum #5. The purpose of modelling the current population growth and transportation investment trajectories is twofold. First, this exercise is useful to understand the level of demand that is forecasted for 2031, and how currently planned projects are able to accommodate this demand. The second purpose of this exercise is to establish a baseline which can be used to monitor implementation and effectiveness of sustainability strategies discussed in Section Actions and Assumptions The following three subsections review the main inputs used in the forecasting model to establish a baseline scenario on a 20 year time horizon (2011 to 2031). These inputs include planned actions such as transportation network investments and assumptions about population growth and travel behaviour Population The approach to modeling scenarios for the City of Oshawa considered population and employment forecasts used during the preparation of the City s Development Charges Background Study (which has a time horizon of 2024) and also those used by Durham Region in conjunction with the LTTS study (which has a time horizon of 2031 and reflects forecasts used in the Region s Growth Plan Conformity Exercise Regional Official Plan Amendment No. 128). In this regard, it is estimated that by 2031 the population of Oshawa will grow by nearly 45,000 from a 2011 population of 152,483 to a 2031 population of 196,975. Employment is expected to grow from 64,260 jobs to 89,057 jobs over the same time period. Population growth is relatively dispersed across the City of Oshawa in this scenario with significant growth occurring in the City s north end. It should be noted that while the population forecast values contained in the City s Development Charges Background Study were used as a core input in the modeling process, the modeling approach also took into account additional key factors anticipated to bring Oshawa s population forecast to approximately 197,000 by These factors are as follows: 13
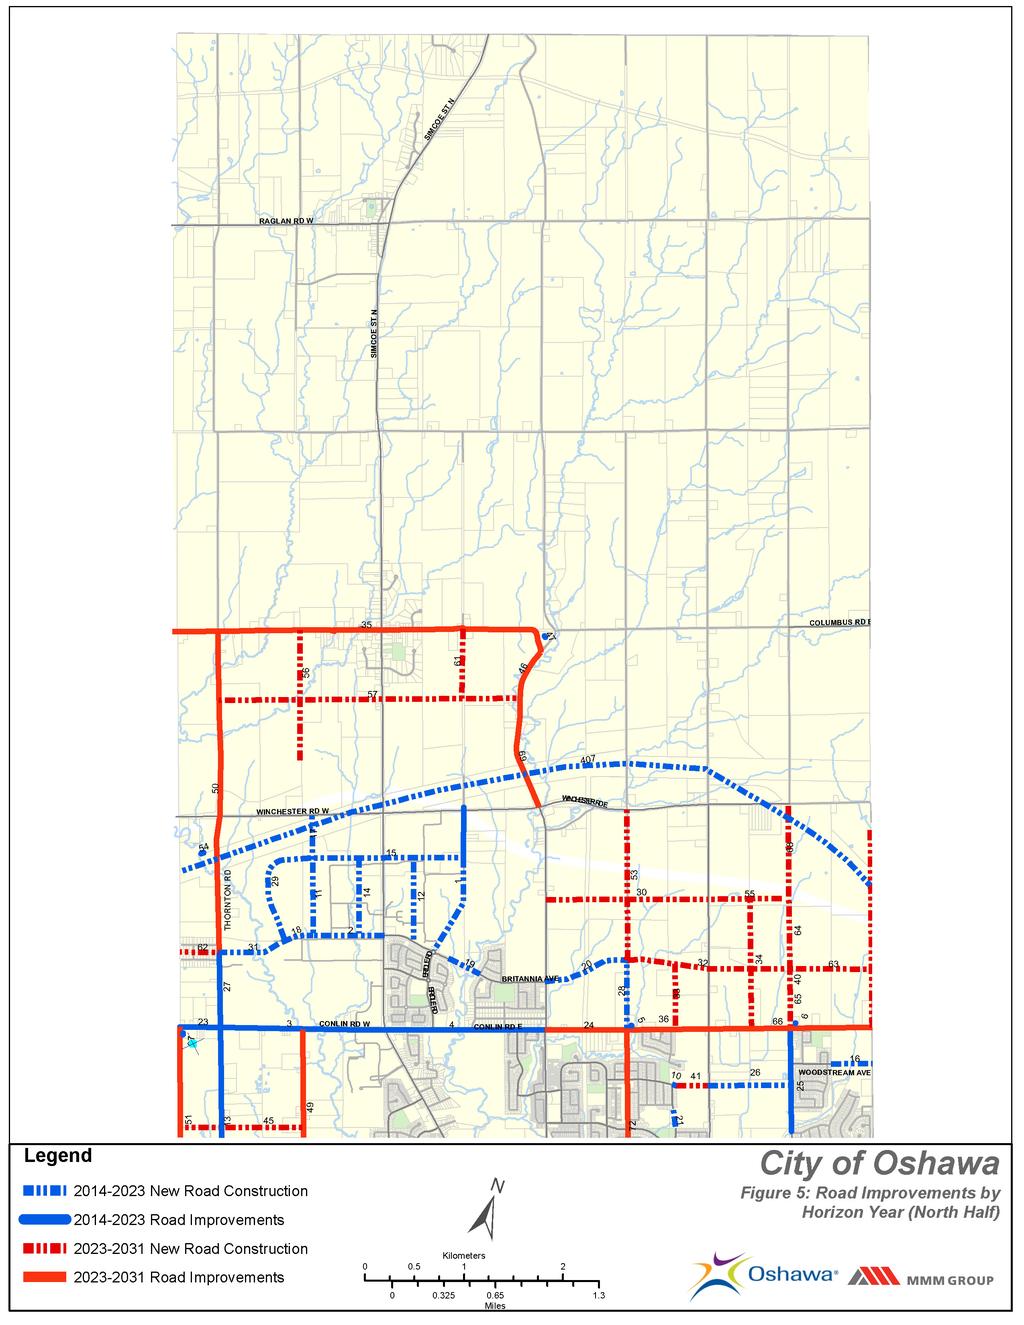
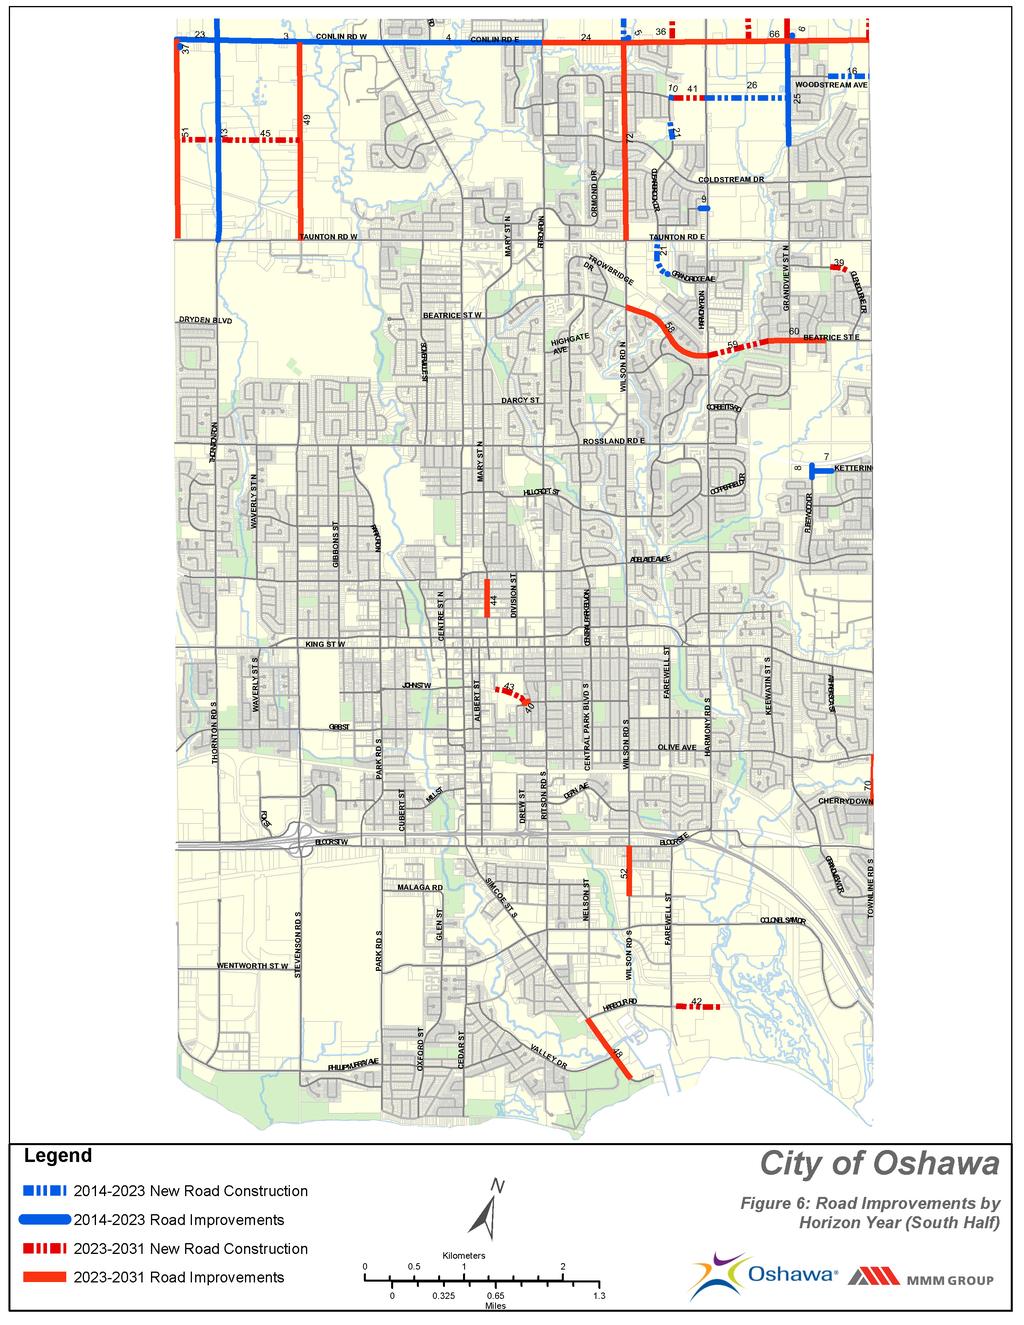
18 An adjustment for the 2011 census undercount of 4.89%; Eight years of additional growth between the 2024 time horizon for the City s Development Charges Background Study and the 2031 time horizon of the LTTS study and the Region s Growth Plan Conformity Exercise; Changing demographics and an expectation of a drop in mortality rates; Increased intensification in the Downtown Oshawa Urban Growth Centre and the future Downtown Oshawa Mobility Hub, and along arterial road corridors; and Attractive land prices relative to land prices elsewhere in the Greater Toronto Area. For the purposes of sensitivity testing, the model was run based on the population forecasts in the City s Development Charges Background Study, using the 2024 time horizon as a baseline, as well as the 2031 forecast population of approximately 197,000. The results demonstrate that even with reduced impacts arising from the various factors identified above, the need for the proposed network improvements remains unchanged. All outcomes point to a sharp increase in road usage by 2031, which may be attributed not only to the growth in population within Oshawa but also to the growth in population in adjacent municipalities Transportation Networks As described in the introduction to this Section 4, the three 2031 transportation networks that were modelled are based upon: implementing no roadway improvements; roadway improvements in the 10 year capital budget; and, roadway improvements in the 20 year capital budget respectively. The network improvements are contained in the following documents: The City of Oshawa Development Charges Background Study ( ); The various Transportation Master Plans of the area municipalities in Durham Region; The Region of Durham s Capital Work plan; GO Transit, including the extension of the Lakeshore East corridor from Oshawa to Bowmanville; and The Ontario Ministry of Transportation Highways Program, including: o Expansion of Hwy 401 by one lane in each direction through Durham Region; o Extension of Hwy 407 (tolled) to Hwy 35/115; and o East Durham Link (tolled) connecting Hwy 407 to Hwy 401. The City road improvements are shown in Figure 5 for the north half of Oshawa and Figure 6 for the south half of Oshawa, and will add 141 lane kilometres to the road network, based on the 20 year capital budget scenario. Road improvements are listed in Table 1 for the years 2014 through 2023 and Table 2 for years 2024 through Construction costs are taken from the City s 2014 Development Charges Study. The Municipal Class Environmental Assessment Schedule for each project also is listed. Generally, road projects valued at $2.3 million or less fall under Schedule B and can proceed to construction after completion of the ITMP. Schedule C projects will have further public consultation components in the future associated with subsequent phases under the Municipal Class Environmental process. 14
19 Some projects along the stretch of the same road have been divided into segments to be constructed over several years. Individual segments may be estimated to cost below the $2.3 million threshold. In these instances, the cost of the entire length of the project should be considered as one, with the relevant Schedule selected. One example of this situation in Oshawa is Conlin Road. Although divided into multiple segments, the entire package of road works for Conlin Road should be considered a Schedule C project and should proceed to subsequent phases of the Municipal Class Environment Assessment process. 15
20
21

22 Table 1: Year 2023 Horizon Road Improvements 18
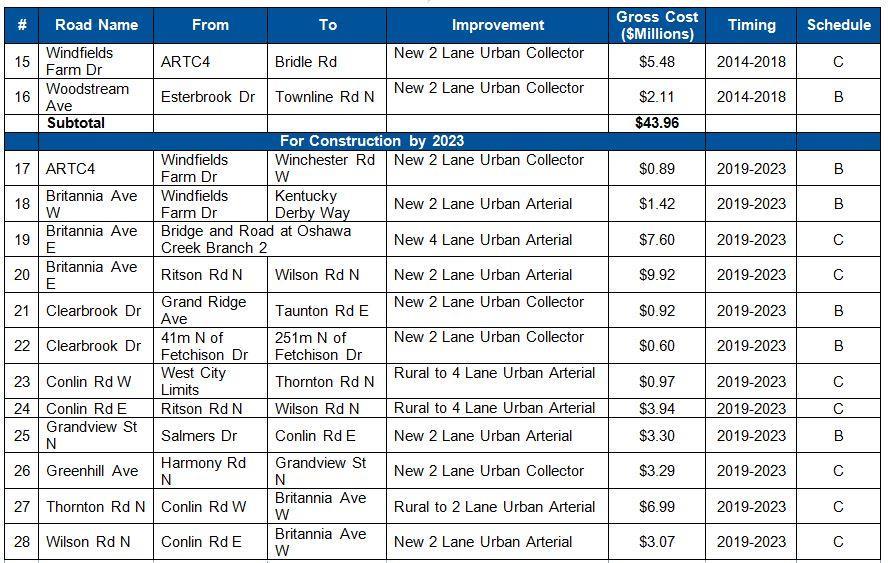
23 19

24 * A portion of Steeplechase north of Britannia has been constructed. The gross cost represents the remaining amount needed to finish construction of this road segment. 20

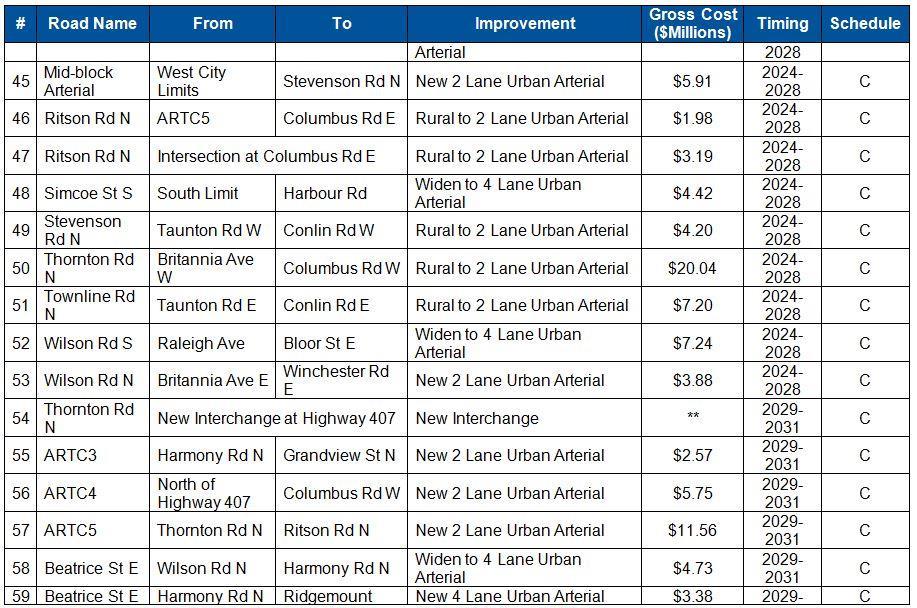
25 Table 2: Year 2031 Horizon Road Improvements 21
26 22

27 ** The interchange on Highway 407 East at Thornton Road has been deferred with no timeline or budget assigned to its construction. 23
28 4.1.3 Travel Behaviour The base case scenario assumes that travel behaviour does not fundamentally change from what was observed in The potential for changes in travel behaviour through various targeted initiatives is discussed in Section Results The LTTS model described in Section 3 was used to generate outputs that provide an indication of how the transportation system will function for the three scenarios considered. These results are explored for each transportation mode in the following subsections and are summarized in Table Active Transportation The LTTS model does not include active transportation in its mode split sub-model, and predictions for future active transportation use are therefore not available. However, selfcontainment data are available and indicate that 59% of forecast trips originating in Oshawa also would have a destination within Oshawa. This suggests that there is strong potential for increasing the active transportation mode share in all of the modelled scenarios Transit As a result of GO train expansion and other factors, the number of annual transit boardings is expected to increase by 130% to 16.9 million boardings per year in the 20 year capital budget scenario. While this constitutes a substantial increase, the mode share for transit trips does not change significantly. Transit continues to play a supportive but not dominant role in the overall transportation system Road Network The most detailed results of the forecasting exercise are generated for the road network. By 2031, auto trips have a mode share of 91.8%, reduced slightly from 93.4% in The overall amount of auto travel increases markedly, both in absolute terms (54%) and per capita (38%) in the 20 year capital budget scenario. Given the substantial increase in the total vehicle kilometres travelled (VKT), it is not surprising that congestion also increases relative to In total, 26% of VKT occur on congested links. While this represents a considerable increase in congestion relative to 2011 when only 16% of VKT occurred on congested links, it is considerably lower than the 2031 do-nothing and 10 year capital budget scenarios, where 38% and 30% of VKT are predicted to occur on congested links, respectively. 24
29 System Metrics Total lane-kilometres (kms) / 1,000 lane-kms per capita Daily Vehicle Kilometers Travelled (VKT) % of total VKT on congested links (lane-kms with volume to capacity ratio (vc) > 0.9) Daily Vehicle Hours Travelled (VHT) % of total VHT on congested links (lane-kms with vc > 0.9) 2011 Existing Conditions Alternative Do Nothing Alternative 2 10-year Capital Plan Alternative 3 20-year Capital Plan / / / ,002.5 / ,068,590 3,021,210 3,093,030 3,195,030 16% 38% 30% 26% 39,200 79,120 71,290 65,440 20% 51% 38% 32% Travel Time Index (TTI) Auto Mode Split Auto: 93.4% Auto: 91.5% Auto: 91.5% Auto: 91.8% Annual Transit Boardings (GO Transit and Durham Region 7.4 million 17.6 million 17.6 million 16.9 million Transit) Annual Cost of Congestion $50 million $245 million $166 million $125 million (Commuter Delay)* Self-Containment (percentage of trips starting and ending within Oshawa) 58.7% 59.0% 59.0% 59.0% Table 3: Modelling Results for 2011 Existing and 2031 Alternative Scenario Conditions The travel time index (TTI), which is a ratio of travel time for all network trips to the hypothetical total travel time for those trips on an uncongested network, is 1.12 in the 20 year capital budget scenario, up from 1.07 in 2011; similarly the total cost of congestion is estimated to be $125 million, a 150% increase from Relative to the Do Nothing and 10 year capital budget scenarios, however, the TTI and cost of congestion is substantially lower in the 20 year capital budget scenario. 25
30 4.3 Implications Despite significant investment, growth in the road network supply will be greatly exceeded by the growth in the road network demand in the years to come. While the investments in the 20 year capital budget scenario significantly reduce congestion relative to the 2031 do nothing and 10 year capital budget scenarios, Oshawa residents will nevertheless experience increasing levels of congestion. This situation constitutes both a challenge and an opportunity for the City of Oshawa. The challenge facing the City of Oshawa is that congestion will not be eliminated, reduced or even maintained at current levels, despite investing significant budgetary resources into roadway expansion. Experience in other cities suggests that this challenge cannot be effectively addressed through further road expansion, as this is only likely to induce further demand. In contrast, the City of Oshawa should consider strategies that allow more residents to reach their destinations using travel modes that do not add to the predicted levels of congestion on the road network. From a transportation user perspective, the forecasted transportation network conditions also present an opportunity which could be leveraged by the City of Oshawa. As congestion increases, individual transportation users will be more likely to change their travel behaviour and location preferences to avoid travel time increases. This may result in greater interest and willingness to use active transportation, public transit or carpooling. On the land use side, there may be greater demand for residential units in proximity to major employment centres, commuter stations and downtown areas. 4.4 Selecting a Preferred Alternative Given the forecast growth in population and employment, the City of Oshawa must take clear action to mitigate the forecasted increase in congestion. The 20 year capital budget scenario is the most effective scenario at mitigating the increase in congestion, and is therefore recommended as the basis for a preferred scenario. While implementing the 20 year capital budget investments is considered necessary, it is not considered sufficient to achieve the best possible outcome. Evidence from other jurisdictions suggests that more can be done to manage travel demand and provide alternatives to single occupant vehicle trips. The preferred alternative therefore includes the 20 year capital budget scenario and additional measures that are described in Section 5. 26
31 5.0 MOVING IN A MORE SUSTAINABLE DIRECTION This section describes what a more sustainable transportation system in Oshawa could look like, lays out specific recommended actions to achieve this vision and identifies indicators to track progress during implementation. 5.1 Goals Goals for how the transportation system in Oshawa will perform in the future are organized under three themes: improving mobility, alleviating congestion and encouraging sustainability. These themes are interrelated and should be considered holistically rather than each one being considered in isolation. These goals were confirmed and supported by the input received from the general public, which focused on increased mobility through alternative modes of transportation and safe active transportation facilities Improving Mobility Three network characteristics connectivity, efficiency and safety are involved in improving mobility. A transportation system with high connectivity offers multiple routes between origins and destinations for users to choose from. Moreover, connectivity also means that travel routes are direct, minimizing the travel distance necessary to move from an origin to a destination. The next aspect of mobility - efficiency - refers to the speed and ease of movement through the network. A network with minimal congestion and optimized traffic signals allows for efficient movement. Safety, the third aspect of mobility, involves the risk of collision associated with network travel. In some cases, the notion of efficiency and safety may be in tension, since efficiency favours higher travel speeds, while greater safety is typically associated with lower travel speeds. This tension underscores the importance of finding a balance that promotes reasonable efficiency without compromising safety. The safety of vulnerable road users pedestrians and cyclists is of particular concern in this regard, since they share the right-of-way with motor vehicles but are at greater risk of death and injury in collisions. The concept of mobility therefore describes a variety of network characteristics that together enable safe, direct and efficient travel Alleviating Congestion Alleviating congestion is about reducing the amount of time people spend travelling and the time it takes to move goods. Reducing travel times is important both from an economic perspective, since congestion is a key factor in economic development, and from a personal perspective, since commute length and the ability to easily reach destinations is a key quality of life factor. As with mobility, congestion is a multi-faceted concept that can be addressed in a number of ways. Specifically, congestion can be reduced by: 27
32 Reducing the distance between origins and destinations; Shifting more trips to non-single-occupancy vehicle modes; and Increasing network capacity. These approaches involve land use planning, transportation demand management and infrastructure investments, all of which are included in the ITMP Encouraging Sustainability Sustainability, as it relates to the ITMP, refers to both the long-term environmental and economic conditions of the City. Environmental sustainability relates to reducing the ecological impacts of transportation including air quality and the emission of greenhouse gases. More practically, encouraging environmental sustainability means providing residents with multiple realistic travel choices that include alternatives to the automobile. In order for non-auto modes to be realistic travel choices for a large segment of the population, the travel mode must be perceived as safe, comfortable and convenient. From an economic perspective, encouraging sustainability means coming up with mobility and congestion solutions that do not exceed the budgetary constraints of the City. This aligns well with the goal of environmental sustainability, since promoting and providing infrastructure for non-auto modes is in many cases more cost effective than providing more auto infrastructure. The thematic goals set out in the ITMP improving mobility, alleviating congestion and encouraging sustainability will make Oshawa a better place to live, work and play. Quality of life will be enhanced through cleaner air and less time spent commuting; prosperity will be fostered through greater economic competitiveness; and environmental impacts will be reduced by supporting active transportation, transit and carpooling. These goals are consistent with the broader policy context outlined in Section 2.1. The goals also reflect the input received from residents through the public consultation that was undertaken for the ITMP (see Technical Memorandum #6) Uniting the Goals: Multi-modality A common thread among the three goals outlined above is multi-modality. The concept of multi-modality is to provide transportation users with multiple viable options for travel to their destination. This does not mean that auto travel will no longer be an important mode for most residents on the contrary, auto travel will continue to play a key role in the transportation system. The fundamental principle of the ITMP is to achieve a more balanced system that encourages users to travel using the most appropriate mode for any given trip. For many shorter trips of 5 kilometres or less, active transportation may be the most appropriate mode. Trips to and from major activity centres may be best served by transit. Other trips to or from low density areas or that involve moving cargo may be better served by auto travel. The goal is to make the most appropriate mode the most desirable mode for the user. The following section outlines specific steps to make this happen. 28
33 5.2 Actions There are a number of actions that the City can take to help create a more integrated transportation network. Many of these actions meet planning directives and respond to public comments received throughout the development of the ITMP. The first action noted, Mobility Hubs, is a Provincial designation of two areas of the city. This designation supports the integration of transportation modes, which was a common theme heard from the public and stakeholders. Public feedback indicated that people are seeking viable modes of travel other than the personal automobile. The public desires more active transportation facilities and the completion of missing links in the active transportation network. The public also desires more frequent transit services. The actions presented in this section address these and other transportation planning concerns in an effort to integrate transportation modes throughout the city Mobility Hubs Metrolinx has designated two mobility hubs in the City, one in the downtown and another around the Oshawa GO Train Station. Metrolinx defines mobility hubs as places of connectivity between regional and rapid transit services, where different modes of transportation come together seamlessly. They have, or are planned to have an attractive, intensive concentration of employment, living, shopping and enjoyment around a major transit station. There are two types of mobility hubs identified in The Big Move: Anchor Hubs and Gateway Hubs. Anchor Hubs are major transit station areas associated with an urban growth centre (as defined in the Province's Growth Plan for the Greater Golden Horseshoe). Gateway Hubs are major transit station areas that are located at the interchange of two or more current or planned regional rapid transit lines. The downtown location has been designated an Anchor Hub and the GO Train Station has been designated a Gateway Hub. These two locations offer the opportunity for a truly integrated multi-modal transportation network. Metrolinx also has prepared Mobility Hub Guidelines to help to successfully plan for land use and transportation integration in the vicinity of Mobility Hubs. The City can capitalize on these Mobility Hub designations by aligning planning, zoning and City road and active transportation infrastructure to facilitate the development of these mobility hubs. The City can modify land use and zoning in these areas to encourage and benefit from the creation of transit-oriented development. The City can also work with GO Transit and Durham Region Transit to integrate transit services in these two areas. Recommendations: Based on Metrolinx s Mobility Hub Guidelines, review and update, as appropriate, City land use planning and zoning to maximize intensification of land uses and transit-oriented development around mobility hubs; Construct active transportation facilities nominated in the Active Transportation Master Plan that will help facilitate access to and around the mobility hub locations; In the downtown, review the system of one-way streets with the intention of creating twoway streets that provide better connectivity for people movement; and 29