MULTIMODAL NETWORK ANALYSIS FOR COAL FREIGHT IN KENTUCKY SESSION 6.2.3
|
|
|
- Cordelia Morrison
- 5 years ago
- Views:
Transcription
1 MULTIMODAL NETWORK ANALYSIS FOR COAL FREIGHT IN KENTUCKY SESSION John Ripy, GISP, CISSP, Senior Investigator Ted Grossardt, PhD, Research Program Manager Ben Blandford, ABD, Research Investigator Planning and Technology Team University of Kentucky Transportation Center "REVEALING A GEM" GIS-T SYMPOSIUM BOISE, IDAHO MAY 5-8, 2013


2 MULTIMODAL TRANSPORTATION & INFRASTRUCTURE CONSORTIUM MTIC is one of ten Tier I University Transportation Centers Learn more by visiting
3 RATIONALE FOR RESEARCH PROGRAM Inland Waterways are part of multi-modal freight system Existing studies focus on one mode or local events (unplanned lock closures, deliberate closures for environmental reasons) There is a need to better understand the likely spatial outcomes and impacts of shifts among the modes Kentucky and the ORB is a good place to start!
4 OTHER DIVERSION RESEARCH Focused on local impacts of single lock closure Eg. Chickamauga Lock Closure Congestion, Air Quality, Maintenance, Safety National studies: TTI, 2012 and earlier studies Global computations of all freight by each mode Theoretical Impact of Total Waterway Diversion to Rail or Truck Attempts to measure same impacts But some odd numbers
5 RELATIONSHIP BETWEEN RURAL INTERSTATE TRAFFIC AND INTERCITY TRUCK TON MILES* Nationally, about 17% trucks in traffic flow * Texas Transportation Institute: A MODAL COMPARISON OF DOMESTIC FREIGHT TRANSPORTATION EFFECTS ON THE GENERAL PUBLIC:
6 5973 Causes New Total Traffic = 5973 Vehicles per Lane Difference is All Heavy Trucks. 84% Increase 2009 US Truck Ton-Miles Added 09 WaterwayTon-Miles 4344 regular vehicles

7 PROBLEM: ~20% increase in Ton Miles from Waterways Freight should not yield 84% (or 116% in first study) increase in truck volumes. Error in statistical logic: Trucks don t cause all other traffic, merely a part of it. Second error: Additional induced traffic, if it existed, would be all vehicle types, not just trucks. Large projected increase in trucks used to calculate new truck trips, maintenance needs, etc. Widely cited and repeated
8 BUT: Ohio River terminates 2/3 of the freight it originates Is a transportation corridor, more than an export mechanism Lies parallel to major highways in KY, OH, IN Instead of nationwide, what about actual region where impact could be felt?
9 Data Request from USACE KTC Segments

10 CURRENT OHIO RIVER MOVEMENTS
11 REQUESTING DATA FROM USACE AND THE RULE OF THREE Reported totals equal about 2/3 of FAF in-and-out volumes for KY, so estimate about 1/3 of total volume contained in redacted cells. We will only use the 2/3 that is reported. Estimate / assign the diverted freight to the existing truck network. See how it would change the operational characteristics, and where it would matter most.
12 DATA SOURCES State Agencies HPMS Traffic Models KY Coal Haul Report Freight Traffic Generators MPOs USACE Navigation Data Center RITA - NTAD

13 PRIMARY HIGHWAY DIVERSION ROUTES
14 KyTC Statewide Traffic Model Percent Trucks
15 KyTC Coal Haul Report Coal ADTT
16 Increase of Coal ADTT After Diversion

17 Percent Trucks After Diversion
18 COAL HAUL REPORT 2010
19 COAL HAUL REPORT 2011

20 COAL HAUL REPORT 2012

21 WEST KENTUCKY 2010

22 WEST KENTUCKY 2011
23 WEST KENTUCKY 2012


24 FEEDBACK Barge Companies Crounse Ingram State Freight Planning Division NuRail University of Tennessee Larry Bray, Mark Burton, and Chris Dager
25 MAP-21: PERFORMANCE MANAGEMENT FREIGHT National Freight Policy National Freight Strategic Plan Established a National Freight Network Freight Conditions and Performance Reports Development of Investment data and planning tools Prioritization of Projects Increase Federal Share to 95% on interstate system, and 90% elsewhere IF project identified in State Freight Plan USDOT must certify project improves efficiency, meets target Freight Advisory Committees Encouraged but not required
26 National Freight Policy Improving condition and performance of the national freight network Measured by: Infrastructure improvements Operational improvements Safety, security, and system resiliency improvements Improving state of good repair Increasing use of advanced technology to improve safety and efficiency Improving economic efficiency Reducing environmental impacts of freight movement Incorporating concepts of performance, innovation, competition, and accountability into operation and maintenance of the national freight network
27 National Freight Strategic Plan Elements Condition and performance of national freight network Highway bottlenecks on the national freight network that create significant freight congestion problems 20-year future freight volume forecasts Major trade gateways and national freight corridors that connect major population centers, trade gateways, and other major freight generators Assessment of barriers to improving freight transportation performance Identification of routes providing access to energy exploration, development, installation, or production locations Best practices for improving performance of the national freight network Best practices to mitigate impacts of freight movement on communities Process for addressing multistate projects and encouraging jurisdictions to collaborate Strategies to improve freight intermodal connectivity
28 State Freight Plan Elements Policies, strategies, and performance measures that will guide the freightrelated transportation investment decisions of the State Articulation with national freight goals ITS for freight movement Improvements for anticipated deterioration on heavy vehicle routes (mining, agricultural, energy cargo or equipment, and timber) ID and mitigation/improvements for facilities with freight mobility issues
29 Preferred Project Types Freight intermodal connectors Freight and truck bottlenecks Public freight rail facilities Private highway-rail intermodal connectors Projects that are integrated in function, such as along a major freight corridor.
30 Projects Should: Improve the efficient movement of freight Quantitative analysis of before-and-after based on factors such as (but not limited to): Reduced travel time Improved travel time reliability Reduced congestion Improved safety Reduced costs or enhanced economic benefits for industry Help meet freight performance goals in the State Freight Plan Once the performance targets are established under 150(d), States will need to demonstrate that the project makes progress towards achieving those targets In the interim period before the targets are established, referencing the freight performance goals is acceptable
31 Schedule 2014 Apr 1 - USDOT establishes Performance Measures for States Oct 1 - USDOT develops for Congress - List identifying potential projects of National and Regional significance - Freight Conditions and Performance Report 2015 Apr 1 State DOTs establish Performance Targets Oct 1 USDOT establishes National Freight Strategic Plan 2019 Apr 1 - States Progress Reports due 2020 Oct 1 USDOT National Freight Strategic Plan Update
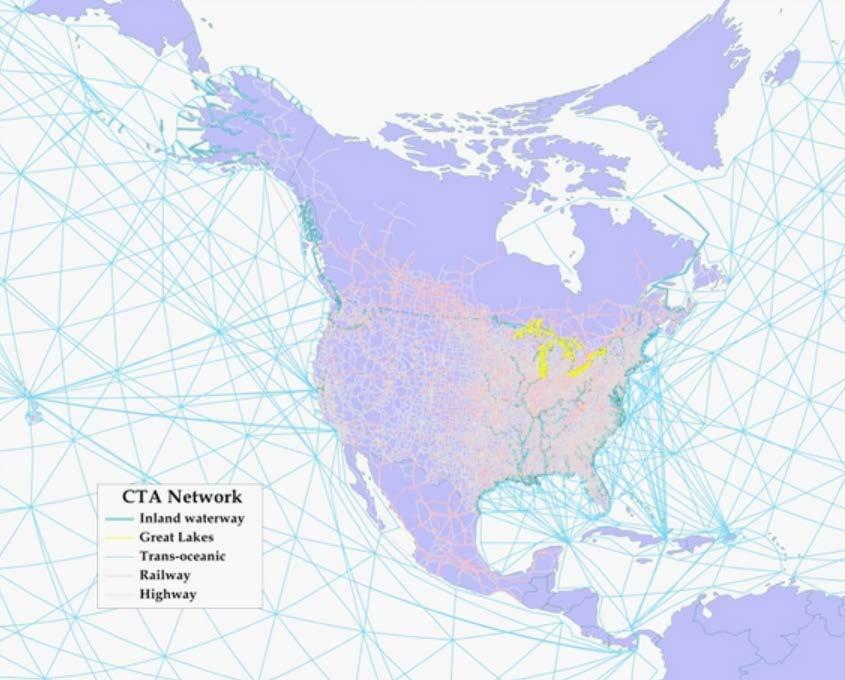
32 INTEGRATED FREIGHT NETWORK MODEL Under Development With UTC-USDOT Support Highway-Waterways-Rail-Intermodal Can Potentially Provide Useful Data for MAP-21 Examples Overall Network to Date How Modes Interlink E.I.A. Coal Movement Data Modeling Impacts of Changes in Freight Volumes on Highways
33
34 ENERGY INFORMATION ADMINISTRATION - EIA.GOV
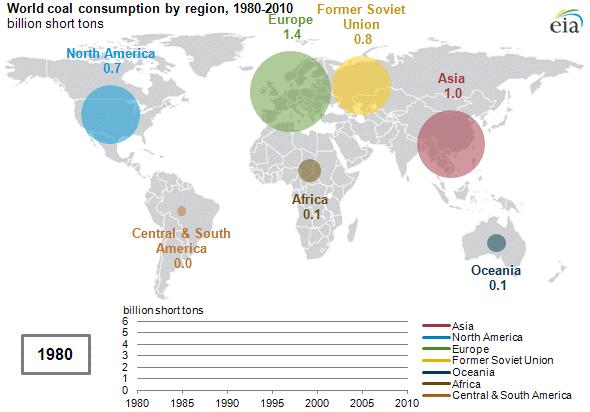
35 WHY COAL?

36 WHY COAL? Origin Destination Pairs Primary Mode Secondary Mode Volumes Freight Rates

37 Railroad Waterway Highway Coal Volume By Mode

38 Railroad Waterway Highway Coal Volume in KY By Mode

39 Origin to Destination Intermodal Routing River Port Intermodal Route
40 RAIL DATA Surface Transportation Board Waybill Sample URCS Uniform Rail Costing System RailInc.

41 PORTS SURVEY University of Louisville Josh Rivard Facility Operations Terminal Services Fleeting Services Construction / Repair Maintenance

42 WATERWAYS Create a national Waterways LRS from USGS NHD data
43 WATERWAYS Waterborne Commerce Statistics Center WCSC USACE Dredging Locks Port And Waterway Facilities Vessel Characteristics Waterborne Commerce

44 WATERWAYS WCSC Channel Portfolio Tool Ned Mitchell

45 WATERWAYS Lock Performance Management System LPMS USACE Find A Vessel Lock Queue Report Lock Status Report Tonnage Report Data Web Services River at a Glance

46 WATERWAYS Automatic Identification System AIS Unique ship identification Position Course Speed
47 MORE THAN COAL Systemic Logistics Freight Tour Modeling Simulation Analytical Spatial Price Equilibrium Jose Holguin-Veras Ecological Inference Steve Voss Hybrid Grain in the Upper Miss North Dakota State (Barge Costing Model)

48 MORE THAN ROUTING AND VOLUME FLOWS How do Shippers and Carriers behave in the face of disruption or degradation of service? Commodity Specific Demands Relationships and Existing Agreements Decision Theory and Large Group Processes
49 NAVTEQ 2010

50 NAVTEQ 2011

51 FUTURE RESEARCH Safety Implications Environmental Measures Benmap EPA The Community Edition Beta came out last month


52 FUTURE RESEARCH National Waterways Foundation BASIC FRAMEWORK The basic framework necessary to all estimations and simulations of waterway savings consists of a vector formed by a specific year s waterway (WCSC) records and a matrix that indicates shipper savings by commodity grouping and by waterway segment or combination of segments. This framework is illustrated here :

53 THANKS John Ripy