Sarasota/Manatee Metropolitan Planning Organization. Performance Targets/Project Priorities Process September 2018
|
|
|
- Dennis Bell
- 5 years ago
- Views:
Transcription
1 Sarasota/Manatee Metropolitan Planning Organization Performance Targets/Project Priorities Process September 2018


2 Performance Target Setting Timeline February November February MPO adopted Safety Targets MPO must adopt Infrastructure Condition and Reliability Targets MPO must adopt Safety Targets


3 Performance Target Setting Included Facilities PERFORMANCE TARGET National Highway System Interstate National Highway System Non-Interstate Sarasota/Manatee MPO Roadway Network Safety YES YES YES Infrastructure Condition Congestion Reliability Freight YES YES NO YES YES NO


4 Safety Performance Measures Requirements NUMBER OF FATALITIES RATE OF FATALITIES NUMBER OF SERIOUS INJURIES RATE OF SERIOUS INJURIES Targets established as a 5-yr rolling average for each measure NUMBER OF NON-MOTORIZED FATALITIES AND SERIOUS INJURIES
5 ADOPTED Safety Targets/Florida Vision Zero Sarasota/Manatee: Continue Current Trends Fatality Fatality Rate Serious Injuries Serious Injuries Rate Non-Motorized Fatalities and Serious Injuries ,
6 Data Sources: Fatality and serious injury counts were downloaded from the DHSMV FIRES portal. *Numbers are estimated based on available data through August 2018 and interpolated for 12 months. ** Numbers are estimated based on current trend. Fatalities Sarasota/Manatee Annual Fatalities and Trend Line * 2019** Fatalities Estimated 2018 Trend 2019 Trend
7 Sarasota/Manatee Annual Rate of Fatalities per 100 Million Vehicle Miles Traveled and Trend Line Rate MPO Fatality Rate Florida Fatality Rate MPO Fatality Rate Trend Florida Fataility Rate Trend Data Sources: Fatality and serious injury counts were downloaded from the DHSMV FIRES portal and Signal4 Analytics. - Figures used were current as of August VMT estimate is published by the FDOT Office of Transportation Data and Analytics on an annual basis,
8 Sarasota/Manatee Annual Serious Injuries and Trend Line Serious Injuries 2,000 1,800 1,600 1,400 1,200 1, ,395 1,858 1,514 1,879 2,050 1,235 1, Fatalities Estimated 2018 Trend 2019 Trend Data Sources: Fatality and serious injury counts were downloaded from the DHSMV FIRES portal. - Figures used were current as of August *Numbers are estimated based on available data through August 2018 and interpolated for 12 months. ** Numbers are estimated based on current trend.
9 Sarasota/Manatee Annual Rate of Serious Injuries per 100 Million Vehicle Miles Traveled and Trend Line Rate MPO Serious Injury Rate MPO Serious Injury Rate Trend Florida Serious Injury Rate Florida Serious Injury Rate Trend Data Sources: Fatality and serious injury counts were downloaded from the DHSMV FIRES portal and Signal4 Analytics. - Figures used were current as of August VMT estimate is published by the FDOT Office of Transportation Data and Analytics on an annual basis,
10 Sarasota/Manatee Annual Non-Motorized Fatalities and Serious Injuries and Historic Trend ( ) Number of Fatalities\Serious Injuries Fatalities Estimated 2018 Trend 2019 Trend Data Sources: Fatality and serious injury counts were downloaded from the DHSMV FIRES portal. - Figures used were current as of November 14, *Numbers are estimated based on available data through August 2018 and interpolated for 12 months. ** Numbers are estimated based on current trend.
11 Sarasota/Manatee Top Crash Types and Primary Mitigation Strategies Crash Types Work Zones 1 Primary Mitigation Strategy Engineering Education Enforcement Aging Road Users (Drivers 65+) 2 1 Bicyclist/Pedestrian Teen Drivers 1 2 Crash types are based on FDOT s FY2019 Highway Safety Matrix. The Matrix is based on total actual serious injuries and fatalities during
12 ADOPTED Safety Targets/Projected 2018 Actual Sarasota/Manatee: Continue Current Trends Fatality Fatality Rate Serious Injuries Serious Injuries Rate Non-Motorized Fatalities and Serious Injuries , , Current numbers and rates are estimated based on available data through August 2018 and interpolated for 12 months

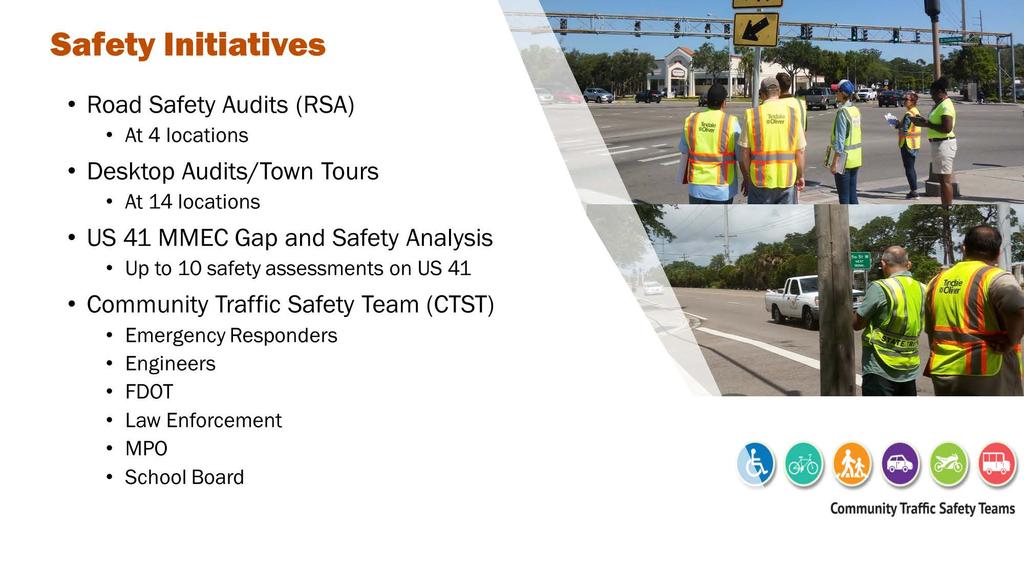
13 Safety Initiatives
14 FDOT Vision Zero What would it take? Annual reduction from of: Performance Measure Annual Crashes * 4 fatalities 47 serious injuries 7 non-motorized fatalities and serious injuries Number of Fatalities Fatality Rate Number of Serious Injuries 1, Serious Injury Rate Non-Motorized Fatalities and Serious Injuries
15 RECOMMENDATION Support FDOT statewide safety performance targets for Vision Zero as a long-term goal Adopt proposed MPO safety targets for the Sarasota/Manatee region Safety Performance Measures/Targets Florida 5-year Targets 1/1/14 to 12/31/18 FDOT Projected year Rolling Average Sarasota/ Manatee Adopted 5-year Targets 1/1/14 to 12/31/18* Sarasota/ Manatee Projected year Rolling Average** Sarasota/ Manatee PROPOSED 5-year Targets 1/1/15 to 12/31/19 Number of Fatalities 0 3, Number of Serious Injuries 0 20,861 1, Non-Motorized Fatalities and Serious Injuries 0 3, Fatality Rate Serious Injury Rate * Numbers are estimated based on current trend. **Numbers are estimated based on available data through August 2018 and interpolated for 12 months.

16 Infrastructure Condition Performance Measures INTERSTATE PAVEMENT IN GOOD/POOR CONDITION NON-INTERSTATE PAVEMENT IN GOOD/POOR CONDITION PERCENT BRIDGES IN GOOD CONDITION Targets established for 2-yr and 4-yr cycles PERCENT BRIDGES IN POOR CONDITION
17 Comparison of Florida and Sarasota/Manatee Existing Pavement Condition Florida Interstate NHS 1% 33% 66% Sarasota/Manatee Interstate NHS 100% Florida Non-Interstate NHS 1% 54% 45% Sarasota/Manatee Non-Interstate NHS 2% 15% 83% 0% 10% 20% 30% 40% 50% 60% 70% 80% 90% 100% Poor Fair Good
18 Sarasota/Manatee Priority Bridges Manatee County Bridges 2018 AADT 2018 Condition Year Built Year Reconstruct TIP $/Year Desoto Bridge 64,500 Fair 1957 PDE/ th St W at Cedar Hammock Canal 17,000 Fair 1963 SR 684/Cortez Bridge 15,100 Poor 1956 ROW/2021 SR 64/Anna Maria Bridge 14,800 Fair 1957 CST/ st St W at Cedar Hammock Canal 10,600 Fair 1963 SR 789 Longboat Key Pass 8,300 Fair 1957 Maintenance/2019 Sarasota County Bridges 2018 AADT 2018 Condition Year Built Year Reconstruct US 41 at Hudson Bayou 53,000 Fair US 41 at North Creek 41,500 Fair TIP $/Year US 41 at Catfish Creek 41,500 Fair CST/2018 US 41 at South Creek 39,500 Fair Coon Key Waterway 34,000 Fair 1958 PDE/2020
19 RECOMMENDATION Support FDOT statewide system performance targets for Infrastructure Condition Adopt proposed Sarasota/Manatee MPO bridge priorities Infrastructure Condition Performance Measures/Targets Florida 2-year Targets 1/1/2018 to 12/31/2019 Florida 4-year Targets 1/1/2018 to 12/31/2021 Florida Current Conditions Sarasota/ Manatee Current Conditions Percent of Interstate pavements in good condition Not required > 60% 66% 100% Percent of Interstate pavements in poor condition Not required <5% <1% 0% Percent of non-interstate NHS pavements in good condition Percent of non-interstate NHS pavements in poor condition >40% >40% 45% 83% <5% <5% <1% 2% Percent of NHS bridges by deck area in good condition >50% >50% 72% 73% Percent of NHS bridges by deck area in poor condition <10% <10% 1% <1%

 INTERSTATE LEVEL")

")
20 Mobility Performance Measure Requirements LEVEL OF TRAVEL TIME RELIABILITY (LOTTR) INTERSTATE LEVEL OF TRAVEL TIME RELIABILITY (LOTTR) NON-INTERSTATE NATIONAL HIGHWAY SYSTEM TRUCK TRAVEL TIME RELIABILITY (TTTR) INTERSTATE
21 Reliability Measures LOTTR Interstate Travel Time Reliability Measure: Percent of person-miles traveled on the Interstate that are reliable Non-Interstate Travel Time Reliability Measure: Percent of personmiles traveled on the non-interstate NHS that are reliable 80 th % travel time / 50 th percent travel time Four time periods: AM Peak, Midday, PM Peak, Weekend Above 1.50 is unreliable TTTR Freight Reliability Measure: The sum of maximum TTTR for each segment, divided by total Interstate miles 95 th % travel time / 50 th percent travel time Five time periods: AM Peak, Midday, PM Peak, Overnight, Weekend
 is a")
22 Level of Travel Time Reliability (LOTTR) is a PERCENTAGE %
 is an")
23 Truck Travel Time Reliability (TTTR) is an INDEX #
24 Level of Travel Time Reliability (LOTTR) Interstate Measure Comparison Reliable Person- Miles Traveled Florida 88% 86% 85% 82% 80% 79% 77% 76% MPO 100% 97% 93% 92% 89% 86% 83% 80% Percentages based on data Percentages based on projections FDOT 2022 target: 70% Statewide least conservative 2021 projection is 78.5%
25 Level of Travel Time Reliability (LOTTR) Non-Interstate NHS Comparison Reliable Person- Miles Traveled Florida 63% 59% 57% 86% 84% 80% 77% 74% MPO 76% 71% 60% 91% 84% 79% 74% 70% Percentages based on data Percentages based on projections FDOT 2022 target: 50% Statewide most conservative 2021 projection is 70.0%
26 Truck Travel Time Reliability (TTTR) Comparison TTTR Index Florida MPO Percentages based on data Percentages based on projections FDOT 2022 target: 2.00 Statewide most conservative 2021 projection is 1.73
27 RECOMMENDATION Support FDOT statewide system performance targets for Reliability and Freight System Performance/ Congestion and Freight Performance Measures/Targets Florida 2-year Targets 1/1/2018 to 12/31/2019 Florida 4-year Targets 1/1/2018 to 12/31/2021 Florida Current Conditions 2017 Florida Projected Conditions 2021 Sarasota/ Manatee Current Conditions 2017 Sarasota/ Manatee Projected Conditions 2021 Percent of person-miles on the Interstate system that are reliable (Interstate LOTTR) Percent of person-miles on the non- Interstate NHS that are reliable (Non- Interstate NHS LOTTR) Truck travel time reliability (TTTR) 75% 70% 82% 76% 92% 80% Not Required 50% 84% 74% 91% 70%
28 RECOMMENDATIONS SAFETY Support FDOT statewide safety performance targets for Vision Zero as a long-term goal Adopt proposed MPO safety targets for the Sarasota/Manatee region INFRASTRUCTURE CONDITION Support FDOT statewide system performance targets for Infrastructure Condition Adopt proposed Sarasota/Manatee MPO bridge priorities MOBILITY/CONGESTION/RELIABILITY and FREIGHT/ECONOMY Support FDOT statewide system performance targets for Reliability and Freight TIP AMENDMENT Adopt the required performance targets amendment to the Transportation Improvement Program (TIP)