United Nations Trade Statistics Perspective. United Nations Statistics Division Trade Statistics Branch
|
|
|
- Meredith Cummings
- 5 years ago
- Views:
Transcription
1 United Nations Trade Statistics Perspective United Nations Statistics Division Trade Statistics Branch
2 UN Trade Statistics Perspective: Outline UN Comtrade scope The Harmonized System Quantity Data Bilateral Trade Asymmetries Harmonization with Production Data Linking Trade Statistics to Business Registers 2 2

3 UN Comtrade Overview Official trade statistics of almost 200 countries/areas Most comprehensive trade database with more than 1 billion records Annual trade in goods since 1962, monthly data since 2010 Annual trade in services since
4 Scope of UN Comtrade All goods which add to or subtract from the stock of material resources of a country by entering or leaving its economic territory (regardless of change of ownership) Data source mainly Customs administrations Countries should estimate trade below customs thresholds Some important exclusions: Goods simply being transported through a country Goods temporarily admitted or dispatched (in the same state) Monetary gold Goods under merchanting Excluded but should be recorded separately: Goods for repair or maintenance Goods entering or leaving a country illegally Waste and scrap having no commercial value 4 4
5 The Harmonised System The Harmonised System (HS) is a goods nomenclature developed by the World Customs Organization (WCO) to facilitate international trade and data collection & comparability Very detailed - 5,200 products Revised every 5 years. Currently six versions of HS: 1992, 1996, 2002, 2007, 2012, 2017 Data first reported in HS 1992 in 1988 HS2017 (version 6) went into force January
6 Tariff Line Data Each country is free to use its own more detailed definitions according to their individual requirements, expressed in 8- or 10-digit codes Example from the USA s Tariff Line nomenclature: 6

7 Correlations and conversions available UNSD maintains matrix of correlations and conversions UNSD is currently reviewing HS2017 conversion tables Countries and users are welcome to establish their own conversion tables, taking into account national circumstances 7
8 Quantity UN Comtrade includes net weight and, when available, supplementary quantity Quantity units based on recommendations from World Customs Organization Non-standard quantities are converted using specific conversion factors UN Comtrade estimates missing quantity when possible using (partially) reported data in the same commodity flow, either based on reporter s historical unit value or standard unit value Use caution with certain products showing high weights (e.g., cleaned vs. uncleaned ore) 8 8

9 Main reasons for bilateral asymmetries 9 9
10 Value: FOB and CIF a) Exports valued at FOB include the value of the goods plus services to deliver goods to the border of the exporting country b) Imports valued at FOB include the value of the goods plus services to the border of the exporting country s statistical territory c) Imports valued at CIF include the value of the goods plus insurance services and freight services from the country of export to the country of import How to reconcile asymmetries caused by Imports CIF versus Exports FOB? Compile FOB for imports, as recommended by IMTS2010 Compilation of Imports FOB can be done (1) via direct reporting of insurance and freight on Customs declarations or (2) via estimation on the basis of surveys of importers or econometric (gravity) models, taking account of kind of goods (e.g. need for refrigeration), distance to partner country, and mode of transport 10 10
11 Partner country attribution Country of origin at imports and country of final destination at exports are often not symmetrically recorded Country of origin is the country where the last substantial transformation of the good took place. The importing country knows the country of origin. Country of final destination in practice is the next country, where goods will be cleared. The exporting country does not know with certainty where the goods will end up. The country of final destination may coincide with the country of origin, but with a fragmented production process, this may be rather the exception than the rule. This means that the use of country of origin at imports leads to bilateral asymmetries in merchandise trade statistics 11 11

12 Bilateral Asymmetries What if true country of last known destination is unknown at time of export? 12 12
13 Country of Origin and Last Known Destination *NEW RECOMMENDATION* For IMPORTS, record the country of origin And record the country of consignment as the second partner country attribution For EXPORTS record the country of last known destination And the additional compilation of the country of consignment is encouraged 13 13
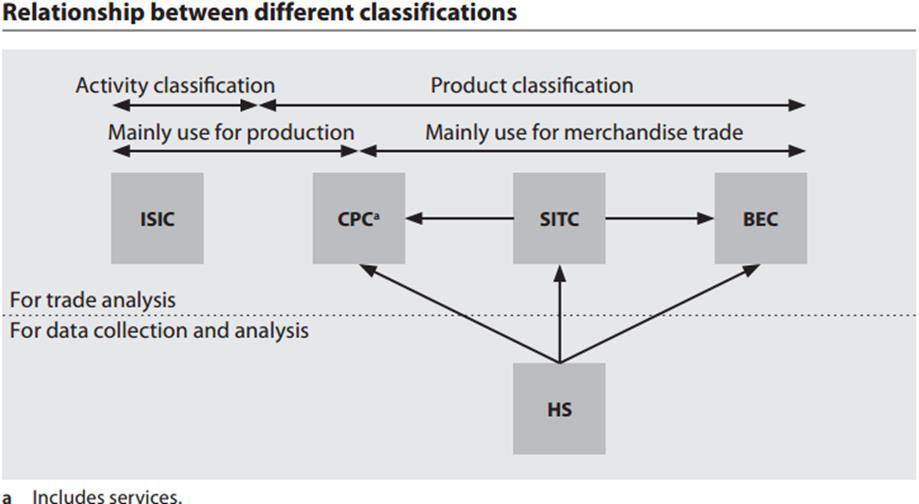
14 Other Classifications 14
15 Product Classification - CPC CPC - Central Product Classification Covers both goods and services Uses detailed subheadings of HS as building blocks 10 sections; 71 divisions; 324 groups; 1,267 classes and 2,738 subclasses (compared to 5,200 6-digits in HS) Correspondence tables Correspondence tables between CPC and HS: *CAUTION* The basic CPC classes are often still baskets with potentially different products. 15
16 Activity / Industry Classification - ISIC ISIC - International Standard Industrial Classification of All Economic Activities ISIC is by productive activity Has 21 sections, 88 divisions, 238 groups and 419 classes A detailed correspondence table between HS, SITC, CPC and ISIC, available here: Caution: The correspondence table cannot account for issues of secondary production and the same goods or services may be produced using different methods of production. Some products can be the output of several ISIC industries. Identifying the activity of the trader and performing appropriate aggregation should be given preference whenever possible. 16
17 Classification by Broad Economic Categories BEC - Classification by Broad Economic Categories Includes stages of production (primary and processed) Only 6 main categories (food, industrial supplies, fuels, capital goods, etc.) Correspondence tables available for BEC with SITC Rev. 3 & HS In 2016, a new revision of BEC (rev. 5) Incorporates services and more main categories And end-use categories: 1. intermediate goods 2. gross fixed capital consumption 3. final consumption (of goods and services) UNSD is currently looking at classifying Intermediate Goods and Final Consumption to individual HS commodities 17

18 BEC Rev. 5 18
19 Production data: an overview Production data is collected on surveys The firm is classified according to ISIC (or NACE in EU) The products are classified according to CPC (or CPA in EU) For national supply-use tables, in the activity columns, all economic activities conducted by each institutional sector are shown in activity columns, based on ISIC. The rows are identified by the commodity classification codes, which should be based on CPC
20 Harmonization Between Trade & Production Data UNSD maintains correlation tables between HS and CPC and between HS and ISIC. However, the links between HS and CPC and ISIC are imperfect. In some cases it is not possible for customs authorities to make a distinction concerning industrial origin on the basis of the physical properties of a good In other cases the historical and legal distinctions of customs requirements take precedence over the criterion of industrial origin The CPC has approximately 2,600 subclasses and HS has 5,300 commodities UNSD prefers to link trade to production data by linking the business register to trade statistics at the firm level, where more detailed HS codes can be linked via the firm s ISIC code and to CPC. 20
21 Linking trade statistics to business registers Trade value of each trader, by product code and partner country, is linked to main enterprise characteristics (economic activity and number of employees) from the business register 21 21
22 Linking trade statistics to business registers In 2015 UNSD survey: 46% of all respondents currently linking trade statistics 81% of OECD countries 30% of non-oecd countries Eurostat already publishes detailed TEC data, by economic activity (NACE) and by product (Statistical Classification of Products by Activity in the European Economic Community (CPA)), and by enterprise size UNSD has very good contact with official trade data providers and is providing training to countries UNSD also working with Eurostat on a Global Enterprise Group Register 22 22

23 Linked production, trade & enterprise data 23 23