Louisiana Department of Transportation and Development Federal NHS Transportation Asset Management Plan
|
|
|
- Bennett Smith
- 5 years ago
- Views:
Transcription
1
2
3 Louisiana Department of Transportation and Development 2018 Federal NHS Transportation Asset Management Plan 1
4 2
5 3 Table of Contents Table of Contents... 3 List of Tables... 7 List of Figures Introduction Map-21 Requirements Federal Legislation & Performance Requirements Mandated Management Systems Mandated Pavement Data Quality Management Program Guiding Principles of LADOTD s Asset Management Program TAMP Requirements TAMP Oversight and Management Initial Scope of the TAMP TAMP Structure Asset Management Structure, Plans, and Tools Asset Management Business Structure TAM Relationship to Other Business Plans Existing Business Plans Interaction of TAMP and Other Plans TAM Tools Asset Inventory and Condition Measures Introduction Federal Requirement Budget and Analysis Categories (Asset Classes) System Travel Demand Summary of Travel Demand Analysis Conclusions Urban Rural Travel Demand Trends Overall Travel Demand Trend Conclusions Travel Demand by Pavement Category (Asset Sub-Group) Asset Sub-Group Demand Conclusions Pavement System Summary State Maintained Pavement Inventory Pavement Treatment Age Federal Network Level Assessment vs PMS Project Level Assessment Federal Network Level Assessment Pavement Condition Data Missing Historical Federal Data Pavement Data Collection Cycle Local NHS Pavement Information and Assumptions PMS Pavement Condition Data Collection Ongoing Regional Highway System Inventory Reduction
6 3.7 Bridge System Summary State Maintained Bridge Inventory Age of Bridges Bridge Condition Data Bridge Condition Data Collection Bridge Performance Measures Addressing Large Outlier Bridges Performance and GAP Analysis Introduction Desired State of Good Repair (DSGR) Federal Target Setting Guidance Method for Setting Performance Targets Pavement Performance Penalty Pavement Gap Analysis Pavement GAP Methodology Interstate Pavement Performance Assessment Historical IRI Interstate Pavement Performance Current Interstate Pavement Performance Forecast of Current Interstate Funding Scenario Interstate Desired State of Good Repair Federal Pavement Performance Targets Federal Interstate Pavement Targets Interstate Pavement Gap Analysis Interstate Pavement GAP Analysis Non- Interstate NHS Pavement Performance Assessment Historical Non-Interstate NHS Pavement Performance Current Non-Interstate NHS Pavement Performance Forecast of Current Non-Interstate NHS Funding Scenario Desired State of Good Repair Non-Interstate NHS Scenario Federal Pavement Performance Targets Non-Interstate NHS Pavement Targets Non-Interstate NHS Pavement Gap Analysis Non-Interstate NHS Pavement GAP Analysis Bridge Performance Penalty NHS Bridge Performance Assessment Historical NHS Bridge Performance Current NHS Bridge Performance Forecast of Current NHS Bridge Funding Scenario NHS Bridges Desired State of Good Repair Federal NHS Bridge Performance Targets Federal NHS Bridge Targets NHS Bridge Gap Analysis Life Cycle Planning
7 5 5.1 Introduction Life Cycle Planning Concept Consequences of Delayed Pavement Preservation Treatments Actual Consequences of Delayed Bridge Preservation Consequences of Delayed Preservation on Maintenance Costs Life Cycle Planning Methodology Pavement Life Cycle Planning Life Cycle Planning Analysis Pavement Management Treatment Selection Process Pavement Condition Deterioration Modeling Pavement Treatments (Work Types) Pavement LCP Strategies Bridge Life Cycle Planning Bridge Modeling Approach Bridge Condition Deterioration Modeling Bridge Treatments (Work Types) Bridge LCP Strategies Bridge Project Selection Process Risk Management Analysis Introduction Existing Risk Management at LADOTD Risk Management Analysis Requirements Levels of Risk Management Risk Methodology Initial Risk Assessment Updated Risk Assessment Top-Rated Risks Risk Registers Risk Mitigation and Monitoring Plan Facilities in the State Repeatedly Damaged By Emergency Events Part 667 Methodology Three R s - Redundancy, Robustness, Resiliency Three R s R Practices Role of Risk Management in the Asset Management Process Future Risk Register Updates Financial Plan and Asset Valuation Introduction Financial Plan Development Financial Plan Methodology Overall Financial Resources
8 7.4 Overall Budget Allocation Process Historical Funding Levels Projected Funding Levels Asset Valuation GASB Asset Valuation Method Pavement Asset Valuation Bridge Asset Valuation Investment Strategies Introduction Investment Strategy Requirements Overall Investment Strategies Funding Strategies Project Strategies Risk Management Strategies Data Improvement Strategies Policy Strategies Investment Strategy Development Process Asset Management Enhancements Asset Management Organizational Enhancements TAMP Maturity Analysis Additional Planned Enhancements Cross-Asset Resource Allocation Analysis Bridge Management System Update Maintenance Management System Update Additional Asset Classes Asset Data Collection and Inspection Enhancements Expand Risk Assessment of Structures Policy and Procedural Support Communication Plan TAMP Update Process Appendices Terms & Definitions LADOTD Revenue and Budget Allocation Descriptions... 3 Revenue... 3 Expenditures LADOTD Transportation Trust Fund Distribution LADOTD Pavement System Treatments... 6 Summary of Treatments (Work Types)... 6 Additional Explanation of Treatments (Work Types) Including Non-PMS Activities LADOTD 10 Year Pavement & Bridge Projected Budget LADOTD State FY Budget Partition
9 List of Tables Table 3.1 State Asset Inventory Table 3.2 Changes in Average Pavement Treatment Age Table Bridge Count By Asset Class Table 4.1 Current Interstate Pavement Conditions Table 4.2 Interstate Pavement GAP Analysis Table 4.3 Current Non-Interstate NHS Pavement Conditions Table 4.4 Non-Interstate NHS Pavement GAP Analysis Table 4.5 Local NHS Bridge Historical Percentage of Good, Fair and Poor Table 4.6 Percent Good Fair and Poor Table 4.7 NHS Bridge GAP Analysis Table 5.1 Average In-House Pavement Surface Maintenance Costs Table 5.2 Asphalt Pavement Treatment Costs (Work Types) and Treatment Type Descriptions Table 5.3 Composite Pavement Treatment Costs (Work Types) and Treatment Type Descriptions Table 5.4 Jointed Concrete Pavement Treatment Costs (Work Types) and Treatment Type Descriptions Table 5.5 Continuously Reinforced Concrete Pavement Treatment Costs (Work Types) and Treatment Type Descriptions Table 5.6 Small Sample of PONTIS Action and Cost Table Table 6.1 Departmental Level Risk Register Table 6.2 Program Level Risk Register Table 6.3 Project Level Risk Register Table 6.4 Departmental Level Risk Mitigation & Monitoring Plan Table 6.5 Program Level Risk Mitigation & Monitoring Plan Table 6.6 Project Level Risk Mitigation & Monitoring Plan Table 7.1 Relevant Historical TAMP Budget Recap Table Year Preservation Budget Projections Table 7.3 Interstate Asset Valuation Table 7.4 Non-Interstate NHS Asset Valuation Table 7.5 NHS Bridge Asset Valuation List of Figures Figure 2.1 LADOTD Asset Management Organization Chart Figure 2.2 Asset Management Support Structure Figure 2.3 Interrelationship Between TAMP and other DOT Plans Figure 3.1 VMT Urban & Rural Trends Figure 3.2 Percent VMT for State Maintained System Figure 3.3 Percent Federal Analysis Lane-Miles by Asset Class
10 Figure 3.4 Percent PMS Analysis Lane-Miles by Asset Class Figure 3.5 Interstate PMS Lane Mileage By Asset Sub-Group Figure 3.6 Non-Interstate NHS PMS Lane Mileage By Asset Sub-Group Figure 3.7 SHS PMS Lane Mileage By Asset Sub-Group Figure 3.8 RHS PMS Lane Mileage By Asset Sub-Group Figure 3.9 Number of State Owned Bridges Built By Decade Figure 4.1 NHS Performance Target Recommendations Figure 4.2 Historical Interstate Pavement Conditions Figure 4.3 Forecasted Interstate Pavement Conditions for Projected Funding Figure 4.4 Historical Non-Interstate NHS Pavement Conditions Figure 4.5 Forecasted Non-Interstate NHS Pavement Conditions for Projected Funding Figure 4.6 Historical Percentage of Good, Fair and Poor Figure 4.7 SD Condition for Historical & Forecasted NHS Bridge Figure 5.1 Life Cycle Cost and Preservation Intervals Figure 5.2 Proactive Preservation vs. No Preservation Figure 5.3 Preservation/Rehabilitation/Replacement Program (PPR) Components Figure 5.4 Example Bridge Deterioration Curves Figure 6.1 Levels of Risk Figure 6.2 Risk Matrix Figure 7.1 LADOTD SFY Funding Sources (millions) Figure 7.2 LADOTD SFY Funding Uses (millions) Figure 7.3 Projected Budget Partition Percentages

11 1.0 Introduction Asset Management principles have been discussed worldwide by transportation agencies since the late 1990 s. One of the earliest and still one of the most relevant definitions of Asset Management was provided by The American Public Works Association Asset Management Task Force in 1998 as, a methodology needed by those who are responsible for efficiently allocating generally insufficient funds amongst valid and competing needs. 1 With LADOTD s projected funding availability, this definition certainly still holds true. Federal Legislation The 1956 Eisenhower Interstate System (Federal-Aid Highway Act of 1956) and the German Autobahn have both proven that world class transportation systems foster economic growth, international and domestic commerce, and tourism. Congressional leaders understand that these world class systems cannot be allowed to fall out of a State of Good Repair, so in 1991 it began to take a series of progressive legislative steps designed to facilitate the ongoing transformation of policy, planning and asset management necessary to improve the accountability required to sustain the immensely valuable National Highway System (NHS). Focused Intent on Preservation Preservation First Strategy. With the introduction of MAP-21, there is a focused intent to eliminate the historical Worst First practice of asset replacement with a strategy of Preservation First for all Interstate and NHS road and bridge assets. Like most states, Louisiana has historically leaned toward the Worst First approach. There is a significant amount of literature that very clearly establishes and substantiates the fact that a Preservation First strategy is the most cost-effective strategy for pavement and bridge assets. This strategy effectively results in a spending approach that uses limited available funding on many more assets, essentially preserving these asset in as close to their 1 FHWA Office of Asset Management, Asset Management Primer, December
12 current condition as possible, a state of good repair, and not spending the money replacing a small number of assets in far worse condition. LADOTD s Support for Asset Management LADOTD strongly embraces the concept and principles of Asset Management along with the Congressional legislation and the direction that it provides. In fact, LADOTD believes that it justifies the ongoing efforts to move asset preservation to the forefront, increasing the opportunity to more fully use Life Cycle costs in the project selection process and providing the means to minimize risks and improve the long term sustainability of Louisiana s pavements and bridges. The mission of LADOTD is to plan, design, build and sustain a safe and reliable multimodal transportation and infrastructure system that enhances mobility and economic opportunity. While LADOTD endeavors to provide a world class transportation system to the state of Louisiana; these Congressional mandates, and the required development of this TAMP, along with sufficient funding, will enhance that effort. 1.1 MAP-21 REQUIREMENTS Asset management means a strategic and systematic process of operating, maintaining, and improving physical assets, with a focus on both engineering and economic analysis based upon quality information, to identify a structured sequence of maintenance, preservation, repair, rehabilitation, and replacement actions that will achieve and sustain a desired state of good repair over the life cycle of the assets at minimum practicable cost. 23 CFR Part Federal Legislation & Performance Requirements Recent Congressional legislation made a concerted effort to define how federal transportation funds are allocated, with a major concentrated focus on asset preservation and sustainability. This legislation provides certain mandates that are designed to transform the framework for making investments in the federal transportation infrastructure, while seeking to maximize preservation strategies. This legislation further codifies how the FHWA will hold State DOTs accountable as they move towards a performance-based highway asset management program, with additional life cycle planning requirements, as well as requiring a new documented focus on risk management. Penalty Assessments. Penalty assessments, for failure to comply with minimum pavement and bridge standards for the (NHS) National Highway System or failure to develop and implement a (TAMP) Transportation Asset Management Plan, are now part of the FHWA s arsenal to mandate compliance and adherence to these laws. The impact of these penalty assessments would be a loss of significant funding for state maintained federal aid eligible pavements and bridges. 1-2
13 23 USC 150 (b)(2) identifies one of the national goals is to maintain the highway infrastructure asset system in a state of good repair for the NHS. A state of good repair is defined by the FHWA as a condition in which the existing physical assets, both individually and as a system (a) are functioning as designed within their useful service life, (b) are sustained through regular maintenance and replacement programs. The following passages summarize the legislative requirements. The cornerstone of MAP-21 s highway program transformation is the transition to a performance and outcome-based program. States will invest resources in projects to achieve individual targets that collectively will make progress toward national goals. 2 Throughout this document, specific legislation will be identified to aid in the understanding of why certain aspects of asset management are included in this document. Mandated Management Systems 23 CFR mandates that State DOTs implement both Pavement and Bridge Management Systems. Essentially, Congressional legislation mandates data driven decisions for all aspects of Asset Management. LADOTD implemented Deighton s dtims Pavement Management System in 1991 and the AASTHO PONTIS Bridge Management System in These systems, along with over 20 years of digital pavement data collection 23 CFR Management systems shall include, at a minimum, documented procedures for: Collecting, processing, storing, and updating inventory and condition data for all NHS pavement and bridge assets; Forecasting deterioration for all NHS pavement and bridge assets so the TAMP must now Identify the Deterioration Models in the PMS & BMS; Determining the benefit-cost over the life cycle of assets to evaluate alternative actions (including no action decisions), for managing the condition of NHS pavement and bridge assets; Identifying short- and long-term budget needs for managing the condition of all NHS pavement and bridge assets Determining the strategies for identifying potential NHS pavement and bridge projects that maximize overall program benefits within the financial constraints Recommending programs and implementation schedules to manage the condition of NHS pavement and bridge assets within policy and budget constraints using ARAN vehicles and the many years of mandated (NBI) National Bridge Inventory federal bridge inspection and data reporting requirements, has placed LADOTD in an early adopter leadership position with respect to other DOTs and completely ensures that LADOTD is fully compliant with this mandate. LADOTD s very mature Pavement and Bridge Management Systems ensure that pavement and bridge treatment identifications and subsequent project recommendations are legitimately and completely data driven. 2 FHWA Office of Policy and Governmental Affairs, Moving Ahead for Progress in the 21 st Century Act (MAP-21): A Summary of Highway Provisions, July 17,
14 Mandated Pavement Data Quality Management Program To further reinforce the mandate for data driven decisions for all aspects of Asset Management, 23 CFR Part (c) mandates that State DOTs implement a Pavement Data Quality Management Program by May 20, Compliance with this mandate is not only subject to FHWA approval, it is an ongoing requirement for the FHWA s consistency determination and has a number of documented requirements. LADOTD has collected digital pavement data for over 20 years using contracted ARAN vehicles, once again placing LADOTD in an early adopter leadership position with respect to all other DOTs. Evidence of LADOTD s elevated leadership status for data quality assurance among all state DOTs is found in the FHWA produced 2013 document titled Practical Guide for Quality Management of Pavement Condition Data Collection. LADOTD s data quality assurance and data quality control procedures were frequently referenced throughout the entire document with a synopsis of this model operation documented in Appendix D. Case Study Louisiana DOTD. The ensure complete compliance with this federal mandate, LADOTD has updated existing documents, protocols and procedures that addresses all of the appropriate DQM Program requirements. 1.2 GUIDING PRINCIPLES OF LADOTD S ASSET MANAGEMENT PROGRAM Investing limited funding resources in the right place, at the right time, to produce the most cost effective life cycle performance for the given investment is the basis for the MAP-21 narrative and is certainly the goal of LADOTD s asset management philosophy. The goals of transportation asset management (TAM) are to: Build, preserve, and operate facilities more cost-effectively with improved asset performance. Assets must be managed throughout their lifecycles and for the longterm (considering growth forecasts and changes in user expectations). Deliver to an agency s customers the best value for the public tax dollar spent. Maximize the benefits delivered by the network while the costs of providing, maintaining and using the network are minimized. Enhance the credibility and accountability of the transportation agency to its governing executive and legislative bodies. Deliver agreed levels of service through financial programs and using effective management and reporting systems. LADOTD has certainly been using, and has clearly embraced, asset management principles for over 20 years. This is evidenced by the Department s very early adoption of and consequently mature pavement management system and bridge management system. 1-4
15 LADOTD has also implemented a maintenance management system that is interfaced with the statewide LAGOV financial management system. With this further impetus from Congressional legislation, LADOTD s existing TAM strategy is propelled forward with a greater urgency. Based on the new TAMP business model, LADOTD s ongoing efforts will continue to migrate towards integration of the interdisciplinary requirements of the Pavement, Bridge, Safety and Maintenance Management Systems, which will allow for the ongoing movement towards an overall holistic approach being applied to asset management issues. LADOTD will continue to pursue additional technology solutions, enhancements or replacement of existing technology solutions and progressive updates and modifications to department policies, objectives and practices to ensure that this ongoing effort is finally achieved. 1.3 TAMP REQUIREMENTS Congressional legislation requires that each State Department of Transportation (DOT) develop a risk-based Transportation Asset Management Plan (TAMP) to improve and preserve the condition of assets on the federal (NHS) National Highways of Significance, that contains the following elements: A summary listing of the pavement and bridge assets on the National Highway System in the State, including a description of the condition of those assets Asset management objectives and measures Performance gap identification Life cycle cost and risk management analysis A financial plan Investment strategies This document represents the Federal TAMP requirement. It explains the roles, responsibilities, and processes related to establishing and executing transportation asset management activities at LADOTD. The plan covers the breadth of asset management practices at LADOTD. It documents the objectives for LADOTD s asset management, the current condition and operation of the transportation assets including management challenges and potential 10- year end conditions. A description of how LADOTD manages its assets throughout their lifecycle, an analysis of key risks and their possible mitigation strategies and a summary of expected funding is included in this TAMP. The TAMP provides a discussion of how assets are managed, followed by investment strategies for achieving condition and performance targets. Finally, this Federal TAMP concludes with a plan for improving the State s asset management process in the future. 1-5
16 The TAMP will be reviewed and updated regularly to meet the ongoing required recertification mandate. Following the principles of continuous improvement, a feedback loop from observed performance to planning and programming decisions will ensure that decisions are supported by sound information. This approach is already evident as this 2 nd version of the Louisiana TAMP has resulted in a number of changes directly related to findings observed in the initial draft TAMP. A prime example is the creation of a new separate Non-Interstate NHS budget category, along with the move of the project selection process for these pavements from the District offices to a headquarters project selection team, which mirrors the existing Interstate process. Sustainability. It is important to note here that LADOTD has historically defined the term Preservation of an Asset as all possible treatments for an asset, from the lowest level such as chip seals or minor repairs all the way to full the replacement of an asset. Since national definitions of preservation generally refer to minor betterments or repairs, LADOTD has adopted the national definition of Preservation and will now use the term Sustainability to represent all possible treatments, including replacement, for an asset. 1.4 TAMP OVERSIGHT AND MANAGEMENT To facilitate this ongoing effort, LADOTD again took a national lead in Asset Management endeavors by creating a full time Asset Management Engineer (AME) located in the Office of Planning. The AME has a primary responsibility for developing, implementing, maintaining and updating the TAMP including coordinating or conducting all activities necessary to maintain compliance with Congressional asset management legislation. With active participation by the Secretary s Executive Staff, as identified via the Asset Management Business Structure, and the engagement of all divisions of LADOTD, the successful TAMP is owned by the Department and not by a particular division or group in the Department. 1.5 INITIAL SCOPE OF THE TAMP LADOTD s 2018 TAMP focuses on the mandatory NHS pavement and bridge assets and will consider addressing additional assets in subsequent future versions of the TAMP. The desire is to start with the two infrastructure assets of highest budgetary significance and then consider a future systematic expansion to include additional assets over time. This 2018 TAMP meets this minimum NHS pavement and bridge asset system requirements under 23 USC 119. It addresses pavement and bridge assets as follows: Pavements: National Highway System (NHS) Bridges: National Highway System (NHS) 1-6
17 While there is the potential consideration of adding other NHS right-of-way assets into future asset management planning cycles, it is appropriate to note that the comprehensive data requirements to support such inclusions are currently insufficient with respect to asset management functionality. LADOTD limited data sets for signals, intelligent transportation system equipment, sign trusses, guard rails, cable barriers, crash attenuators, sound walls, shoulders, high mast lighting and signs will require significant improvement to allow for addition into future TAMPs. The Executive Champion and TAM Steering Committee will also have to factor in the expense of data gathering and ongoing maintenance of data sets as they consider setting priorities for adding additional assets into the TAMP. 1.6 TAMP STRUCTURE In order to meet these requirements, this TAMP is presented as follows: Chapter 2 - Asset Management Structure, Plans, and Tools summarizes LADOTD s organizational processes supporting asset management, the relationship between the TAMP and other business plans, and provides an overview of the information systems and tools that support TAM. Chapter 3 Asset Inventory and Condition Measures summarizes the inventory and condition of the State maintained pavements and bridges and includes the locally owned NHS pavements and bridges. It examines overall travel demand on the system by the traveling public. It also explains the differences between the project level PMS data and measures and the network level Federal data and measures. This chapter also documents that the 2018 TAMP will address only the required NHS pavements and bridges. Chapter 4 Performance and GAP Analysis explores target setting concepts, identifies the desired state of good repair, explores past performance and identifies the forecasted performance based on the current funding scenarios. The chapter identifies NHS pavement and bridge targets and then introduces the concept of GAP analysis as it pertains to achieving targets. Chapter 5 - Life Cycle Planning introduces the concepts of life cycle planning and presents a synopsis of the consequences of delays preservation. It explains in detail how the Pavement and Bridge Management Systems allow for the full participation in the concepts of LCP. Chapter 6 - Risk Management Analysis outlines the methodology used to assess risk and presents the recently updated risk registers that identify the top priority risks. Next the risk mitigation and monitoring plans are presented. A new section is dedicated to the Part 667 Facilities Repeatedly Damages by Emergencies along with the formalization the three R s concepts which are Redundancy, Robustness and Resiliency into the planning process. 1-7
18 Chapter 7 Financial Plan and Asset Valuation provides a summary of the funding sources and uses. It then examines historical funding and projected funding along with the outcomes of those projected funds. Finally, it identifies the value of the NHS pavement and bridge assets. Chapter 8 - Investment Strategies describes LADOTD s investment strategies related to asset management. These include funding strategies, project strategies, risk management strategies, data improvement strategies and policy strategies. Chapter 9 Asset Management Enhancements defines specific improvement LADOTD will be pursuing for improving asset management going forward. 1-8
19 2.0 Asset Management Structure, Plans, and Tools This section summarizes LADOTD s organizational processes supporting asset management, the relationship between the TAMP and other business plans, and provides an overview of the information systems and tools that support TAM. 2.1 ASSET MANAGEMENT BUSINESS STRUCTURE LADOTD has been using asset management principles throughout the years as evidenced by the mature (PMS) Pavement Management System, (BMS) Bridge Management System and (MMS) Maintenance Management System. Prior to the 2012 emphasis on developing a TAMP, there were many in the Department that believed asset management was simply another term for maintenance management; however, the departmental culture has changed and now there is widespread understanding of the definition of TAM and the value that it can bring to the Department in managing assets to ensure that funds are spent efficiently and effectively. The TAMP is considered a business plan describing stewardship responsibilities for highway infrastructure. This TAMP is owned by the Department and not by a particular division or group in the Department. It tells the story of the services the agency delivers to its customers and how it utilizes and manages the assets it has under its control for this purpose. Asset Management Engineer. The TAMP is managed by the Asset Management Engineer (AME). The comprehensive role of this position is as follows: The AME serves as LADOTD s statewide expert in matters pertaining to asset management. This involves developing, implementing, and maintaining a comprehensive asset management plan. The AME works with the managers of the Department s pavement management, bridge management and maintenance management systems to facilitate compliance with federal asset management rules. The AME uses data driven decision making processes that examines both financial and technical issues and considers asset condition, performance and risk factors to facilitate the best maintenance and improvement investments. The AME will stay abreast of changes in technology associated with asset data inventories and management systems. The AME leads the development and implementation of the risk-based TAMP. The position coordinates among the Department s Pavement, Bridge and Maintenance Management Engineers and conducts analyses and prepares reports on current and future asset conditions. A primary function includes working closely with Department 2-1
20 personnel from the Executive Staff, LADOTD Districts, Design, Construction, Maintenance, Research, Budget and Finance, and Information Technology sections, as well as the Federal Highway Administration to ensure quality data availability and analysis capabilities. The AME also recommends strategic planning preservation goals in regard to infrastructure quality, and implements directives in accordance with planning and organizational goals. Expertise is provided in the area of management system principles so as to properly correlate appropriate inventory, condition states, deterioration rates, treatment points and types and treatment costs. These analyses and reports provide strategies to optimize asset condition at the network level within a predefined budget. Data analysis and reports are also prepared for setting LADOTD s long-term, network level asset condition goals. The AME coordinates the scheduled updates of the Risk Management Plan and works with Quality and Continuous Improvement Program (QCIP) section to ensure that policies and procedures are updated to reflect the most recent TAMP related changes, especially with respect to project selection and risk management changes. Organizational Structure. The responsibility for the management of the TAMP is located in the Data Collection and Management Systems Section, which is under the Office of Planning. The AME reports to the Section Administrator who in turn reports directly to the Deputy Assistant Secretary. The organizational chart is show in Figure 2.1 below. Figure 2.1 LADOTD Asset Management Organization Chart 2-2
21 LADOTD decided to locate the TAMP responsibilities in the Office of Planning because of the TAMP s relationship to the other departmental plans, most of which are developed and managed by the Office of Planning. The Statewide Transportation Improvement Program (STIP) and the annual Highway Priority Program of projects are overseen by this office as well. Furthermore, it was logical to locate the TAMP responsibilities in the Data Collection and Analysis Section due to the fact that much of the TAMP depends on data and analysis from the road and bridge management systems, which are a responsibility of this section. In addition, the management of the road and bridge location reference system and GIS activities are also in this section. Asset Management Support Structure. The AME position has no subordinates. Since TAMP management is a primary duty of this position and asset management is carried out throughout the Department (transportation planners, budget director, program managers, strategic planners, operations), the AME performs various data and technical analyses, identifies trends, identifies policy and procedural gaps and makes various TAM related recommendations to the TAM Steering Committee. That is, the AME works with the different parts of the organization and as necessary elevates relevant issues to a higher authority to seek support and resolution. In addition to the direct chain of command, the AME has other support resources such as the TAM Steering Committee and the Executive Asset Management Champion, who has direct access to the Secretary as shown in Figure 2.2 below. Figure 2.2 Asset Management Support Structure Office of Secretary Secretary Deputy Secretary Office of Planning Executive Committee (Deputy Secretary, TAM Champion) Data Collection and Management Systems TAM Steering Committee Headquarters Budget Section Asset Management Engineer Districts Capital Planning Program Managers QCIP Performance Management 2-3
22 As mentioned above, the AME is supported by the Executive Champion, currently the Deputy Secretary, and the TAM Steering Committee. The TAM Steering Committee is comprised of representatives from across LADOTD and functions as a review board whose recommendations are taken to the Executive Committee made up of the Secretary and the Division Heads, which includes the Executive Champion. The Executive Champion is also the TAM Steering Committee Chairman. Quality and Continuous Improvement Program (QCIP). The QCIP section is poised to assist the AME in ensuring that policies and procedures are updated to reflect the most recent TAMP related changes. To illustrate the importance LADOTD places on the policy and procedural driven approach based on appropriate data, LADOTD instituted a Change Management Program in October This program is charged with supporting the Department s goal to institutionalize an organizational culture of change with a mission to lead, facilitate, support, and enable continuous quality improvements in the Department. The section responsible for the program was renamed the Quality and Continuous Improvement Program (QCIP) to more appropriately identify their ongoing responsibilities. QCIP s role has expanded to include strategic planning for the Department, and other various support roles. QCIP will play a major role in addressing the ongoing needs of the TAMP with respect to updating policies and procedures to reflect the appropriate changes especially with respect to risk management. As an example of a QCIP success story, following LADOTD s initial Design Build project, QCIP conducted a final project SWOT analysis. This is a structured method used to evaluate the strengths, weaknesses, opportunities, and threats involved in a project. As a result of the QCIP analysis, Design Build projects have substantially improved and now have the Life Cycle Cost Analysis concept as a fundamental part of the process to overcome the inappropriate premise of Design Build that focuses on immediate savings in time and initial costs at the expense of the long-term life cycle costs. 2.2 TAM RELATIONSHIP TO OTHER BUSINESS PLANS For many years, LADOTD has been a Department that embraces the concepts of written policies and procedures to maintain consistency and transparency. A number of plans, manuals, guides, memorandums, policy statements, standard operating procedures and design standards, along with Engineering Directives and Standards, exist to ensure adherence to this cultural philosophy. The TAMP is a document that doesn t replace these plans, but coordinates with these plans and tells the story of the Department in relation to its mission. The TAMP, combined with the existing plan strategies and goals, guides LADOTD in its effort to most effectively manage its transportation assets. The various plans are referred to throughout the TAMP. 2-4
23 Existing Business Plans The TAMP draws from several pre-existing LADOTD plans. These plans include: 1. The Louisiana Statewide Transportation Plan (STP) (originally developed in 1996, updated in 2003, 2008, and 2015) 2. Statewide Transportation Improvement Plan (STIP) 3. Highway Safety Improvement Program (HSIP) Infrastructure Project Selection Guide for State Routes (September 2017) 4. Louisiana Freight Mobility Plan (December 2017) Five Year Strategic Plan 6. Continuity of Operations Plan (COOP) 7. The Highway Project Selection Process 8. Annual Highway Priority Program (HPP) 9. Annual Highway Budget Partitions 10. Annual Operations Budget A description of each of these plans follows: Louisiana Statewide Transportation Plan (STP) The 2015 Louisiana Statewide Transportation Plan (STP) documents a long-range multimodal transportation strategy to meet the goals and objectives for the State s transportation and infrastructure system. The goals for Louisiana s transportation system are: Goal 1 Infrastructure Preservation and Maintenance: Preserve Louisiana s multimodal infrastructure in a state-of-good-repair through timely maintenance of existing infrastructure. Goal 2 Safety: Provide safe and secure travel conditions across all transportation modes through physical infrastructure improvements, operational controls, programs, and public education and awareness. Goal 3 Economic Competitiveness: Provide a transportation system that fosters diverse economic and job growth, international and domestic commerce, and tourism. Goal 4 Community Development and Enhancement: Provide support for community transportation planning, infrastructure, and services. Goal 5 Environmental Stewardship: Ensure transportation policies and investments are sensitive to Louisiana s environment, history and culture. 2-5
24 Statewide Transportation Improvement Plan (STIP) The purpose of the State Transportation Improvement Program (STIP) is to provide for a fiscally sound, set (1-4 years) capital improvement plan for the state s surface transportation program. The STIP is not just a document, but is part of a fully integrated process for transportation planning and transportation project selection. The STIP is updated as needed to document the results of the project selection process. The STIP has been developed through a coordinated and cooperative process by the Louisiana Department of Transportation and Development (LADOTD) involving citizens, elected officials, Tribal governments, other state and federal agencies, each of Louisiana s ten metropolitan planning organizations (MPO), and other interested organizations. The STIP establishes schedules for a variety of projects, including: Highways and bridges; Bicycle and pedestrian facilities; Highway safety; Congestion mitigation and air quality improvement; Railroad crossing safety; Highway operations and motorist services; Public transportation; and Capacity Expansion, etc. Louisiana operates under a federal fiscal year (October 1 - September 30) and our STIP must be approved by the Federal Highway Administration (FHWA) and the Federal Transit Administration (FTA). This multi-year and multi-modal program identifies the transportation projects that have been through an inclusive and ongoing public involvement process. Highway Safety Improvement Program Infrastructure Project Selection Guide for State Routes (HSIP) The Highway Safety Improvement Program (HSIP) is a core Federal-aid program with the goal to achieve a significant reduction in traffic fatalities and serious injuries on all public roads, including locally owned public roads and public roads on tribal lands. The HSIP requires a data-driven, strategic approach to improving highway safety on all public roads that focuses on crash performance which is outlined in the Strategic Highway Safety Plan (SHSP). Implementation and management of the HSIP includes many components that can be categorized as safety planning or infrastructure focused: Strategic Highway Safety Plan (SHSP) 2-6
25 Louisiana Center for Transportation Safety (LCTS) Highway Safety Research Group (HSRG) Traffic Records Coordinating Committee (TRCC) State Highway Safety Program Local Road Safety Program (LRSP) Safe Routes to Public Places Program (SRTPPP) Louisiana Freight Mobility Plan The Louisiana Freight Mobility Plan is designed to meet the requirements of the FAST Act of Prior to the FAST Act, the State had fulfilled the recommendations of the previous MAP-21 legislation through its proactive freight planning programs. This plan is intended to serve the unique needs of the LADOTD and its partners to improve freight transportation by identifying needs, recommending policies, and devising implementation strategies. The Plan considers highway, rail, aviation, and port and waterway needs. The Plan also describes the pipeline system, but does not provide investment or policy recommendations for it. The Plan has a long-term, 25-year perspective on needs and issues including projects in the current Highway Priority Program (HPP), the current Statewide Transportation Improvement Program (STIP), future STIPs by reference, mega projects and other mode specific needs. There is a large gap between the available funding for freight projects and the need. This underscores the importance of project selection processes and programs that address the most important modal needs, provide the greatest return on investment, and that, whenever possible, promote cost-sharing among partners and beneficiaries. Five Year Strategic Plan LADOTD recently published its latest five year strategic plan, effective through June The plan continues to adapt and evolve to meet new federal and state policy changes and requirements that govern transportation spending. The plan currently outlines: Department goals Strengths, weaknesses, opportunities, and threats Strategic objectives for the Department and the associated performance indicators Processes to monitor and evaluate performance Continuity of Operations Plan (COOP) LADOTD has essential functions that must be performed rapidly and efficiently in a disaster or emergency involving state-owned transportation infrastructure in the State of Louisiana. 2-7
26 If the normal key staff and facilities are not available, LADOTD's Continuity of Operations Plan (COOP) ensures that LADOTD's essential functions can still be performed using alternate facilities, equipment, communications, and staffing. The COOP also includes assisting local governments in the movement of citizens, pets, and critical supplies during emergencies. The LADOTD Secretary or Secretary's designated representative directs implementation of the COOP which establishes policy and guidance for the execution of essential functions. Available key leaders and staff responsible for these essential functions will work with COOP participants to implement the COOP in whole or in part depending on the situation. The COOP utilizes LADOTD alternate resources (personnel, facilities, equipment, etc.) that are immediately available and under the direct administration and management of LADOTD. Procedures are activated for alerting, notifying, activating, and deploying personnel; identifying the essential functions; establishing the alternate facilities; and identifying personnel with authority and knowledge of these functions. Personnel and resources are then relocated to an alternate facility capable of supporting operations. COOP plan testing, and maintenance is essential to ensure that the LADOTD maintains a high level of readiness to achieve operational status no later than 12 hours after COOP implementation, and to sustain LADOTD operations for up to 30 days after a catastrophic event. If the COOP is extended past 30 days, a temporary relocation plan for non-essential functions may be activated to support normal operations. The COOP is vital to prevent disruption of LADOTD's essential functions when primary LADOTD personnel or resources are unavailable due to disaster or emergency. The Highway Project Selection Process The Highway Project Selection Process Manual presents the standard operating procedure that LADOTD s Office of Planning uses for the Highway Project Selection Process. It includes the steps and tasks for identification, prioritization, and selection of highway projects on the various asset classes in the State. It has been updated to address requirements of federal and State legislation, including Congressional legislation requirements. The manual currently identifies four categories of highway projects. System Preservation Traffic Safety Capacity Expansion System Operation Interstate and Non-Interstate NHS Pavements. The process for selecting pavement preservation projects entails using the output from the Pavement Management System. With the projected budget, the PMS recommends pavement treatments, or work types, ranging from chip seal, microsurfacing, overlays including total pavement replacement by 2-8
27 analyzing pavement condition data using appropriate Life Cycle strategies imbedded within the PMS. The output is forwarded to the Pavement Preservation Selection Team often still referred to the Project Selection Team (PST). While other asset classes are managed by allocating funds to the Districts by formula, funding for Interstate and Non-Interstate NHS highway pavement preservation projects, due to the magnitude of the costs, are allocated directly to projects by the PST. The DOTD District personnel will receive the PMS list of Interstate and Non-Interstate project recommendations from the PST and with due consideration given to the Statewide Transportation Plan, will gather any input from the public, state and local elected officials, Metropolitan Planning Organizations, Rural Consultation Process, regional/local planning officials, other state agencies and federal agencies. The PST will then select the Interstate and Non-Interstate NHS projects from the PMS recommendations, with significant input from the District Administrators. State Legislation. In accordance with State law RS 48:229.1, the project selection teams consider the following factors in prioritizing projects for selection: (1) The condition of the roads, streets, and structures making up the state highway system and the relative urgency of the improvements considering in their order of general needs. For purposes of this Paragraph, "condition" shall include but not be limited to the state of repair of the existing roadway and shoulder surfaces, structures and drainage, and other factors of the roadway, such as signs, signals, markings, and barriers. (2) The type and volume of traffic on a particular segment of roadway, highway, or bridge. (3) The crash records for a particular segment of roadway, highway, or bridge. (4) The technical difficulties in the preparation of plans and the procurement of rights-ofway for a particular segment of roadway, highway, or bridge. (5) Whether unforeseeable emergencies such as floods have created an immediate need for improvement or reconstruction. (6) Whether capacity improvements are warranted due to population or traffic volume increases in specific geographic areas. (7) Whether or not the highway or bridge is or will be on an evacuation route utilized to evacuate large populations due to catastrophic events such as hurricanes or flooding. (8) Whether the improvement to or addition of a highway or bridge will benefit the economic development potential of the state. When each of the project selection teams has completed their project selection list, the final steps, show below, are taken to determine the highway program. 2-9
28 Recommended (selected) projects assembled into proposed Highway Program Proposed Highway Program submitted to House & Senate Transportation Committees Joint Transportation Committee holds public hearings throughout State for the Program and STIP Final decision on Highway Program rests with House & Senate Transportation Committees and ultimately full Legislature Annual Highway Priority Program (HPP) The Annual Highway Priority Program (HPP) identifies projects that are scheduled for construction letting during the year and projects which are in various stages of planning and preparation. The Legislative Joint Transportation, Highway, and Public Works Committee along with the Office of Planning presents the program to the public in each of the nine Districts to receive comments on the program and to take requests for future projects. The Legislative Joint Transportation, Highway, and Public Works Committee then approves the program to be included into HB2 and the program is distributed to the entire legislature for approval and Governor s signature. Annual Highway Budget Partitions LADOTD utilizes a technique for partitioning its capital budget into categories based on a combination of historical funding levels and needs. The Annual Highway Budget Partitions detail funding levels on transportation system projects that relate to several areas, including: Preservation/Sustainability Operations/Motorist Services Safety Capacity Miscellaneous A copy of the SFY budget partition, as shown in the Appendix LADOTD State FY Budget Partition, also identifies the funding sources (e.g. federal or State funds, bonds, tolls, etc.). 2-10
29 The TAMP relevant budget partition sub-partitions include the following: Preservation/Sustainability Non-Interstate Pavement Non-Interstate Pavement (NHS) Non-Interstate Pavement (Non-Federal Aid) Contract Maintenance (Road) Interstate Pavement Bridge (On System) Bridge (On System) (Toll Credits) Bridge (Interstate) Operations Movable Bridge Preventive Maintenance Annual Operations Budget LADOTD Operations operating budget includes statewide personnel services, non-capital professional services, operating services, travel, supplies, equipment acquisitions, and interagency transfers (IT, Insurance, etc.). Expenditures for maintenance and operational activities on roads and bridges are managed by the Maintenance Management System (MMS) Agile Assets which is integrated with the LAGOV Financial Management System. The MMS tracks all repairs and maintenance performed with in-house forces. The MMS is fully configured and capable of managing planned preventive maintenance activities and the Department is in the process of implementing the MMS Level-of-Service functionality, which will be used to assess maintenance activities performed by in-house forces, within the existing operating budget. The operating budgets for the nine Districts and the HQ statewide maintenance sections are determined from the overall operations budget with a distribution based partly on historical budget levels and specific requests. From the District operating budgets, the expenditure of funding for both the routine (reactive) repairs and preventative (proactive) maintenance of roads and bridges is determined by knowledgeable staff, with a focus based on appropriate priorities (safety, functionality, etc.). A key component of this effort requires the necessary adjustments relating to the immediate daily needs, of all highway and bridge assets, encountered by the district operations. The long-term lack of funding, manpower, and equipment resources severely impact the ability to perform proactive preservation activities. As funding is continually delayed the inevitable further decline in conditions results in increasing daily reactive maintenance efforts, further exasperating any chance of performing proactive preventive 2-11

30 maintenance. See the section titled Actual Consequences of Delayed Preservation where the impact of this issue if quantified in terms of real dollars. Interaction of TAMP and Other Plans The diagram in Figure 2.3 below is a modified version of the original found in the AASHTO Transportation Asset Management Guide, A Focus on Implementation. It depicts the interrelationships between the TAMP and the other plans in LADOTD. The TAMP is a document which brings all of these together into a single plan which tells the story of the agency in relation to its mission. Figure 2.3 Interrelationship Between TAMP and other DOT Plans 2.3 TAM TOOLS Over the years, LADOTD has developed or procured a number of data systems and software solutions to support the Department s long time TAM objectives. These data systems comply with 23 CFR 515.7(g) requiring that State DOT uses the best available data for development of the TAMP. LADOTD s early initial focus on pavement and bridge assets resulted in implementation of the following major systems: dtims (Deighton Total Infrastructure Management System) CT comprehensive asset management software used for pavement management analysis. This solution is the long-term Pavement Management System (PMS). LADOTD will configure the 2-12
31 necessary tables in dtims to implement the BMS functionality for comparison against AASHTO BrM and AgileAssets BMS. AgileAssets MMS the comprehensive asset management software used as a Maintenance Management System (MMS) for transportation assets. Implemented as part of the LaGov project, it has multiple interfaces to the financial management system SAP, which contains the Fleet and Facilities modules. TAHI (Highway Inventory Database) the custom, home grown, mainframe highway inventory database used to track various highway data requirements. HPMS (Highway Performance Monitoring System) - is the FHWA national level highway information system, started in 1978, that includes data on the extent, condition, performance, use and operating characteristics of the nation's highways. An updated version of HPMS is the MAP-21 pavement data reporting system for State DOTs. TAND (Highway Needs Database) the custom, home grown, mainframe highway needs database used to track various details relating to the needs analysis of pavements. AASHTOWare PONTIS/ BrM the Bridge Management System (BMS) software provided by the American Association of State Highway and Transportation Officials (AASHTO). Designed for element level analysis. Currently being upgraded to the next version called AASHTOWare Bridge Management software (BrM), which is designed for element level analysis. BrM will be compared against the AgileAssets BMS and Deigton s dtims BMS. AgileAssets BMS in conjunction with the AgileAssets MMS, LADOTD will install and evaluate the AgileAssets BMS to compare against the AASHTO BrM and Deighton s dtims BMS. STRM (Structure Inventory Database) the custom, home grown, mainframe bridge structure inventory database used for mandatory component level National Bridge Inventory data storage for analysis and reporting requirements. STRM has been the historical system of record and is currently being phased out. STRM is no longer the system of record and is currently used as a reference for bridge recall numbers only. InspectTech bridge inspection software combined with AASHTOWare BrM will soon take over this solution completely. PONTIS Bridge Inspection Solution/InspectTech the custom application for field devices used to capture both National Bridge Inventory (NBI) component inspection data for STRM and element inspection data for PONTIS. It has being phased out and replaced by InspectTech which is the bridge inspection solution provided by the AASHTOWare BrM developer. Upgrades to BrM and InspectTech will allow for the synchronization of bridge inspection data. 2-13
32 NBI (National Bridge Inventory) - the long term federal bridge data reporting system for State DOTs that will continue to serve as such for the MAP-21 final rules. This solution currently requires State DOTs to submit component inspection data even as the supporting Bridge Management solutions are migrating to an element inspection direction. This migration is expected to be addressed in future federal rulemaking. Scorecard a custom internal application designed to track performance measures for individual sections including strategic performance measures. ESRI Roads and Highways a linear referencing system solution that makes it possible for departments of transportation to integrate data from multiple linear referencing system (LRS) networks to get a comprehensive view of their roadways. This GIS based software solution allows for location measures associated with data in different standalone silo systems to be kept current and synchronized via edits made to the linear referencing system (LRS) solution. This data interoperability and data sharing across business units, eliminates the need for duplicate data in various data silos, and consequently eliminates data inconsistencies. This solution was implemented in February 2017, linking several critical standalone silo systems, and will continue to be integrated with other data systems. ARAN (Automated Road Analyzer) a state of the art, multi-function data collection vehicle (DCV) provided by Fugro Roadware. The DCV utilizes the latest 3D technology and advanced cameras to capture pavement data/images used for pavement condition analysis in the PMS, and right-of-way images used for asset inventory data capture, i.e. guardrail, signs, etc. ivision - a Fugro Roadware web application that offers synchronized viewing of ARAN collected pavement management data while allowing user to view synchronized right-of-way video log, pavement images, and the users customized choice of collected pavement management and condition data. LaGov the financial management system and project management system built using SAP. LaGov provides fleet and facilities asset management functionality and also provides AgileAssets with data for personnel and fleet resources along with costing for work orders. 2-14
33 3.0 Asset Inventory and Condition Measures 3.1 INTRODUCTION LADOTD s TAMP addresses the federally required pavement and bridge assets on the National Highway System (NHS). The remaining state-maintained pavements and bridges are included throughout the TAMP for reference purposes but are not made part of this asset management plan at this time. In addition to the LADOTD maintained NHS pavements and bridges, a limited number of NHS bridges and pavements are also owned by MPOs and the Greater New Orleans Expressway Commission, commonly referred to as The Causeway Commission. All of these NHS assets require a statewide view of the system in order to maintain and improve asset condition and to meet national and state performance goals. This chapter summarizes the asset inventory information for all pavement and bridge assets maintained by LADOTD. Federal Requirement 23 CFR 119 requires that a state s TAMP must include the NHS pavements and bridges, including a description of asset condition. 23 CFR defines NHS pavements and bridges as Interstate System pavements (inclusion of ramps that are not part of the roadway normally traveled by through traffic is optional); NHS pavements (excluding the Interstate System) (inclusion of ramps that are not part of the roadway normally traveled by through traffic is optional); and NHS bridges carrying the NHS (including bridges that are part of the ramps connecting to the NHS). Budget and Analysis Categories (Asset Classes) LADOTD maintains over 16,000 center line miles of roadway and just fewer than 8,000 bridges. For budgeting and analysis purposes, State-owned pavement and bridge assets, along with the locally owned NHS, are now classified using the following categories, or Asset Classes: Interstate - Interstate Highway System, part of the National Highway System, maintained by LADOTD, does not include Local NHS Non-Interstate NHS - Non-Interstate National Highway System, maintained by LADOTD, does not include Local NHS 3-1
34 Local NHS - Local National Highway System, maintained by local governments within metropolitan areas or The Causeway Commission (not part of LADOTD budget) SHS - Statewide Highway System, maintained by LADOTD, Non-National Highway System, Federal Aid Eligible System RHS - Regional Highway System, maintained by LADOTD, Non-National Highway System, Non-Federal Aid Eligible System 3.2 SYSTEM TRAVEL DEMAND Federal Requirement. 23 CFR 515.7(b) identifies that State DOT should include future changes in demand. Changes in traffic volumes are the primary method of analyzing travel demand for State DOTs pavements and bridges. The FHWA publishes yearly highway statistics and this section analyzes that data to gain an understanding of the changing patterns of traffic in Louisiana. The following sections summarize the past trends in travel demands in an attempt to gain an understanding of potential future travel demand. Summary of Travel Demand Analysis Conclusions The following system travel demand analysis shows that since Hurricanes Katrina and Rita, traffic increases continue in urban areas while the rural traffic is in constant decline. Most significantly, the Huey P. Long era created Regional Highway System (RHS) can no longer be supported in the current fiscal crisis. The RHS represents a very significant 39.1% of the total lane mileage on the state-maintained network but continues to carry only a marginal 3.4% of the total state-maintained highway traffic volume. LADOTD continues to make strides to reduce the RHS with the Road Transfer Program detailed later in this chapter. Urban Rural Travel Demand Trends In the most recently available 2016 Federal Highway Statistics 3, Louisiana s State maintained highway system experienced billion vehicle miles of travel (VMT) while the overall total statewide traffic volume, including all local roads, was billion VMT. Since 2007, the overall statewide system, including all local roads, reflected a ten (10) year traffic volume growth of slightly more than 8.3% while the State maintained system saw a traffic volume increase of 10.7%. Note: the VMT data used in this section was corrected to the federal HM-50 Ownership tables to ensure accurate reporting of VMT values for appropriate pavement categories. 3 VM Vehicle-miles of travel, by functional system, September 18, 2017, 3-2
35 Overall Travel Demand Trend Conclusions Significant Demand Analysis Conclusion. Much of America has seen a surge in urban growth with an equivalent reduction in rural growth. In Figure 3.1 below, the 2005 and 2006 traffic volume spikes caused by Hurricanes Katrina and Rita very clearly mark the turning point when urban traffic began to outpace the rural traffic in Louisiana. Urban traffic volumes have been trending steadily upward since 1997, while rural traffic volumes have never returned to pre-katrina/rita levels. Figure 3.1 VMT Urban & Rural Trends (Million miles - corrected to HM-50 Ownership) Travel Demand by Pavement Category (Asset Sub-Group) Interstate Travel Demand. We find in Figure 3.2 below that over the previous 10 years, Interstate traffic volume has increased by 2.81 billion VMT or 21.9% of the state maintained total VMT. The urban component was the most significant part of the increase, comprising 83.4% of the Interstate increase. While the Interstate represents only 9.0% of the total lane mileage on the state-maintained network, for the past 10 years it carried an average of 36.4% of the traffic volume with the 2016 VMT total reaching 39.0% or billion VMT on the state-maintained system. Non-Interstate NHS Travel Demand. Likewise, Figure 3.2 shows that over the previous 10 years, Non-Interstate NHS traffic volumes have increased billion VMT or 20.0%. The urban trend continued with the urban component comprising 67.8% of the Non-Interstate NHS increase. 3-3
36 The Non-Interstate NHS represents 18.1% of the state-maintained lane miles, carried a 10- year average of 27.5% of the traffic volume, and carried 28.2% or billion VMT in Figure 3.2 Percent VMT for State Maintained System (by federal reporting year) State Highway System (SHS) Travel Demand. In contrast, Figure 3.2 above shows that over the previous 10 years, SHS traffic volumes have decreased 0.59 billion VMT or 29.3%. The urban component actually increased by billion VMT but the rural component decreased by billion VMT, resulting in the net loss and again highlighting the urban growth phenomenon. The SHS represents 32.8% of the state-maintained lane miles, carried a 10-year average of 32.1% of the traffic volume, and carried 29.3% or billion VMT in While the Non-Interstate NHS and the SHS are currently very similar in traffic demand, the Non- Interstate VMT is experiencing a slow and steady increase, the SHS, since 2011, has experienced a recent rapid decline. Regional Highway System (RHS) Travel Demand. In stark contrast, Figure 3.2 above shows that the RHS, which represents minor collectors and state maintained local roads of a mostly rural composition, represents 39.1% of the total lane mileage on the state maintained network, but in 2016 carried only 3.4% of the total state maintained traffic volume, constantly trending downward from a high of 6.5% in This is clearly another indicator of the declining component of rural statewide traffic demand. 3-4
37 Asset Sub-Group Demand Conclusions Significant Travel Demand Analysis Conclusion. The most important point to be made here is the RHS carries very little traffic for the enormous size of the system. LADOTD has made strides to reduce this system, but the legislature and the public must understand that in a time of significant funding constraints, these assets will receive very limited funding. 3.3 PAVEMENT SYSTEM SUMMARY Asset Classes and Sub-Groups. Interstates and Non-Interstate NHS pavements make up the pavement asset classes while asset sub-groups are made up of the pavement types of Asphalt, Composite Pavements, Jointed Concrete Pavement and Continuously Reinforced Concrete Pavements. Note the federal assessment is based on only three pavement sub-groups, Asphalt, Jointed Concrete and Continuously Reinforced Concrete Pavements, with composite pavements included in the Asphalt sub-group. State Maintained Pavement Inventory Lane Mile Totals. At the end of SFY 15-16, LADOTD maintained 16,394 centerline-mile highway system. Since LADOTD updates this data on a 2-year cycle, the pavement data analysis included in the rest of this document is based on that snapshot of pavement data. Pavement Asset Inventory. The asset inventory Table 3.1 below provides the details for all state-maintained pavement categories, or Asset Classes, and the non-state maintained Local NHS. Lane Mile. A lane mile is a measure of the total length of traveled pavement surface for an individual continuous travel lane. Travel lanes do not include turn lanes. Centerline Mile. A centerline mile is a measure of the total length (in miles) of pavement, as measured along the roadway centerline. It does not consider the number of travel lanes. Federal Analysis Lane Miles. For federal reporting purposes, Federal Analysis Lane Miles are determined by multiplying the centerline Asset Class Table 3.1 State Asset Inventory Center Line Miles PMS Analysis Lane Miles Federal Analysis Lane Miles Interstate 892 1,620 3,461 Non-Interstate NHS 2,214 3,022 6,990 **Local NHS 96 n/a 386 SHS 5,785 6,302 n/a RHS 7,406 7,406 n/a Totals 16,394 18,350 10,838 * = PMS Analysis mileage is determined from the primary direction of travel for all undivided roadways and both directions for multi-lane divided roadways. Excludes bridge decks, gravel and brick surfaces. ** = as of August

38 length (in miles) times the total number of travel lanes in both directions for each segment of pavement. PMS Analysis Lane Miles. The PMS Analysis Lane Miles represent the pavement surface area used by the PMS. They are comprised of data for the travel lane, on the far right side, in the primary direction of travel on all undivided roadways and the travel lanes, on the far right side, in both directions on divided roadways. PMS pavement treatment recommendations are based on homogeneous pavement sections and pavement surface types could very well be different, for alternate directions, on divided highways. LADOTD determined years ago that the extra cost to capture pavement condition data in both directions on undivided highway did not provide measurable gains in PMS analysis outcomes or benefits. Percentage of Lane Miles by Asset Class. The breakdown of Federal analysis lane-mileage by asset class, or highway category, is shown below in Figure 3.3 while Figure 3.4 shows a similar breakdown by PMS analysis lane-mileage. Note the federal analysis lane-mileage does not apply to the SHS or RHS asset classes in Figure 3.3 while Figure 3.4 PMS analysis lane-mileage excludes the Local NHS pavements since LADOTD does not manage those pavements. Figure 3.3 Percent Federal Analysis Lane-Miles by Asset Class 3-6

39 Figure 3.4 Percent PMS Analysis Lane-Miles by Asset Class Percentage of PMS Lane Miles by Asset Sub-Group. LADOTD s PMS manages pavements using four different pavement types, or asset sub-groups, including Asphaltic Concrete Pavements, Composite Pavements, Jointed Concrete Pavements and Continuously Reinforced Concrete Pavements. We note again, the Federal network level analysis join composite pavements within asphaltic concrete pavements. The pie charts found in Figures 3.5 through 3.8 below identify the current breakdown of Louisiana s PMS pavement inventory by pavement type, or asset sub-groups, for the identified Asset Class. Figure 3.5 Interstate PMS Lane Mileage By Asset Sub-Group Asphaltic Concrete Pavement (33.0%) Composite Pavement (28.3%) Continuously Reinforced Concrete (2.5%) Jointed Concrete Pavement (36.2%) 3-7
40 Figure 3.6 Non-Interstate NHS PMS Lane Mileage By Asset Sub-Group Figure 3.7 SHS PMS Lane Mileage By Asset Sub-Group (SHS for information purposes only, not part of the TAMP Analysis) Figure 3.8 RHS PMS Lane Mileage By Asset Sub-Group (RHS for information purposes only, not part of the TAMP Analysis) Pavement Treatment Age The average pavement treatment age, based solely on the most recent pavement treatment and not the length of the pavement s existence, is shown in Table 3.2 below. 3-8
41 Maintenance activities and minor preservation treatments, such as chip seals, crack sealing, etc. do not reset the pavement age, but clearly extend the service life of pavements as inferred by the extended average age of pavements shown here. Pavement treatments that reset the pavement age also reset the various pavement distress indexes identified in the following section. The analysis shows that the average pavement treatment age has increased in nearly all cases over the most recent 2-year cycle. This negative trend is a direct reflection on the limited funding available for pavement treatments. Additional funding will be necessary to prevent this negative trend from continuing. Table 3.2 Changes in Average Pavement Treatment Age Asset Class *Average Age Previous Cycle *Average Age Current Cycle Interstate Non-Interstate NHS SHS RHS * = Age is based on last pavement treatment reset, not time since original pavement construction 3.4 FEDERAL NETWORK LEVEL ASSESSMENT VS PMS PROJECT LEVEL ASSESSMENT Federal Network Level Assessment The FHWA has selected four pavement performance metrics to determine the network level pavement condition of the NHS pavements. The pavement data, supporting these measures, will be reported to the (HPMS) Highway Performance Monitoring System. The four 23 CFR Part 490 measures are calculated using quantitative data based on the following metrics: Pavement roughness, an indicator of discomfort experienced by road users traveling over the pavement, is measured using the International Roughness Index (IRI). Rutting is quantified for asphalt pavement by measuring the depth of ruts along the wheel path. Rutting is commonly caused by a combination of heavy traffic and heavy vehicles. Cracking is measured in terms of the percentage of cracked pavement surface. Cracks can be caused or accelerated by excessive loading, poor drainage, frost heaves or temperature changes, and construction flaws. 3-9
42 Faulting is quantified for concrete pavements. Faulting occurs when adjacent pavement slabs are misaligned. It can be caused by slab settlement, curling, and warping. Federal Data Collection. The mandated timeline for data collection of these 23 CFR Part 490 measures began on January 1, LADOTD preemptively captured this data prior to this timeline requirement in an attempt to gain a head start on resolving all the potential issues that could arise in performing a new data collection, data quality assurance, and data analysis. This coupled with the change from 2D to 3D data collection technology has proven to be a health decision as this effort is ongoing and will be finalized just before the 2018 data submittal requirement comes due. Federal Condition Criteria. The data collection of the Federal Pavement Condition Criteria 23 CFR Part (b) federal MRI, Rutting, Faulting and Cracking Percent pavement condition metrics identified here will be captured in the right most lane of travel in the primary direction on pavements. The FHWA intends to extrapolate that Metric MRI (inches/mile) Cracking (%) - Asphalt - Jointed Concrete - Continuously Reinforced Concrete Rutting Asphalt (inches) Faulting Jointed Concrete (inches) Good <95 <5 <5 <5 <0.20 <0.10 Fair Poor >170 >20 >15 >10 >0.40 >0.15 data across the total number of lanes for each pavement. An individual mile section is rated as being in good overall condition if all of the metrics are rated as good, and poor when two or more are rated as poor. All other combinations are rated as fair. The lane miles in good, fair and poor condition are tabulated for all sections to determine the overall percentage of pavement in good, fair and poor condition. In order to accurately expand the data across the lanes, and to eliminate inappropriate data on bridge structures, the federal requirements specifically identify that State DOTs shall report three HPMS inventory data elements; Through Lanes which identifies the number of lanes designated for through-traffic, Surface Type which designates the pavement surface type on a given section, and Structure Type which identifies the bridges and tunnels. These historically reported inventory elements now gain additional quality control significance as reporting errors for these items could impact a State DOT s ability to make significant progress toward achieving targets. 3-10
43 Project Level Incompatibilities with Network Level Analysis. While LADOTD s PMS analysis uses the same type of data required by the FHWA, the federal data capture and reporting requirements would be considered a network level assessment and the LADOTD PMS data capture and reporting would be considered a project level assessment. In other words, the different approaches are mostly incompatible and there are a number of different reasons LADOTD s PMS implementation simply cannot adopt the federal data in project treatment analysis and selection. First and foremost, LADOTD incorporated cracking extents and crack width severity in the PMS pavement treatment selections. As an example, the Alligator Cracking extent and cracking width severity is shown below. The Federal network level data requirements for cracking are simply the extent, or linear measure of cracking, and is absent of crack width severity. The LADOTD PMS implementation requires a cracking width severity measure to apply the appropriate crack treatment such as a chip seal for low severity cracks and an overlay for high severity cracks. Another primary reason the Federal assessment is a network level implementation is the combination of Composite Pavements into the asset class with Asphalt pavements. In the LADOTD PMS project level implementation, these pavement types, or asset classes, are separated and use a completely different combination of index values to assess and project conditions. While the Federal assessment is completely valid for a network level assessment, it is in sharp contrast to LADOTD s project level treatment selection requirements. Changing the LADOTD PMS approach to match the federal approach would be inappropriate with respect to project level analysis. Projecting Federal Performance. This being the case, LADOTD cannot currently predict future Federal network level performance like it can predict the project level performance via the PMS. LADOTD will endeavor to identify a method, such as a crosswalk table, to predict the Federal network level performance measures from the PMS forecasts if a possible correlation can be identified for these different approaches. Note this only becomes a relevant issue if LADOTD experiences a pavement penalty assessment based on the network level data. Under a penalty assessment, LADOTD will have to work to ensure the project level PMS treatment selections will result in the agency s successful effort to move out of the penalty assessment. 3-11
44 3.5 PAVEMENT CONDITION DATA Federal Data Requirements. The requirement of 23 CFR 515.7(g) is that State DOTs shall use the best available data to develop their asset management plans. We note that recent updates to the FHWA s HPMS data submittal requirements, with respect to the federal measure and legislation, has for the first time been completely formalized to eliminate the extensive state interpretations in historical submittals and to ensure consistent nationwide data submittals. This section provides details with regards to pavement data collection with regards to this federal requirement. Missing Historical Federal Data Historical Federal Data Issues. LADOTD has been collecting pavement condition data since 1995 for a variety of pavement distress conditions; however, it does not have historical data relevant to the Federal measures for faulting or cracking. Faulting Issue. With respect to faulting data, LADOTD never required the data collection vendor to keep the faulting data below a 0.2 inch threshold. This was a result of joint repair treatment projects that were triggered in the PMS for joints exceeding faulting thresholds of 0.4 inches. The new Federal faulting measures are based on an average faulting for each mile segment. These values must remain below 0.15 inches to stay in a Fair or better condition. Cracking Issue. While the Federal cracking data could technically be made available if LADOTD s data collection vendor provides the conversion of the raw historical data into the Federal measures. LADOTD decided not to pursue this course of action for several costeffective reasons: First, the 2D data conversion could be incompatible with the new 3D data being captured. There was a possibility that the historical crosswalk differences could easily result in a faulty predictive analysis, which would only become evident as multiple 3D data collection years had passed. Second, LADOTD did not want to complicate the transition from 2D to 3D data already underway. This proved to be prophetic as the analysis conversion was still ongoing months after completion of the data collection effort. Third, LADOTD would have to pay the data collection vendor for the cracking conversion. LADOTD uses a 36 inch wheel path in the PMS analysis while the Federal cracking measure calls for a 39 inch wheel path. In addition, the Composite pavements would have to be completely reanalyzed using the Asphalt protocols, so the conversion would not be a trivial effort. 3-12
45 Fourth, with the missing faulting measures, the data would still be incomplete with respect to determining how effective LADOTD was historically with respect to the Federal measures. Finally, as noted in the previous section, the issue only becomes relevant if LADOTD is approaching the penalty situation of not maintaining the Interstate pavement in excess of the minimum threshold of 5% in poor condition. The analysis at the time of the decision clearly indicated that LADOTD would not threaten the minimum threshold in the foreseeable future. Pavement Data Collection Cycle Pavement Data Collection Cycle Adjustment. Federal network level Interstate and Non- Interstate NHS pavements condition data are currently captured every year, while the LADOTD PMS pavement condition data is captured over a 2-year cycle. In addition to being cost prohibitive to capture the full PMS condition data for all pavements every year, pavements simply do not deteriorate enough in a given year, with limited exceptions (e.g. heavy truck traffic associated with fracking), to require a yearly PMS evaluation. The final federal rule retained the yearly requirement for Interstate network level pavement data collection but relaxed the Non-Interstate NHS pavement data collection requirement to every other year. LADOTD will consider addressing this change in future data collection cycles. Historically, LADOTD started the pavement data collection cycles in July, to coincide with the new state fiscal year. The new federal rules require all NHS pavement data to be collected by December 31 st or the state would, by default, be assessed the 23 CFR Part pavement penalty. LADOTD recognized that in contract renewal years, this could create a problem, so LADOTD shifted future data collection cycle to begin in January. Federal Pavement Reporting Option. 23 CFR Part (1)(iii), allows the state to choose if they want to capture and report the network level federal Interstate pavement data metrics (IRI, rutting, faulting, and Cracking Percent) in both directions. Since the federal pavement distress measures cannot be used in the PMS, and an internal analysis indicates that the PMS condition data in both directions are nearly the same, LADOTD choses to minimize the additional cost, and time requirement, by providing this separate Interstate metric data capture and report requirements only in the primary direction of travel for federal analysis purposes. DOTD intends to only process the Network Level requirements for federal reporting purposes on an annual basis and intends to do the full Project Level PMS data analysis process for the Interstate and Non-Interstate NHS data collection over the 2-year cycle, as it has in the past. Pavement Data Snapshot. As a result of the 2-year data collection cycle, LADOTD s pavement management system has historically used a biannual data snapshot that is created every 2-years in the July-August timeframe. 3-13
46 The analysis in this document uses the 2-year snapshot of data, taken at the end of the state fiscal year and will be referred to as 2016 data going forward. Data Analysis Cycle Adjustment. LADOTD began latest data collection cycle in January 2017, instead of August. LADOTD will make the adjustment for the data snapshot to reflect this January change in data collection cycle start date, so the next 2-year data snapshot will be updated and completed sometime in the Spring of This cycle adjustment is complicated by the fact that one-half of the data was collected using 2D data capture technology and the second half of the collection cycle is using 3D data capture technology. The transitional data, in some cases, is significantly different from the previous data and making sure all data and PMS data range and extent adjustments correlate with 20 years of historical performance curves, is not a trivial effort. This effort must also update and validate the data analysis procedures required to comply with the mandated quality assurance requirements mentioned earlier. That complex effort was still under way when this TAMP document was being finalized, so LADOTD will use the previous 2016 data snapshot for the 2018 TAMP. Doing otherwise could jeopardize the mandatory April 30, 2018 TAMP submittal deadline. Local NHS Pavement Information and Assumptions Local Data Federal Requirement. In 23 CFR 515.7(f) we find that The processes established by State DOTs shall include a provision for the State DOT to obtain necessary data from other NHS owners in a collaborative and coordinated effort. Approach for Local NHS Pavement Data. To ensure data collection on the Local NHS pavements is captured in the same manner as other NHS pavements, LADOTD has agreed to extend the existing pavement data capture effort to include the Local NHS pavement data for the Louisiana MPOs. LADOTD has not previously captured pavement data for the Local NHS routes and will include both the required federal data and the pavement distress data so that data can be included in DOTD s PMS. After (3) three data cycles have been captured LADOTD, will create deterioration curves, which with appropriate funding identified by the Local NHS owners, could then be used to identify future valid performance targets. Recent Local NHS Update. The FHWA has recently determined that all principal arterials would be included in the NHS classification. This initially resulted in an increase of the total mileage the non-state maintained NHS (Local NHS) system. This change led to a comprehensive review of the existing and enhanced Local NHS which resulted in a number of principal arterials being reclassified as Local minor collectors, and subsequently removed from the NHS classification in some MPO areas. Other MPOs are still considering this option but have not yet made a decision on the matter. For the remaining Local NHS roadways and bridges, LADOTD has created a new separate analysis category called Local National Highway System or Local NHS as shown in Table 3-14
47 3.1 above. As these Local NHS roadways are not owned by LADOTD, there is no budget category for them; therefore, PMS and BMS forecast cannot be performed for these assets. Local NHS Pavement Assumptions. As noted earlier, LADOTD has inspection and inventory data for all bridges within the state, including those on the Local NHS but does not currently have data for the Local NHS pavements. Until LADOTD captures 3 cycles of pavement data for the Local NHS system, LADOTD will assume that Local NHS will perform like the Non- Interstate NHS. For the remainder of this document, this assumption will be a matter of record and readers should assume the Non-Interstate NHS data analysis, charts, tables and figures represent the Local NHS system as well. PMS Pavement Condition Data Collection Since 1995, LADOTD has been collecting project level pavement condition data on a variety of pavement distress types. At this time a number of data items are captured for analysis. Condition Data. The condition data items listed below are captured at least every (2) two years and are used within the Pavement Management System to assess current and projected pavement conditions. Rutting the longitudinal depressions in the wheel paths of an asphalt pavement surface. Faulting the vertical misalignment of pavement joints, in the right wheel path, on jointed concrete pavements. International Roughness Index (IRI) the most commonly used worldwide pavement roughness measure of surface deviations associated with vehicle dynamics and ride quality. Longitudinal Cracking the cracks in pavements that are predominantly parallel to the direction of traffic and are not defined as Fatigue Cracks. Transverse Cracking - the cracks in pavements that are predominantly perpendicular to the direction of traffic and are not defined as Fatigue Cracks. Fatigue (alligator) Cracking - the cracking located in both 36 inch wheel paths on Asphalt Pavements (ASP) only. Patching - An area of pavement surface that has been repaired, with the addition of new material to correct an irregularity in the pavement surface, that has not been performed as part of the original construction. Texture - Macro texture is a property related to friction, that is relatively inexpensive to collect, and is used to identify potential locations for pavement skid resistance testing. This measure is captured for the Safety Section and is not currently used by the PMS for condition assessment or condition forecasts but is informally used by the PMS engineer as a reference check in assessment outcomes. 3-15
48 Friction the measure is captured on an as needed basis using a pavement skid resistance testing system fully identified in ASTM E274. This measure is captured for the Safety Section and is not currently used by the PMS for condition assessment or condition forecasts but is informally used by the PMS engineer as a reference check in assessment outcomes. Pavement Condition Indexing. Pavement management systems require an equitable analysis of the various pavement condition data. For instance, cracking and patching, are each captured with low, medium and high severity levels, representing different noncompatible data ranges and values. There are also units of measure issues between various pavement condition measures. To address these different data ranges and values, various Pavement Distress Indexes were created and calculated for the various distresses. These indexes, shown below, are based on a scale from 1 to 100, with 100 being perfect. Various combinations of these indexes then generate a composite index for the four different pavement types, or Asset Sub- Groups, identified earlier. Alligator Cracking Index Random Cracking Index Patching Index Rutting Index Roughness Index Transverse Cracking Index Longitudinal Cracking Index PMS Project Level Assessment. LADOTD s PMS uses all of these pavement condition index data to assess the overall condition of a pavement segment and then uses this information to identify the most appropriate pavement treatments for each homogenous segment of roadway. Note the Federal network level assessment is based on mile segments. This is considered to be a project level assessment. For instance, on flexible (Asphalt) pavements, various treatment triggers are based on Alligator, Random, Patching, Rutting, and Roughness indexes. These trigger values appropriately vary for different highway systems, i.e. Interstate and Collector triggers are not the same. For a generalized list of PMS pavement treatments, or work types, see the Appendix, LADOTD Pavement System Treatments. 3.6 ONGOING REGIONAL HIGHWAY SYSTEM INVENTORY REDUCTION The cyclical economic downturns over the past few decades have clearly sent the message that the past concept of infrastructure expansion as a primary tool for future economic development and prosperity, had to give way to a focus on the long term requirements of 3-16
49 life cycle cost based sustainability. Recognition of these hard facts by LADOTD years ago has led to ongoing efforts to change the culture and inform stakeholders of this move away from capacity projects toward preservation. Road Transfer Program. One of the most recent innovative efforts to address this in Louisiana is the Road Transfer Program (RTP) described in the April 2013 policy document Right-Sizing the State Highway System: A Voluntary Road Transfer Program. The goal of the RTP is to right-size the overall State Highway System to achieve the national average of 19 percent State ownership of public road mileage. This program was initiated to address the fact that Huey P. Long, and those that followed him, converted a significant number of local roads to state-maintained roads. As a result, LADOTD maintains an unsustainable 27 percent of the public road mileage in Louisiana, while the national average is approximately 19 percent. Once again, it is necessary to reference the fact that the RHS represents 39.1% of the total state-maintained lane mileage but carries only 4.9% of the total state maintained VMT. LADOTD has identified approximately 5000 miles of State roads that do not fit the State's highway network role. The program involves transferring ownership of these roads to local governments. This opportunity is viewed as a way to reduce the size of LADOTD regional assets while rectifying the inequities in the distribution of State highway miles among parishes, and empowering local governments through the right-sizing of the State highway system. Participation in the program is voluntary. Roads are repaired prior to transfer and the receiving local governments are credited for 40 years of routine and capital maintenance, which can be applied to any highway capital project(s). The program has so far appealed to those parishes and municipalities that have the capacity for additional day-to-day road maintenance, but lack the resources for capital improvements. Status of RHS Reduction. As of March 2018, LADOTD has transferred centerline miles of Regional Highway System routes, along with the 18 bridges on those roadways, to local governments. Additionally, LADOTD has cooperative endeavor agreement contracts in place to transfer additional centerline miles as soon repairs are completed on these pavements. LADOTD is currently negotiating to transfer another miles through this program. 3.7 BRIDGE SYSTEM SUMMARY Asset Classes and Sub-Groups. NHS Bridges make up the asset classes while asset subgroups are made up of the bridge types of Prestressed, Slab, Movable, etc. Note the Federal TAMP is based only on the NHS bridge asset class with the Non-NHS bridges included for reference purposes only. 3-17
50 Federal Network Level Bridge Analysis. Unlike the federal pavement requirements, the federal bridge network level requirements closely mirror the historical project level aspects of the Bridge Management System (BMS) and at this time can be easily addressed without complications using the old AASHTO PONTIS BMS. State Maintained Bridge Inventory The bridge data analysis, found in the 2018 TAMP, is based on the federally required 2017 National Bridge Inventory (NBI) submittal and represents inventory data for the 2016 calendar year. The FHWA defines a structure as a bridge, or a culvert, over 20 feet in length as measured along the centerline of the roadway. In the 2017 NBI data, 7,811 state-maintained and Local NHS structures, representing 160,375,970 square feet of deck, met that bridge criteria. Table 3.3 below identifies that the 2,977 Interstate, Non-Interstate NHS and Local NHS bridges combine to represent 127,596,675 square feet of deck area or 79.6 percent of the total bridge deck area of all state-maintained and Local NHS bridges. It is important to note that the Local NHS bridges include the 7,934,283 square feet of deck area on the 23 mile long Lake Pontchartrain causeway, or 98.5% of the Local NHS deck area. Alone, these two structures represent more deck area than the entire RHS with 6,805,279 deck area on 1,584 bridges. Table Bridge Count By Asset Class Asset Class Bridge Count Bridge Deck Area % Deck Area State & Local NHS 2, ,596, % State Owned Non-NHS 4,834 32,779, % Totals 7, ,375,970 Age of Bridges Based on the 2017 NBI data, Figure 3.9 below shows the actual age of State maintained bridges, built by decade, that are still in service. The data shows that 59.3% of all statemaintained bridges are already over 40 years old with the Interstate system contributing significantly to the number of bridges built in the 1960 s and 1970 s. Recent analyses performed by the AME for the TAMP, have provided Bridge Design with the identify of bridges with ratings that are approaching the lower limits of the Good and Fair 3-18
51 ranges. This list of bridges will be used by the Bridge Preservation Project Selection Team to aid in selecting specific deck, substructure, or superstructure projects that will help to retain a state of good repair for these bridges. Figure 3.9 Number of State Owned Bridges Built By Decade 3.8 BRIDGE CONDITION DATA Federal Data Requirements. The requirement of 23 CFR 515.7(g) is that State DOTs shall use the best available data to develop their asset management plans. Local Data Federal Requirement. In 23 CFR 515.7(f) we find that The processes established by State DOTs shall include a provision for the State DOT to obtain necessary data from other NHS owners in a collaborative and coordinated effort. Bridge Condition Data Collection Federal NBI Bridge Inspections and Reporting. LADOTD is responsible for federal mandated inspections on all bridges in Louisiana, including Local NHS bridges. Bridge inspections capture both the federal National Bridge Inventory (NBI) component level 3-19
52 (superstructure, substructure, deck) data along with the FHWA recently expanded data collection and reporting requirements that include element level (girders, decks, piles, etc.) data. LADOTD chose to capture both via inspection efforts rather than to use the BMS to provide for a conversion from the component items to the element items. LADOTD is fully compliant with both of these data requirements. Bridge Performance Measures Federal Requirement. In 23 CFR Part (a) the FHWA identified that State DOTs will maintain bridges so that the percentage of the deck area of bridges classified as Structurally Deficient does not exceed 10.0 percent. According to the FHWA, a bridge is structurally deficient if the load-carrying elements are in diminished condition due to deterioration and/or damage. It is most important for the public to understand that Structurally Deficient bridges generally require traffic and/or load posting restrictions and will remain safe for travel as long as trucks exceeding the posted load limit do not cross that bridge. Bridges that are considered unsafe are closed until they can be repaired or replaced. If funding for extensive repairs or replacement does not appear to be available in a reasonable time, complete removal of these unsafe bridges may be the correct option. LADOTD Bridge Performance Measure. LADOTD adopted the performance measure of percent of structurally deficient bridges by deck area after the Katrina/Rita hurricane events in Louisiana significantly impacted bridges. LADOTD is fully compliant with this structurally deficient bridge requirement. 3.9 ADDRESSING LARGE OUTLIER BRIDGES Of the 7811 NHS, Local NHS and Non-NHS state maintained bridges in the 2017 NBI bridge data, 123 have a deck area exceeding 175,000 square feet. These 123 bridges, while representing only 1.5% of the total number of bridges, represent over 49.6% of the total bridge deck area for the three identified asset classes. > 175,000 deck area Count Deck Area NHS ,840,791.6 Local NHS 2 7,934,283.0 Non-NHS 16 4,697,179.2 The July 2012 report FHWA- HEP , Asset Total ,472,253.8 Sustainability Index: A Proposed Measure for Long-Term Performance introduces the concept of infrastructure assets defined as Outliers. The following excerpt is taken from the report. 3-20
53 These outliers could include the maintenance, preservation and repair/replacement costs of items such as aged, high-cost unique bridges, or the repair of pavements in very high-volume highways, or the replacement of structures under very-high traffic volumes. These types of assets can have much higher-than-average costs that skew the basic unit costs used in these calculations. One typical way to address this issue is to separately categorize and plan for these high cost facilities as a separate class of assets. States have grouped their unique and highcost bridges and planned for them separately. Each such unique structure generally requires a more detailed engineering analysis to determine its preservation needs and costs for a long horizon, such as 10 years. By categorizing these structures and assessing them individually a more accurate planning estimate for their investment can be developed. LADOTD Position. LADOTD recognizes this critical issue but with the ongoing fiscal limitations, funding is simply not available to deal with this looming issue. When long term funding issues are resolved, LADOTD will make every attempt possible to provide dedicated funding for this outlier bridge asset class. Until then, each of the NHS outlier bridge assets have the potential to push LADOTD into the NHS bridge performance penalty situation, that is detailed in chapter 4 of this document. 3-21
54
55 4.0 Performance and GAP Analysis 4.1 INTRODUCTION This section reviews FHWA guidance on target setting and then identifies how LADOTD sets performance targets for NHS pavements and bridges. It then reviews the historical and current performance of Interstate pavements, Non-Interstate pavements and NHS bridges. Next the section reviews the outcomes of the projected funding scenarios identified below and determines the Federal 2-year and 4-year performance targets. GAP analyzes are then performed against a baseline, the current funding and the desired state of good repair funding. As documented in Chapter 3, LADOTD uses the PMS to forecast pavement conditions based on a number of condition indexes. These forecasts allow LADOTD to determine what funding allocations will allow pavement assets to meet desired performance goals. For this analysis, LADOTD has evaluated the following Life Cycle Planning (LCP) scenarios: Current Funding Scenario. This scenario identifies the pavement performance that will be achieved with current projected funding over the 10-year analysis period. Desired State of Good Repair Scenario. LADOTD has also identified a funding level that is capable of maintaining pavements at or near the current condition state as identified by PMS performance analysis, not Federal performance analysis. This scenario, and the resulting forecasted 10-year conditions levels, will be analyzed against the current asset condition which defines LADOTD s Desired State of Good Repair. Desired State of Good Repair (DSGR) Federal Requirement. 23 CFR 515.9(d)(1) identifies the minimum content for the TAMP asset management objectives with respect to achieving and sustaining the State of Good Repair : Asset management objectives. The objectives should align with the State DOT's mission. The objectives must be consistent with the purpose of asset management, which is to achieve and sustain the desired state of good repair over the life cycle of the assets at a minimum practicable cost. LADOTD defines the desired state of good repair as maintaining NHS pavements and bridges at or near the current condition state. This supports the federal requirement identified here. Federal Target Setting Guidance In the FHWA s 2013 Performance Based Planning and Programming Guidebook, chapter 5 identifies that a Performance Based Planning and Programming (PBPP) process requires the 4-1
56 identification of desired trends (e.g., reduce, increase, maintain) or targets (specific numerical figures) associated with the performance measure in order to provide direction to strategy analysis and performance tracking. In order to develop a target, it is important to analyze baseline data to understand past trends in performance, as well as conduct analyses of expected performance to account for factors that will affect performance in the future, including levels of available funding. In the absence of valid historical data, the initial effort will be to identify a directional target or desired trend. As LADOTD captures Federal network level data over multiple data collection cycles LADOTD will have more information to develop realistic targets. Trends and targets are defined in different ways: Directional (Desired Trends) Before developing a specific numerical target, an agency may simply identify a direction of impacts desired (e.g., Reduce the Number of Structurally Deficient Bridges). This step provides direction for strategy evaluation, is relatively easy to do, and serves as the initial basis prior to developing data verifiable specific numerical targets. Aspirational Aspirational targets are developed as a basis for evaluation, often prior to conducting detailed analysis. An aspirational target may also be selected to reflect a policy priority, to signal the importance of an issue, or to reflect a broader societal target, even if it may not be realistic for transportation. For instance, zero fatalities is an example of an aspirational target, reflecting the belief that even one fatality is too many, and so the target should reflect the ultimate aim of society. As a result, decisionmakers must recognize what an aspirational target represents. Aspirational targets like this are useful in making clear to policy makers and the public that more needs to be done to achieve ultimate aims. o New Year s resolutions and athletic targets would be considered personal aspirational targets. Realistic Realistic targets take into account available funding, resources, trends, risks, other competing objectives, and factors that may affect performance. They are designed to provide a basis for assessing and tracking actual progress toward a goal that is believed to be attainable. o Preparing food and beverages, along with cleaning the house and yard, in adequate time for a party would be considered personal realistic targets. Although there is no right or wrong way to establish targets, there may be value in starting with a directional or aspirational target as overall target for society, recognizing that there are many factors that affect the ability to meet these targets and the role of transportation agencies in this context. Then, when more data are available, realistic targets may be developed. 4-2
57 Other considerations in setting targets include whether the target should be: a specific number, a percentage reduction/increase from a baseline (e.g., to 10% below current levels), or set to a particular benchmark (e.g., to national average, to year 2000 levels). FHWA Target Setting Terminology. Target setting is a data driven collaborative process that determines what an agency realistically expects to achieve within a specific time frame. Additional terminology is provided in the inset. Target Setting Terminology Baseline Projection Forecast The observed level of performance for a specified performance period from which implementation begins, improvement is judged, or comparisons is made An estimate of future conditions based on a current historical trend A PMS or BMS based prediction of a future condition External Factors. The 2-day FHWA led National Highway Institute course , Effective Target Setting for Transportation Performance Management, identifies a number of external factors outside the agency s control that affect target setting. Traffic Weather Gas Prices Economy Legislative Requirements Population Vehicle Registration Demographic Shifts External Target Setting Factors These external factors must be considered when an agency is setting performance targets. Modal Shares Zones of Disadvantaged Populations Land Use Characteristics Peer Agency Targets Vehicle Characteristics Driver Behavior Politics 4.2 METHOD FOR SETTING PERFORMANCE TARGETS LADOTD s strategic plan effective through June 2022, sets forth agency performance targets including performance targets for all pavement and bridge conditions. This strategic effort is a responsibility of the Executive Committee. This past target setting methodology, with respect to pavement and bridge conditions, relied strictly on historical performance. Going forward, the Asset Management Engineer (AME) will identify potential data driven performance targets for NHS pavement and bridge, that will be based on data analysis that considers both historical projections and management system forecasts. The remainder of the performance targets will remain with the strategic planning effort. The AME will recommend these performance targets to the TAM Steering Committee, led by the Executive Champion. The TAM Steering committee will evaluate the AME potential recommendations and then make its final recommendations to the Executive Committee as shown below in Figure
58 All performance targets will continue to be approved by the Executive Committee which is comprised of the Secretary, the Deputy Secretary, the Undersecretary of Management and Finance, the Assistant Secretary of Planning, the Chief Engineer, and the Assistant Secretary of Operations. Figure 4.1 NHS Performance Target Recommendations 4.3 PAVEMENT PERFORMANCE PENALTY It is the intent of LADOTD to ensure that LADOTD takes every possible step to avoid a penalty assessment as the outcome of a penalty assessment is that federal aid eligible statemaintained routes will lose a significant source of funding. 4-4
59 Federal Requirement. 23 CFR Part (a) establishes that the percentage of lane-miles of Interstate System in Poor condition shall not exceed 5.0 percent. Federal Requirement. 23 CFR Part (a) establishes the penalty for exceeding the 5.0 percent minimum. (1) Obligate, from the amounts apportioned to the State DOT under 23 U.S.C. 104(b)(1) (for the NHPP), an amount that is not less than the amount of funds apportioned to the State for Federal fiscal year 2009 under the Interstate Maintenance program for the purposes described in 23 U.S.C. 119 (as in effect on the day before the date of enactment of the MAP-21), except that for each year after Federal fiscal year 2013, the amount required to be obligated under this clause shall be increased by 2 percent over the amount required to be obligated in the previous fiscal year; and" (2) Transfer, from the amounts apportioned to the State DOT under 23 U.S.C. 104(b)(2) (for the Surface Transportation Program) (other than amounts sub-allocated to metropolitan areas and other areas of the State under 23 U.S.C. 133(d)) to the apportionment of the State under 23 U.S.C. 104(b)(1), an amount equal to 10 percent of the amount of funds apportioned to the State for fiscal year 2009 under the Interstate Maintenance program for the purposes described in 23 U.S.C. 119 (as in effect on the day before the date of enactment of the MAP-21) Penalty Assessment Calculation. In 2009, the relevant apportioned funding was $92.2 million to Louisiana. So, increasing that total by 2% compounded annually since 2009 yields a 2019 NHPP obligation total of $112.4 million. The additional transfer of $9.2 million from the federal Surface Transportation Program would create the 2019 total penalty of $121.6 million if it would be assessed. Note that the 2% compounding total never goes away, so this total would increase each year going forward should LADOTD incur a penalty assessment. The impact of a penalty assessment would be the reduction of funds available for Federal Aid eligible non-nhs pavements, essentially compounding the funding shortfall that already exists for these pavements. 4.4 PAVEMENT GAP ANALYSIS Federal Requirements. 23 CFR 515.7(a) The TAMP must describe a methodology, with regard to the physical condition of the assets, for: Identifying gaps affecting the State DOT targets for the condition of NHS pavements and bridges as established pursuant to 23 U.S.C.150(d). Identifying deficiencies hindering progress toward achieving and sustaining the desired state of good repair (as defined by the State DOT). Developing alternative strategies that will close or address the identified gaps. 4-5
60 The TAMP must describe a methodology for analyzing gaps in the performance of the NHS that affect NHS bridges and pavements regardless of their physical condition, that will: Identify gaps in the effectiveness of the NHS in providing safe and efficient movement of people and goods. (23 CFR 515.7(a)(2)). Identify strategies to close or address the identified gaps affecting the physical assets. (23 CFR515.7(a)(3)). Pavement GAP Methodology LADOTD Pavement GAP Methodology. With the desire to do no worse than maintain the current condition of both the Interstate and Non-Interstate NHS pavement conditions, LADOTD evaluated a number of different funding scenarios to identify the projected funding that will, via PMS forecasts, maintain the conditions of these pavements at or very near their current condition. The condition outcomes of these different funding scenarios were then evaluated against both federal and state condition targets, to identify appropriate issues and gaps that could prevent LADOTD from reaching those targets. This effort afforded LADOTD a preemptive opportunity to remedy these issues and gaps going forward by selecting the funding scenario that maintains these pavements at or near their current condition. This strategy will continue to be the approach going forward with respect to Interstate and Non- Interstate NHS pavements. As LADOTD goes forward, it will also integrate the TAMP with the Highway Safety Improvement Program (HSIP) and the Louisiana Freight Mobility Plan to further coordinate project selection strategies ensuring that there are no gaps in the effectiveness of the NHS in providing safe and efficient movement of people and goods. To gain more control over potential deficiencies hindering progress toward achieving and sustaining the earlier defined DSGR, LADOTD adopted the following strategies, to address the identified gaps: Created a dedicated funding source for Non-Interstate NHS pavements and Modified the Non-Interstate project selection process. Short of funding limitations, these changes, along with the existing Interstate methodologies, will provide the ability to closely manage all factors affecting performance gap assessment going forward. These efforts described above represent the actual strategies implemented to close the gaps that will be identified later in this chapter. Should any additional gaps be identified, additional alternative strategies will be explored to address those gaps. 4-6
61 4.5 INTERSTATE PAVEMENT PERFORMANCE ASSESSMENT Incomplete Data Situation. As noted before, LADOTD currently cannot project federal performance with historical data, nor forecast federal performance via the PMS, based on the new federal measures for the Interstate or Non-Interstate NHS pavement asset classes. While the initial set of data supporting the federal measures has been captured, one baseline data point is not sufficient to make any reasonable conclusions or predictions of performance, especially since the data quality assurance and quality control efforts were ongoing at the time this document was being finalized. Note that this initial data collection is a full year ahead of the mandated data collection requirement for these data items. Alternative Investigation. Using historical data, LADOTD decided to investigate and identify the Good, Fair and Poor pavement conditions based on the IRI parameter only. This information is provided as a reference point that will, in future years, be compared to an assessment of Federal measures to determine if a correlation exists. For now, this is the 23 CFR 515.7(g) best available data LADOTD has to investigate historical and current performance. Historical IRI Interstate Pavement Performance The analysis of historical Interstate pavements in Figure 4.2 below indicates that, based on IRI only, the percentage of pavements in Good condition has continued to increase while the percentage of Poor pavements has consistently declined. Note in the figure years indicates multi-year data collection cycles as described earlier. 4-7
 Current Interstate Pavement Performance Due to the TAMP submittal deadline of April 30, 2018, LADOTD is not able to provide a complete")
62 Figure 4.2 Historical Interstate Pavement Conditions (based on IRI only) Current Interstate Pavement Performance Due to the TAMP submittal deadline of April 30, 2018, LADOTD is not able to provide a complete review of the recently collected Interstate data with respect to the new federal performance measures in this TAMP. LADOTD is however able to very quickly identify conditions that result from an analysis of IRI conditions as shown in Table 4.1 below. It should be noted that while LADOTD is submitting all federal measures for the 2018 HPMS submittal, IRI data is the only required data for that submittal, with the remainder of the measures due in the 2019 HPMS submittal. Currently, based on IRI only, 66.4% of Interstate pavements are in Good condition. This is a slight decrease from the historical conditions above but note that the resulting increase came in Fair condition pavements, while the Poor conditions pavements has continued to hold steady at 2.1% when compared to the historical Interstate pavement IRI conditions shown above in Figure
63 Table 4.1 Current Interstate Pavement Conditions (PMS Analysis Lane Mileage based on Federal IRI values only) Pavements PMS Analysis Lane Miles Good Fair Poor Interstate 1, % 31.5% 2.1% Forecast of Current Interstate Funding Scenario Current Interstate Funding. LADOTD s current Interstate funding projection is $33 million increased at 2% per year for 10 years, noting that this is the actual available total after Preconstruction and (CE&I) Construction, Engineering, Inspection totals are removed. Interstate Forecast. The PMS forecasts, shown below in Figure 4.3, indicates that LADOTD was able to allocate sufficient funds to forecast a very slight decline in pavements in Good condition while reducing even further the percentage of pavements in Poor condition. This projected budget allocation was the results of numerous budget runs, using different funding ranges, which is a significant benefit of having a fully functional PMS. While the PMS forecasts the percentage of Good Interstate pavements to decrease slightly to 64.3% in 2027, the percentage of Poor Interstate pavements is forecast to further decrease to 1.1% in Caveat Emptor or Let the Buyer Beware. There is a disconnect between this IRI based historical and current analysis versus the PMS forecasted condition analysis since the historical and current analysis is based solely on IRI and the forecasted condition uses all pavement index conditions. Note also that neither effort is able to use the new Federal performance measures. Without data, LADOTD cannot make a determination as to whether the Federal performance measures will assess pavement conditions at a higher or lower level than the PMS forecasted conditions; nevertheless, this projected budget appears, via PMS forecasts, to keep LADOTD significantly away from the penalty assessment level of a minimum of 5% in Poor condition. 4-9
64 Figure 4.3 Forecasted Interstate Pavement Conditions for Projected Funding (using PMS index values) Interstate Desired State of Good Repair We again reference that LADOTD s current condition of Interstate pavements, as shown above in Table 4.1, is designated as the desired state of good repair and determine that value to be 2.1%. This current condition is based on the 2018 HPMS data, that actually represents the 2017 pavement condition, was being finalized and submitted just as the update of this document was being completed. The 2018 PMS condition projection, in Figure 4.3 above, represents the projected pavement condition for 2018, not 2017, but it is based on an analysis of PMS index values, instead of IRI found in Table 4.1. Since the current DSGR, is based on the historical and current IRI analysis only, LADOTD will consider this initial 2.1% as a baseline target value only and will completely reevaluate this analysis after multiple years of the Federal network level data are compared to PMS forecasts. Federal Pavement Performance Targets Federal Requirement. 23 CFR Part (e)(4)(iii) requires that State DOTs shall establish 2-year targets that reflect the anticipated condition/performance level at the midpoint of each 4-year performance period for the condition of pavements on the Interstate System, the condition of pavements on the NHS (excluding the Interstate) and for the condition of bridges on the NHS. 4-10
65 Additionally, 23 CFR Part (e)(4)(iv) requires that State DOTs shall establish 4-year targets that reflect the anticipated condition/performance level at the end of each performance period for the same measures. Federal Interstate Pavement Targets External Factors and Unknowns. As noted earlier in this chapter, there are a number of external factors outside the agency s control that affect target setting. Given the current statewide budget deficit, loss of funds due to inflation eroding Transportation Trust Fund dollars, and a political climate that does not suggest additional funding, LADOTD has made the reasonable assumption that the current projected funding levels, while currently valid, could actually be strained even further in the future. LADOTD is also very aware that other state DOTs that have access to historical federal data have struggled to find a correlation between the Federal network level measures and their PMS measures. With the significant number of external factors and a complete lack of data to base the targets on, LADOTD will take a very conservative approach in the initial Interstate Federal 2- year and 4-year target setting. 2-Year Interstate Target. Based on these concerns and the lack of data for an analysis, LADOTD has identified the very conservative TAMP 2-year interstate pavement condition targets as 40% in Good condition and no more than 5% in Poor Condition. 4-Year Interstate Target. Based on these concerns and the lack of data for an analysis, LADOTD has identified the very conservative TAMP 4-year interstate pavement condition targets as 40% in Good condition and no more than 5% in Poor Condition. 4.6 INTERSTATE PAVEMENT GAP ANALYSIS LADOTD Interstate Pavement GAPs Defined. LADOTD has identified the following gap analysis definitions, based on the percentage Poor Interstate pavement conditions, to assess Interstate performance: Interstate Target. LADOTD has defined the initial Interstate target of no more than 5% in Poor condition. Baseline GAP. The gap between current percentage Poor condition, as identified above in Table 4.1, and the LADOTD target for percentage Poor Interstate pavements. Current Funding GAP. Perform a 10-year pavement analysis using the current available funding. Determine this GAP using the percentage Poor value in the final year of the analysis against the LADOTD target for percentage Poor Interstate pavements. Desired State of Good Repair Funding GAP. Perform a 10-year pavement analysis using a funding level that retains the current level of percentage Poor Interstate pavements. Determine this GAP using the percentage Poor value in the final year of the analysis against 4-11
66 the LADOTD target for percentage Poor Interstate pavements. Note that DSGR is a steady state funding scenario. Understanding GAP Analysis Outcomes. Table 4.2 below shows the gap analysis for Interstate pavements. A positive value in the % Poor minus Target column translates to a need to reduce the percentage of poor conditions. A negative value indicates that no gap currently exists. Interstate Pavement GAP Analysis GAP Analysis Outcomes. Table 4.2 below identifies the actual percentage of Poor condition for each GAP being analyzed. Then that percentage of Poor pavements is measured against the initial 5% target. Based on this analysis, there are currently no predicted gaps for the Interstate pavements. LADOTD is able to provide sufficient available funding to achieve the DSGR, or steady state funding, over the 10-year analysis period, based on PMS forecasts. Most importantly, the Federal Minimum of 5% Poor is not exceeded with the current available funding. Table 4.2 Interstate Pavement GAP Analysis LADOTD Target 5% Baseline GAP Current Year Current Funding GAP 10 Year Forecast DSGR GAP 10 Year Forecast % Poor for Identified GAP % Poor minus Target 2.1% -2.9% 1.1% -3.9% 1.1% -3.9% 4.7 NON- INTERSTATE NHS PAVEMENT PERFORMANCE ASSESSMENT Incomplete Data Situation. As noted before, LADOTD currently cannot project federal performance with historical data, nor forecast federal performance via the PMS, based on the new federal measures for the Interstate or Non-Interstate NHS pavement asset classes. Assumption. LADOTD makes the assumption that the Local NHS pavement assets will perform in a similar manner to the Non-Interstate NHS pavement assets. 4-12
67 Analysis. Using historical data, LADOTD decided to identify the Good, Fair and Poor pavement conditions based on the IRI parameter only. This information is provided only as a reference point that will in future years be compared to an assessment of Federal metrics and their measures to determine if a correlation exists. For now, this IRI analysis is the 23 CFR 515.7(g) best available data LADOTD has to investigate historical and current performance. Historical Non-Interstate NHS Pavement Performance The analysis of historical Non-Interstate NHS pavements shown in Figure 4.4 below indicates that, based on IRI, the percentage of pavements in Good condition had increased in the early years, but has held somewhat steady for the most recent four data collection cycles. The percentage of Poor pavements also declined from a high of 15.5% down to a low of 6.2% but has risen to 10.0% over the most recent two data collection cycles. Note that in the figure years indicates multi-year data collection cycles as described earlier. Early Performance Swing. As we further review the historical data, we identify significant swings in Non-Interstate pavement conditions at various points in the past, which should typically be rare occurrences. The initial swing resulting in the increase of Good pavements along with the reduction of Poor pavements is attributed to the completion of the (TIMED) Transportation Infrastructure Model for Economic Development program which was dedicated to the Non-Interstate NHS pavements. Later Performance Swing. The later swing of increasing Poor pavement and decreasing Good pavements can be mostly attributed to the federal requirement to add all principal arterials to the NHS. As a result of this analysis, LADOTD will continue to further analyze these pavements going forward and continue to watch for any potential issues that might cause additional abnormal swings. Again, as of Fiscal Year , LADOTD now has a dedicated budget category for these Non-Interstate NHS pavements. Project treatments and project selections will be administered at Headquarters mirroring the Interstate program methodologies. This modification is a direct result of TAMP analysis efforts. 4-13
 Current Non-Interstate NHS Pavement Performance Due to the TAMP submittal deadline of April 30, 2018, LADOTD is not able to")
68 Figure 4.4 Historical Non-Interstate NHS Pavement Conditions (based on IRI only) Current Non-Interstate NHS Pavement Performance Due to the TAMP submittal deadline of April 30, 2018, LADOTD is not able to provide a complete review of the recently collected Non-Interstate NHS data with respect to the new federal performance measures in this TAMP. LADOTD is however able to very quickly identify conditions that result from an analysis of IRI conditions as shown in Table 4.3 below. LADOTD fully expects that when all the federal measures are included in the future data analysis, these measures could very well paint a different picture than the historical IRI only analysis in Figure 4.4 above. It should be noted that while LADOTD is submitting all the proposed federal measures for the 2018 HPMS submittal, IRI data is the only required data for that submittal, with the remainder of the measures due in the 2019 HPMS submittal. Currently, based on IRI only, 47.4% of Non-Interstate NHS pavements are in Good condition as shown in Table 4.3 below. This is a significant change from the historical conditions in Figure 4.4 above. A sizable change also occurred in current Fair (35.6%) condition pavements and in the Poor (17.0%) condition pavements. Again, LADOTD will continue to further analyze these pavements going forward to identify any potential issues that might be the cause of these relatively abnormal swings. 4-14
69 Table 4.3 Current Non-Interstate NHS Pavement Conditions (PMS Analysis Lane Mileage based on Federal IRI values only) Pavements Non-Interstate NHS PMS Analysis Lane Miles Good Fair Poor 3, % 35.6% 17.0% Forecast of Current Non-Interstate NHS Funding Scenario Current Non-Interstate NHS Funding. LADOTD s current Non-Interstate NHS funding projection is $83 million increased at 2% per year for 10 years, noting that this is the actual available total after Preconstruction and (CE&I) Construction, Engineering, Inspection totals are removed. Non-Interstate NHS Forecast. The initial years of the Figure 4.5 PMS index-based forecasts shown below, seem to completely contradict the final year trends of the Figure 4.4 IRI based historical analysis shown above. LADOTD s has significant confidence in the indexbased PMS forecast as they are much more reliable than a singular IRI condition historical analysis could be. So, ignoring the IRI only analysis of Figure 4.4 above and focusing on the more reliable index-based analysis of Figure 4.5 below, it appears that LADOTD was able to allocate sufficient funds to flip the trends of decreasing Good condition and increasing Fair condition pavements; however, in the out years there is a rapid decline in Fair condition pavements and the uptick in Poor condition pavements. Note again that this projected budget allocation was the results of numerous budget runs, using different funding ranges, which is a significant benefit of having a fully functional PMS. While the PMS forecasts the percentage of Good Non-Interstate NHS pavements to increase significantly to 69.9% in 2027, the percentage of Poor Interstate pavements remains very steady until it is forecast to increase to 8.0% in 2026 and 10.9% in Caveat Emptor or Let the Buyer Beware. Again, based on the analysis of these figures, we note that there is a disconnect between the IRI only analysis versus this PMS index-based forecasts. Note also that neither effort uses the new Federal performance measures. At this time LADOTD cannot make a determination as to whether the Federal performance measures will assess pavement conditions at a higher or lower level than the PMS forecasted conditions. Note that there is currently no penalty assessment level or minimum condition for Non- Interstate NHS pavements. 4-15
70 Figure 4.5 Forecasted Non-Interstate NHS Pavement Conditions for Projected Funding (using PMS index values) Desired State of Good Repair Non-Interstate NHS Scenario We again reference that LADOTD s current condition of Non-Interstate NHS pavements is designated as the desired state of good repair and determine that value to be 17.0%. Since the current DSGR, is based on the historical and current IRI analysis only, LADOTD will consider this initial 17.0% as a baseline value only and will completely reevaluate this analysis after multiple years of the Federal network level data are compared to PMS forecasts. Federal Pavement Performance Targets Federal Requirement. 23 CFR Part (e)(4)(iii) requires that State DOTs shall establish 2-year targets that reflect the anticipated condition/performance level at the midpoint of each 4-year performance period for the condition of pavements on the Interstate System, the condition of pavements on the NHS (excluding the Interstate) and for the condition of bridges on the NHS. Additionally, 23 CFR Part (e)(4)(iv) requires that State DOTs shall establish 4-year targets that reflect the anticipated condition/performance level at the end of each performance period for the same measures. 4-16
71 Non-Interstate NHS Pavement Targets External Factors and Unknowns. As noted earlier in this chapter, there are a number of external factors outside the agency s control that affect target setting. Given the current statewide budget deficit, loss of funds due to inflation eroding Transportation Trust Fund dollars, and a political climate that does not suggest additional funding, LADOTD has made the reasonable assumption that the current projected funding levels, while currently valid, could actually be strained even further in the future. LADOTD is also very aware that other state DOTs, that have access to historical federal data, have struggled to find a correlation between the Federal network level measures and their PMS measures. With the significant number of external factors and a complete lack of data to base the targets on, LADOTD will take a very conservative approach in the initial Non-Interstate NHS Federal 2-year and 4-year target setting. 2-Year Non-Interstate NHS Target. Based on these concerns and the lack of data for an analysis, LADOTD has identified the very conservative TAMP 2-year Non-Interstate NHS pavement condition targets as 20% in Good condition and no more than 20% in Poor Condition. 4-Year Non-Interstate NHS Target. Based on these concerns and the lack of data for an analysis, LADOTD has identified the very conservative TAMP 4-year Non-Interstate NHS pavement condition targets as 20% in Good condition and no more than 20% in Poor Condition. Note again there is no federal minimum performance level for Non-Interstate NHS pavements. 4.8 NON-INTERSTATE NHS PAVEMENT GAP ANALYSIS LADOTD Interstate Pavement GAPs Defined. LADOTD has identified the following gap analysis definitions, based on the percentage Poor Non-Interstate NHS pavement conditions, to assess Interstate performance: Non-Interstate NHS Target. LADOTD has defined the initial Interstate target of no more than 20% in Poor condition. Baseline GAP. The gap between current percentage Poor condition, as identified in Table 4.3 above, and the LADOTD target for percentage Poor Non-Interstate NHS pavements. Current Funding GAP. Perform a 10-year pavement analysis using the current available funding. Determine this GAP using the percentage Poor value in the final year of the analysis against the LADOTD target for percentage Poor Non-Interstate NHS pavements. Desired State of Good Repair GAP. Perform a 10-year pavement analysis using a funding level that retains the current level of percentage Poor Non-Interstate NHS pavements. 4-17
72 Determine this GAP using the percentage Poor value in the final year of the analysis against the LADOTD target for percentage Poor Non-Interstate NHS pavements. Note that DSGR is a steady state funding scenario. Understanding GAP Analysis Outcomes. Table 4.4 below shows the gap analysis for Non- Interstate NHS pavements. A positive value in the % Poor minus Target column translates to a need to reduce the percentage of poor conditions. A negative value indicates that no gap currently exists. Non-Interstate NHS Pavement GAP Analysis GAP Analysis Outcomes. Table 4.4 below identifies the actual percentage of Poor condition for each GAP being analyzed. Then that percentage of Poor pavements is measured against the initial 20% target. Based on this analysis, there are currently no predicted gaps for the Non-Interstate NHS pavements. The most important point here is that, based on PMS forecasts, LADOTD is able to provide sufficient available funding to achieve the DSGR, or steady state funding, over all but the very last year of the 10-year analysis period. Table 4.4 Non-Interstate NHS Pavement GAP Analysis LADOTD Target 20% Baseline GAP Current Year % Poor for Identified GAP % Poor minus Target 17.0% -3.0% Current Funding GAP 10 Year Forecast DSGR GAP 10 Year Forecast 10.9% -9.1% 10.9% -9.1% 4.9 BRIDGE PERFORMANCE PENALTY It is the intent of LADOTD to ensure that LADOTD takes every possible step to avoid a penalty assessment. Federal Requirement. 23 CFR Part (a) defines the penalty for exceeding 10.0 percent of total deck area structurally deficient on NHS bridges for a 3-year period as: (1) During the fiscal year following the determination, the State DOT shall obligate and set aside in an amount equal to 50 percent of funds apportioned to such State for fiscal year 2009 to carry out 23 U.S.C. 144 (as in effect the day before enactment of MAP-21) from amounts apportioned to a State for a fiscal year under 23 U.S.C. 104(b)(1) only for eligible projects on bridges on the NHS. 4-18
73 (2) The set-aside and obligation requirement for bridges on the NHS in a State in paragraph (a) of this section for a fiscal year shall remain in effect for each subsequent fiscal year until such time as less than 10 percent of the total deck area of bridges in the State on the NHS is located on bridges that have been classified as Structurally Deficient as determined by FHWA. In 2009, the 23 USC 144 Bridge Program apportioned approximately $171.7 million to Louisiana, so 50% of that total would result in an $86 million penalty. 23 USC 104(b)(1) is the (NHPP) National Highway Performance Program, so this means that a minimum of $86M of NHPP funds would have to be set aside for eligible bridge projects on the NHS, in the year following the determination that Louisiana was not maintaining bridge condition. This penalty would continue until the percentage of Structurally Deficient Deck Area was below 10 percent. Penalty Assessment Time Frame. It is important to note that the penalty is assessed after exceeding the 10.0 percent structurally deficient deck area for (3) three consecutive years. This 3-year time was based on a number of factors including the lag time in both planning and performing bridge preservation work. The impact of the penalty removes LADOTD s flexibility to apply these funds to Federal Aid eligible SHS bridges redirecting funds to NHS bridges only NHS BRIDGE PERFORMANCE ASSESSMENT In contrast to pavement, LADOTD can review historical bridge performance and also reasonably predict bridge performance based on the federal measure for the bridge asset classes. Bridge inspections identify values for Deck, Substructure and Superstructure or Culverts based on a 0-9 rating scale where 9 represents a rating of excellent condition while 0 represents a failed condition. Again, any structure or culvert greater than 20 feet in length along the roadway is considered a NBI bridge. Federal Bridge Condition Criteria - 23 CFR Part (b) Metric Range Good 9-7 Fair 6-5 Poor 4-0 Applies to Deck, Substructure, Superstructure and Culvert NBI Items If all 3 measures are in the Good range, the bridge is in Good condition. If any measure is in the Poor range, the bridge is in Poor condition and considered Structurally Deficient. All 4-19
74 other bridges are in Fair condition. For the individual culvert measure, the value directly determines the condition. Historical NHS Bridge Performance Local NHS Bridges. While LADOTD can perform historical analyses on Local NHS bridges, it cannot forecast performance without budget information from the local bridge owners. The historical analysis of the Local NHS bridges, using the federal performance measures, indicates that the percentage of Good, Fair and Poor bridges has remained constant for the analysis period as shown in Table 4.5 below. Table 4.5 Local NHS Bridge Historical Percentage of Good, Fair and Poor Historical NBI Local NHS Bridge Data Good Fair Poor Deck Area Deck Area Deck Area Deck Area Deck Area Deck Area 61, , , , , , ,998, ,998, ,997, ,997, ,997, ,997, % Deck Area % Deck Area % Deck Area % Deck Area % Deck Area % Deck Area 0.8% 0.7% 0.8% 0.8% 0.7% 0.7% 99.2% 99.3% 99.2% 99.2% 99.3% 99.3% 0.0% 0.0% 0.0% 0.0% 0.0% 0.0% * = Represents 2016 Calendar Year Inspection Data *Total Deck Area 8,060,257.8 Historical State NHS Bridges. The historical analysis of the state-maintained NHS bridges, excluding Local NHS bridges, using the federal performance measures, shown below in Figure 4.6, indicates that the percentage of Good bridges is steadily declining, while the percentage of Fair bridges has steadily increased. This is an unfavorable trend that needs to be watched closely, especially for any bridges that are approaching the lower Fair criteria ranges or the Poor criterial ranges. The percentage of Poor bridges, or structurally deficient bridges, has remained nearly constant for the analysis period. 4-20
75 Figure 4.6 Historical Percentage of Good, Fair and Poor NHS Bridges, Excluding Local NHS, by Deck Area % GOOD % FAIR % Poor Current NHS Bridge Performance An analysis of the current 2017 NBI data for the federal measures on NHS bridges, including Local NHS bridges, is shown below in Table 4.6. This table also identifies the bridge count and deck area represented by these bridges. The Non-NHS bridges are included below for reference purposes. We can analyze the impact that the local NHS bridges have on the system by comparing the 2017 data without Local NHS bridges from Figure 4.6 above with the NHS totals in Table 4.6 below. In comparison, when the Local NHS bridges are added to the mix, a decrease in the percentage of both Good (47.9% to 44.9%) and Poor (8.6% to 8.1%) bridges results while the percentage of Fair (43.5% to 47.0%) bridges increases. 4-21
76 2017 NBI Bridge Data* NHS Local NHS NHS & Local NHS Table 4.6 Percent Good Fair and Poor by Deck Area Good Fair Poor Total Count Deck Area 57,242, ,025, ,268, ,536, % Deck Area 47.9% 43.5% 8.6% Deck Area 61, ,998, ,060, % Deck Area 0.8% 99.2% 0.0% Deck Area 57,304, ,024, ,268, ,596, % Deck Area 44.9% 47.0% 8.1% 79.6% Forecast of Current NHS Bridge Funding Scenario Current NHS Bridge Funding. LADOTD s current NHS bridge funding projection is 101 million increased at 2% per year, noting that this is the actual available total after Preconstruction and (CE&I) Construction, Engineering, Inspection totals are removed. A 20-year analysis is performed due to the slow deterioration of bridges. This projected budget allocation was the results of numerous budget runs, using different funding ranges, which is a significant benefit of a fully functional BMS. NHS Bridge Forecast. As shown below in Figure 4.7, this budget allocation allows for a steady level of Structurally Deficient, or Poor condition bridges through 2025, with a significant spike occurring in 2026, followed by a constant decrease over a 7-year period back to the levels prior to 2026 and extending through the end of the analysis period. As noted earlier, outlier bridges can have a significant impact on bridge conditions. This large spike scenario is what LADOTD will consider when the fiscal funding crisis is resolved and funding becomes available to potentially create a special budget category for outlier bridges. 4-22

77 Figure 4.7 SD Condition for Historical & Forecasted NHS Bridge (Excluding Local NHS Bridges) 4-23
78 NHS Bridges Desired State of Good Repair We reference that LADOTD s current condition of NHS bridges is designated as the desired state of good repair and determine that value to be 8.6%. With the current projected budget, LADOTD achieves as close to the state of good repair as possible for as long as possible and after a significant spike, returns back to that value in the out years of the BMS analysis. Note that the bridge penalty is only imposed when the 10% threshold is exceeded for (3) three consecutive years. Federal NHS Bridge Performance Targets Federal Requirement. 23 CFR Part (e)(4)(iii) requires that State DOTs shall establish 2-year targets that reflect the anticipated condition/performance level at the midpoint of each 4-year performance period for the condition of pavements on the Interstate System, the condition of pavements on the NHS (excluding the Interstate) and for the condition of bridges on the NHS. Additionally, 23 CFR Part (e)(4)(iv) requires that State DOTs shall establish 4-year targets that reflect the anticipated condition/performance level at the end of each performance period for the same measures. Federal NHS Bridge Targets External Factors and Unknowns. As noted earlier in this chapter, there are a number of external factors outside the agency s control that affect target setting. Given the current statewide budget deficit, loss of funds due to inflation eroding Transportation Trust Fund dollars, and a political climate that does not suggest additional funding, LADOTD has made the reasonable assumption that the current projected funding levels, while currently valid, could actually be strained even further in the future. LADOTD is also in the process of migrating from the old PONTIS BMS to a new BMS and is evaluating (3) three different options. As such, LADOTD has concerns about how the new system will forecast performance compared to the existing system. With the significant number of external factors and a migration to a new BMS, LADOTD will take a very conservative approach in the initial NHS bridge Federal 2-year and 4-year target setting. 2-Year NHS Bridge Target. Based on these concerns and excluding the Local NHS bridges from the target, LADOTD has identified the very conservative TAMP 2-year, LADOTD has identified the TAMP 2-year NHS Bridge condition targets as 38% in Good condition and no more than 9.9% in Poor Condition. If Local NHS bridges are included in the target, the TAMP 2-year NHS Bridge condition targets as 35% in Good condition and no more than 9.9% in Poor Condition. 4-24
79 4-Year NHS Bridge Target. Based on these concerns and excluding the Local NHS bridges from the target, LADOTD has identified the very conservative TAMP 4-year NHS Bridge condition targets as 35% in Good condition and no more than 9.9% in Poor Condition. If Local NHS bridges are included in the target, the TAMP 4-year NHS Bridge condition targets as 30% in Good condition and no more than 9.9% in Poor Condition. Note that the Poor target still would not fall below the federal minimum performance level for condition of 10% Poor, or Structurally Deficient bridges for either the 2-year or 4-year targets NHS BRIDGE GAP ANALYSIS LADOTD NHS Bridge GAPs Defined. LADOTD has identified the following gap analysis definitions, based on the percentage of deck area in Poor condition on NHS bridges, to assess NHS Bridge performance: NHS Bridge Target. LADOTD has defined the initial NHS Bridge target of no more than 9.9% deck area in Poor condition. Baseline GAP. The gap between current percentage of deck area in Poor bridge condition, as identified above in Table 4.6, and the LADOTD target for percentage of deck area in Poor condition. Current Funding GAP. Perform a 20-year bridge analysis using the current projected funding. Determine this GAP using the percentage of deck area in Poor condition in the final year of the analysis against the LADOTD target for percentage of deck area in Poor condition. Desired State of Good Repair GAP. Perform a 20-year bridge analysis using a funding level that retains the current level of percentage of deck area in Poor condition. Determine this GAP using the percentage of deck area in Poor condition in the final year of the analysis against the LADOTD target for percentage of deck area in Poor condition. Understanding GAP Analysis Outcomes. Table 4.7 below shows the gap analysis for NHS bridges. A positive value in the % Poor minus Target column translates to a need to reduce the percentage of deck area in Poor condition. A negative value indicates that no gap currently exists. GAP Analysis Outcomes. Based on the LADOTD percentage of deck area in Poor condition target of 9.9%, there are currently no predicted gaps for the NHS bridges. The additional conclusion drawn here is that LADOTD was able to provide sufficient current available funding that very nearly achieves the desired state of good repair over the 20-year analysis period that also comes very close to steady state funding. 4-25
80 Most importantly the Federal Minimum of 10.0% deck area in Poor condition, or Structurally Deficient, is not exceeded for more than (3) three years with the current available funding. Table 4.7 NHS Bridge GAP Analysis LADOTD Target 9.9% Baseline GAP Current Year Current Funding GAP 20 Year Forecast DSGR GAP 20 Year Forecast % Poor for Identified GAP % Poor minus Target 8.6% -1.3% 8.3% -1.6% 8.3% -1.6% 4-26
81 5.0 Life Cycle Planning 5.1 INTRODUCTION One of the primary goals of MAP-21 is to drive treatment strategies away from a Worst First towards a Preservation First approach. There is a significant amount of literature that very clearly establishes and substantiates the fact that a Preservation First strategy is the most cost-effective strategy for pavement and bridge assets. In fact, over the life of an asset, various research efforts have documented that well-timed preservation activities can cut life cycle costs by as much as one-half when compared to a policy where no preservation is performed. A Preservation First strategy effectively results in a spending approach that uses the very limited available funding on many more assets, essentially preserving these assets in as close to their current condition as possible, and not spending the money replacing a small number of assets in far worse condition. One of the tools to accomplish this is Life Cycle Planning (LCP). LCP is a relatively new network level approach, that is an adaptation of the existing basic principles of the project level life-cycle cost analysis (LCCA) approach. Life Cycle Planning Concept A Worst First treatment strategy involves spending most of the available funding on the worst conditioned assets in an effort to revive the nearly extinguished asset. This usually amounts to a replacement or major rehabilitation of the asset. The outcome of this approach is that a very limited number of assets are improved, while a large number of assets continue to decline in condition. Federal Requirement. The definition of life-cycle planning (LCP), identified in 23 CFR Part 515, is: Life-cycle planning means a process to estimate the cost of managing an asset class, or asset sub-group over its whole life with consideration for minimizing cost while preserving or improving the condition. The basic, underlying principle of LCP is that timely investments in an asset, via the best sequence of maintenance, preservation, and rehabilitation treatments, result in an improved overall condition, a longer life span, and lower long-term costs. An optimum mix of treatments is best determined by advanced pavement and bridge management systems, using predictive modeling along with a fundamental understanding of the costs, benefits, and service life extensions for different treatment types. LCP also instills a focus on a proactive preservation approach and works to eliminate a reactive, fix it after the fact, maintenance approach to maintaining assets. 5-1
82 LADOTD and LCP. Like many State DOTs, LADOTD has historically engaged in a Worst First strategy. Despite that fact, LCP has been intuitively practiced at LADOTD, but certainly not been formally applied on an agency-wide basis or in a policy driven manner. For instance, LADOTD currently designates a very limited number of bridge replacement types as older bridges types are removed from service and replaced. Historically, bridges were designed in a one-off manner, with very few bridges using the same design. That led to LADOTD currently having a total of sixty-four (64) different types of bridges on the statemaintained system. The construction of the Interstate system was the beginning of the end for that practice. The Interstate bridge designs changed the focus to both longevity and the minimization of maintenance requirements. From that point on these repeatable LCP type strategies became imbedded at LADOTD. Currently, LADOTD considers seven (7) different generalized replacement type bridges, with 95% of replacements being prestressed concrete girders or slab span bridges, when replacing these sixty-four (64) types. LCP also replaces historical construction decisions that only consider the immediate costs of a project, with the more impactful decisions that consider the long-term maintenance, preservation and operations cost, eliminating those historical decisions that would rarely provide the best value for an asset. Following that rationale, consider the fact that LADOTD currently builds most of the small fixed bridges using concrete and does not use timber anymore, even though the initial cost of a timber bridge would be a fraction of a concrete bridge cost. It is well known that timber bridges experience truck load limit issues, wear out quickly, and require almost continuous maintenance. To reach the life span of a simple, but initially much more expensive concrete bridge, there would be a need to rebuild the timber bridge a number of times. LCP very appropriately factors in all the down time, user detour and delay costs, material cost, labor cost, replacement cost, life expectancy, etc. to help determine that the concrete bridge is the superior long-term LCP cost benefit choice over timber bridges. In this case, sound agency project decisions are supported via the LCP concept. While this simple bridge example illustrates the concept, in reality, the decisions are not always that simple, plus they need to be applied against many asset choices via an in-depth analysis. LCP and Preservation. Figure 5.1 below, from the well-known Galehouse research investigations, shows that optimal expenditures, early in the life of a pavement asset, are relatively inexpensive and will maintain the asset at, or near, excellent condition while effectively extending the life of the asset significantly, with the most efficient life cycle cost. By the same token, the do nothing approach does not even allow the asset to reach its expected life as it encounters the consequence of very rapid deterioration. It should also be noted that these less expensive preservation treatments have a limited window of application opportunity. These treatments are only effective if applied in the appropriate deterioration timeframe. Applying treatments past their appropriate 5-2
83 opportunity window is counterproductive and is generally a waste of money; and as such, they become completely inefficient in terms of the asset s life cycle costs. To illustrate this, we examine the proper time to apply the relatively inexpensive chip seal on an asphalt pavement. Proper timing requires this treatment to be applied when small cracks are beginning to show up on the pavement. These smaller cracks should be sealed to prevent further deterioration into larger cracks which will require a more expensive overlay treatment. When a chip seal is delayed, and the cracks get larger, the chip seal is no longer an effective treatment. Applying a chip seal at this point is simply a bad investment. Figure 5.1 Life Cycle Cost and Preservation Intervals Source: Principles of Pavement Preservation, Galehouse, et al Consequences of Delayed Pavement Preservation Treatments As noted above, preservation treatment benefits assume proper treatment selection and application within the appropriate time or condition range for the treatment. Preservation treatment delays are primarily caused by a lack of, or limited funding resulting in delayed project scheduling. In other cases, external factors, such as recent repeated heavy loads, or overweight truck traffic, such as cane or cotton farming, logging, or fracking operations, cause rapid, abnormal deterioration to pavements. In most of these cases, the district is required to scrap the prescribed PMS preservation treatment completely because they generally don t have the additional funding available to implement the more expensive treatment necessary to remedy the changed pavement condition. The PMS analysis data collection effort captures pavement condition data on two-year cycles and in these cases, the PMS condition data lags the current pavement conditions. 5-3
84 Research Findings. NCHRP Report 859 quantified the consequence of delayed maintenance or preservation, clearly identifying that the result are degraded pavement conditions, more advanced and costly treatments, and a reduction in Level of Service (LOS). In addition, NCHRP Report 859 adds the following additional consequences for delayed maintenance or preservation: highway assets that perform below the expected LOS have been perceived to generate user discomfort, increase exposure to accidents, increase fuel usage, and increase damage to vehicles (Setyawan et al. 2015). Environmentally, air pollution increases with greater traffic congestion. Furthermore, poorer pavement condition can affect vehicle fuel emissions (e.g., CO, CO2, HC, NOx) (Chang et al. 2016). Also, without proper maintenance, materials deterioration also can affect the environment negatively (Setyawan et al. 2015). Actual Consequences of Delayed Bridge Preservation Delayed Preservation Huey P. Long - O.K. Allen Bridge in North Baton Rouge. One of the best examples of the consequences of delay preservation leading to more extensive damage and escalated costs can be found in the project to restore the condition of the US 190 bridge in north Baton Rouge. This bridge was opened in August of 1940 and cost $8.4 million to construct and the Kansas City Southern Railway Company is a joint owner of the bridge. While the bridge approaches are separated for the vehicles and trains, the center structure is a shared structure. This bridge had last been painted in the mid-1960s and was in need of minor repairs and painting. Efforts began in the 1980s to secure the cost share agreement with KCS to perform the work. At that time the cost estimate was $30 million dollars to repair and paint the bridge. Due to the downturn in the national economy in the mid-1980s, funding became an issue for both parties and an agreement could not be reached. Efforts to perform this work continued at various times over the years to no avail and the structure continued to deteriorate. As the delays continued, the deterioration was progressing to the point where the bridge was going to receive a load rating restriction that could have prevent the KCS from fully using the bridge. The project was just recently completed and as a consequence of the delayed bridge preservation, the final cost had escalated to $130 million. Consequences of Delayed Preservation on Maintenance Costs Delayed Preservation Increases Maintenance Costs. In more real terms, using the department s Maintenance Management System, maintenance executives analyzed maintenance records and have established the actual cost of pavement maintenance activities based on condition. Table 5.1 below very clearly shows there are significant increases in maintenance cost between pavements in Good, Fair and Poor condition. These cost increases very obviously 5-4
85 illustrate the importance of having appropriate funding levels to preserve pavements in a Desired State of Good Repair on NHS pavements and bridges, as required by federal legislation. Table 5.1 Average In-House Pavement Surface Maintenance Costs (FY 2014 to FY 2016) PAVEMENT TYPE CONDITION AVG COST/MILE/YEAR Interstate Good $1,308 Fair $1,608 Good $1,326 Non-Interstate NHS Fair $2,109 Poor $3, LIFE CYCLE PLANNING METHODOLOGY LCP Methodology. This chapter details LADOTD s life-cycle planning efforts for the NHS pavement and bridge assets. LADOTD s existing LCP strategies and practices are based on the long-term use of the PMS that processes data collected biennially to generate projected conditions and the BMS that processes the annual NBI inspection data to generate projected condition ratings. Both management systems use sophisticated deterioration modeling, based on strategies developed over years of condition data collection and treatment history data, to identify future conditions for any number of various funding options. Using a number of defined treatments, or work types, programmed into the PMS, the actual project treatment recommendations focus on providing the most appropriate life cycle cost over the analysis period. The condition outcomes of these different scenarios are then evaluated against both federal and state condition targets, to identify appropriate issues and gaps that will prevent the agency from reaching those targets, and providing a preemptive opportunity to remedy these issues and gaps going forward. Federal Requirement. In response to 23 CFR 515.7(b), requiring A State DOT shall establish a process for conducting life-cycle planning for an asset class or asset sub-group at the network level. 5-5
86 Asset Classes and Sub-Groups. Interstates and Non-Interstate NHS pavements make up the 2018 TAMP pavement asset classes, while NHS bridges, including Local NHS bridges, make up the 2018 TAMP bridge asset class. LADOTD has included, for informational purposes, the SHS and RHS pavement asset classes and the Non-NHS bridge asset classes in the 2018 TAMP. With respect to asset sub-groups, the LADOTD PMS performs analyses for the pavement types of Asphalt, Composite, Jointed Concrete and Continuously Reinforced Concrete. Note the federal assessment is based on only three pavement sub-groups, Asphalt, Jointed Concrete and Continuously Reinforced Concrete, with composite pavements included in the Asphalt sub-group. For bridges, the asset sub-groups include mostly concrete bridges and steel bridges, along with a number of other types. Locally Owned Assets. LADOTD performs bridge inspections for the Causeway Commission and the Local MPOs but has not historically captured pavement data. That changed recently with the new data collection contract as LADOTD has agreed to capture pavement inventory data on the Local NHS for the MPO s and the Causeway Commission. For the current analysis, LADOTD makes the assumption that the Causeway Commission will use toll revenues to continue to maintain their NHS pavement and bridge assets in their current steady state condition. LADOTD also makes the assumption that the Local NHS pavement and bridges will respond in the same manner as the LADOTD Non-Interstate NHS assets. These assumptions will remain in effect until appropriate data becomes available, and local funding availability is identified, to analyze these assets separately. Using this assumptive approach, LADOTD will not exclude any asset sub-groups in the overall pavement or bridge analyses. Management Strategies. Typical management strategies will be identified in this chapter as well. As identified before, LCP helps an agency to move from a Worst First approach. Figure 5.2 below clearly shows the life cycle cost benefit of moving to a Preservation First approach. 5-6

87 Figure 5.2 Proactive Preservation vs. No Preservation Source: RIDOT based on an analysis published by TXDOT, compiled for Caltrans by Spy Pond Partners 5.3 PAVEMENT LIFE CYCLE PLANNING Life Cycle Planning Analysis Federal Requirement. We find in 23 CFR 515.7(b)(1) that a life-cycle planning process shall, at a minimum, include the following: Incorporating the State DOT targets for asset condition for each asset class or asset sub-group into the analysis. Life Cycle Planning Analysis. The PMS is the heart of pavement LCP at LADOTD and provides for full compliance with this federal requirement. 5-7
88 LADOTD s Pavement Management System (PMS) was established to analyze pavement condition data for use in improving the performance, planning, design, construction, rehabilitation and maintenance of the State highway network. The PMS is fundamentally a comprehensive life cycle cost and deterioration modeling tool designed to meet LADOTD s goal of optimizing the use of available funding. Data collected on the highway network, pavement conditions and highway inventory are analyzed to forecast long-term and shortterm funding needs, evaluate existing conditions, accumulate historical data to evaluate performance, prioritize projects, and supply research with such data. The PMS allows LADOTD to evaluate a series of budget scenarios to determine the ability of each budget scenario to achieve targets and the desired state of good repair. The PMS is also used to analyze the actual projected budget for the analysis period. Pavement Management Treatment Selection Process The PMS analysis produces a list of prioritized pavements and their recommended treatments, to be applied within the next five-year period. Non-Interstate NHS Pavement Project Selection. LADOTD has created a separate budget category for the Non-Interstate NHS pavements. Further, the treatment selection process for the Non-Interstate NHS pavements was moved away from the Districts to Headquarters, to match the current Interstate project selection process. This major operational change provides for the opportunity to more practically facilitate all of the federal NHS asset requirements necessary for a compliant TAMP and for future consistency determinations. Non-NHS Project Selection. The PMS analysis produces a list of prioritized pavements and their recommended treatments, to be applied within the next five-year period. This list is provided to each District annually to serve as guidance in the project selection process. Included in the package is the information used in the project selection along with current and past distresses for comparison. In cases where there is a need to select a treatment contrary to the PMS recommendation, the District must justify and document the request. For instance, the PMS data could be up to two years old and actual field conditions could have significantly changed. The Preservation Selection Committee, as defined in the Highway Project Selection Process Manual, has final approval for project selections. The documented factors that could justify an engineering judgment override of the PMS recommendation are as follows: Other funding sources included in project, for example safety, ER (emergency relief), drainage, etc. One treatment selection vs. various PMS recommendations for the project length o In this case, the project length exceeds the homogeneous section length of the PMS recommendation or includes multiple sections. The project level scope is adapted to meet the needs of multiple PMS sections. 5-8
89 Variations in observed data vs. PMS data (PMS data can be up to 2 years old and may not reflect conditions as they currently exist ) Maintenance Costs Physical constraints (curb & gutter, numerous driveway entrances, overpasses, etc.) Environmental issues (geographic location, residential areas, high traffic, % trucks very high, etc.) Land usage change Existing LCP Policy Document. The FHWA approved the 2013 LADOTD policy document, Selection of Treatments and Projects for Pavement Preservation, which outlines the adoption of a LCP approach for use in the Preservation/Rehabilitation/Replacement Program (PPR) (see Figure 5.3) and specifically the Pavement Preservation (Road Preventive Maintenance) (PRR-PM) ancillary program. Please note that this policy document focuses only on a small part of the pavement preservation budget partition but is included here primarily to reference the existence of this germane LCP policy document. This document also states that the Highway Project Selection Process Manual is expanded to include, via this new policy document, data driven processes to select pavement preservation projects and treatments to ensure selections are cost effective and meet the goals of the program. Figure 5.3 Preservation/Rehabilitation/Replacement Program (PPR) Components Within this policy document, we find that pavement preservation treatments are generally non-structural treatments designed to extend the life of good pavements, preserve the existing conditions of the pavements, and retard future deterioration. The treatments typically include sealing joints and cracks, restoring load transfer, patching, filling minor ruts grinding/grooving, surface treatments and thin overlays. The document further notes that routine maintenance, while not eligible for this funding, still receives attention and focus in this policy document. Specifically identified maintenance activities include pothole patching, bump grinding, spot leveling, and machine leveling. 5-9
90 Pavement Condition Deterioration Modeling Federal Requirement. 23 CFR (b)(2) requires that a life-cycle planning process shall, at a minimum, include the following: Identification of deterioration models for each asset class or asset sub-group LADOTD Pavement Deterioration Modeling. LADOTD uses dtims CT software, developed by Deighton Associate, for comprehensive life cycle cost analysis of our pavement network. Using the most current pavement condition data available, the dtims CT s data analysis will forecast future expenses for each asset, establish priorities, and investigate the various array of strategies or treatments based on defined budgets or resources. The LADOTD implementation of dtims CT utilizes a heuristic optimization analysis based on a 20 year analysis period with a 10 year treatment period for deterioration modeling. Given a discount rate and inflation rate, dtims CT optimizes pavement strategies using an Incremental Benefit Cost Ratio technique to compare different potential network strategies. This is accomplished via a comprehensive analysis of the various pavement condition indexes, and their use as triggers, identifying the most timely preservation or rehabilitation treatments that enhance and maximize potential life cycle cost benefits. dtims CT sorts all strategies in descending order of incremental benefit cost for each pavement segment. Strategies are selected from this order based on whether funding is available for each year to cover the yearly cost of the particular strategy intended for the particular road segment. The available budget is then reduced in the respective category by the annual yearly costs of the treatments for the selected strategy. The optimization process continues whereby a strategy replaces another if the subsequent strategy provides superior benefit and the budget remains available. The analysis progresses until all strategies are exhausted or funding is depleted. These recommended treatments are only valid for a fixed time span since the pavement deterioration continues over time. dtims CT can be configured to apply this analysis to either asset groups or asset subgroups. Most of the extensive pavement distress data, used in dtims CT, is currently collected by a data collection vendor, over a two-year cycle using the ARAN multi-function data collection vehicle. The Interstate and Non-Interstate pavement data is currently captured every year. Pavement Treatments (Work Types) Federal Requirement. 23 CFR (b)(3). A life-cycle planning process shall, at a minimum, include the following: Potential work types across the whole life of each asset class or asset sub-group with their relative unit cost LADOTD Treatments Types. The following Tables 5.2 through 5.5 identify the actual PMS pavement treatment options for Asphalt Pavements, Composite Pavements, Jointed 5-10
91 Concrete Pavements and Continuously Reinforced Concrete Pavements. The PMS actual pavement treatment (work types in 23 CFR 515.7(b)) unit costs found in the following tables are averages determined from the LADOTD Item Number Unit Bid Prices. While most TAMPs will provide a simple summary table, that combines their actual treatments into a smaller number of general categories, LADOTD feels it is important for the reader to understand that a great deal of technical detail and complexity are included in the life cycle planning based PMS forecasts. It is also important for the reader to see the real consequences, of the actual escalating costs, when limited funding requires LADOTD to defer preservation activities. An investment in a timely lower cost treatment produces a real benefit to the pavement, in the form of reduced distresses and a reduction in the rate of pavement condition deterioration. Table 5.2 Asphalt Pavement Treatment Costs (Work Types) and Treatment Type Descriptions # ASPHALT PAVEMENT TREATMENT DESCRIPTION COST PER MILE FOR 2 LANES COST PER MILE FOR EXTRA LANES 1 Microsurfacing on Interstate 67,000 31,000 2 Thin Overlay on Interstate (Cold Plane 2", put 2" back; , , sq.yds. Patching) Medium Overlay on Interstate (Cold Plane 2", put 3.5" back or just 3.5" overlay, sq.yds Patching) Structural Overlay on Interstate (7" Overlay; 700 sq.yds. Patching) 452,000 1,053, , ,000 5 Microsurfacing on Arterial 67,000 31, Thin Overlay on Arterial (Cold Plane 2", put 2" back; sq.yd. Patching) Medium Overlay on Arterial (Cold Plane 2", put 3.5" back or just 3.5" 229, , , ,000 8 overlay, sq.yds Patching) Structural Overlay on Arterial (5.5" Overlay; 700 sq.yds. Patching) 851, ,000 9 Polymer Surface Treatment on Collector 72,000 29, Microsurfacing on Collector 67,000 31, Thin Overlay on Collector (2" Overlay; sq.yd. Patching) 184,000 76, Medium Overlay on Collector (Cold Plane 2", put 3.5" back or just 3.5" overlay, sq.yds Patching) In Place Stabilization on Collector (In-Place Stabilization & 3" A.C.) 334, , , ,
92 Table 5.3 Composite Pavement Treatment Costs (Work Types) and Treatment Type Descriptions # COMPOSITE PAVEMENT TREATMENT DESCRIPTION COST PER MILE FOR 2 LANES COST PER MILE FOR EXTRA LANES 1 Microsurfacing on Interstate 67,000 31,000 2 Thin Overlay on Interstate (Cold Plane 2", put 2" back; sq.yds. Patching) 215,000 99, Medium Overlay on Interstate (Cold Plane 2", put 3.5" back & 1.5" on shoulders; sq.yds Patching) Structural Treatment on Interstate (CRCP Composites-Cold Plane 2", heavy patching (600 sq.yds), put 5.5" back &3.5" on shoulders) or (JCP Composites-Cold Plane to slab, Rubblize, put 7" A.C., 3" A.C. on shoulders) 466, , , ,000 5 Microsurfacing on Arterial (Curb) 67,000 (Curb) 31,000 (Non-curb) 67,000 (Non-curb) 31,000 Thin Overlay on Arterial (Curb & Gutter) 6 (Cold Plane to slab, 300 sq.yds. Patching, Clean & Reseal Joints, 2" Saw & Seal 215,000 99, Overlay) Thin Overlay on Arterial (Non-Curb & Gutter) (Cold Plane 2", put 2" back, 100 sq.yds. Patching, 30 tons Joint Repair) Medium Overlay on Arterial (Non-Curb & Gutter) Cold Plane to slab, put 3.5" Saw & Seal Back, 300 sq.yds. Concrete Patching, Clean & Reseal Joints or Cold Plane 2", 300 sq.yds. A.C. Patching, 30 tons Joint Repair, 3.5" 215, ,000 99, , Overlay) Structural Overlay on Arterial (Curb & Gutter) (Cold Plane to slab, 1000 sq.yds. Patching, Clean & Reseal Joints, 2" Saw & Seal Overlay) Structural Overlay on Arterial (Non-Curb & Gutter) Cold Plane 2", 600 sq.yds. A.C. Patching, 100 tons Joint Repair, 5.5" A.C. & 3.5" on 360, , , , Shoulders) Rubblize and Overlay on Arterial (Non-Curb & Gutter) Cold Plane to Slab, Rubblize, 5.5" A.C. & 2" A.C. on Shoulders (4 or more lanes) 676, , Microsurfacing on Collector (Curb) 67,000 (Curb) 31,000 (Non-curb) 67,000 (Non-curb) 31,000 Thin Overlay on Collector (Curb & Gutter) 13 (Cold Plane to slab, 300 sq.yds. Concrete Patching, Clean & Reseal Joints, 2" Saw & 215,000 99, Seal Overlay) Thin Overlay on Collector (Non-Curb & Gutter) (Cold Plane 2", put 2" back, 100 sq.yds. Patching, 30 tons Joint Repair) 215,000 99, Medium Overlay on Collector (Non-Curb & Gutter) Cold Plane to slab, put 3.5" Saw & Seal Back, 300 sq.yds. Concrete Patching, Clean & Reseal Joints or Cold Plane 2", 300 sq.yds. A.C. Patching, 30 tons Joint Repair, 3.5" Overlay) Structural Overlay on Collector (Curb & Gutter) (Cold Plane to slab, 1000 sq.yds. Concrete Patching, Clean & Reseal Joints, 2" Saw & 466, , , , Seal Overlay) Structural Overlay on Collector (Non-Curb & Gutter) Cold Plane 2", 600 sq.yds. A.C. Patching, 100 tons Joint Repair, 5.5" A.C. & 3.5" on Shoulders) Rubblize and Overlay on Collector (Non-Curb & Gutter) Cold Plane to Slab, Rubblize, 5.5" A.C. & 2" A.C. on Shoulders (4 or more lanes) 752, , , ,
93 Table 5.4 Jointed Concrete Pavement Treatment Costs (Work Types) and Treatment Type Descriptions # JOINTED CONCRETE PAVEMENT COST PER MILE FOR COST PER MILE FOR TREATMENT DESCRIPTION 2 LANES EXTRA LANES 1 Seal Joints and Cracks on Interstate (Crack Sealing Plus Clean & Reseal Joints, Minor Patching) Minor Rehab on Interstate 15,000 7,000 2 (Crack Sealing plus Clean & Reseal Joints, Partial Depth Patching, Grinding, Cross- 108,000 50,000 Stitching, Slab Jacking, Full Depth Patching (Not Greater Than: 400 sq.yds.)) Major Rehab on Interstate(Curb & Gutter) (Minor Rehab. Plus up to 1000 sq.yds. Full Depth Patching) Major Rehab on Interstate(Non-curb & Gutter) (Minor Rehab. Plus up to 1000 sq.yds. Full Depth Patching) Rubblize and Overlay on Interstate (Non-curb & Gutter) (Rubblize + 7 Overlay) 335, ,000 1,088, , , ,000 6 Reconstruct on Interstate (Curb) 4,823,000 (Curb) 1,132,000 (Non-curb) 2,047,114 (Non-curb) 1,028, Seal Joints and Cracks on Arterial (Curb & Gutter) (Crack Sealing Plus Clean & Reseal Joints, Minor Patching) Seal Joints and Cracks on Arterial (Non-curb & Gutter) (Crack Sealing Plus Clean & Reseal Joints, Minor Patching) Minor Rehab on Arterial (Curb & Gutter) 15,000 15,000 7,000 7,000 9 (Crack Sealing plus Clean & Reseal Joints, Partial Depth Patching, Grinding, Cross- 108,000 50,000 Stitching, Slab Jacking, Full Depth Patching (Not Greater Than: 400 sq.yds.)) Minor Rehab on Arterial (Non-curb & Gutter) 10 (Crack Sealing plus Clean & Reseal Joints, Partial Depth Patching, Grinding, Cross- 108,000 50,000 Stitching, Slab Jacking, Full Depth Patching (Not Greater Than: 400 sq.yds.)) Major Rehab on Arterial (Curb & Gutter) (Minor Rehab. plus up to 800 sq.yds. Full Depth Patching plus 2" Saw & Seal Overlay) Major Rehab on Arterial (Non-curb & Gutter) (Minor Rehab. plus up to 800 sq.yds. Full Depth Patching plus 3.5" Saw & Seal Overlay) Major Rehab on Arterial (Non-curb & Gutter) (Minor Rehab. plus up to 800 sq.yds. Full Depth Patching plus 3.5" Saw & Seal Overlay) Rubblize and Overlay on Arterial (Non-curb & Gutter) (Rubblize + 5 Overlay) Seal Joints and Cracks on Collector (Curb & Gutter) (Crack Sealing Plus Clean & Reseal Joints, Minor Patching) Seal Joints and Cracks on Collector (Non-curb & Gutter) (Crack Sealing Plus Clean & Reseal Joints, Minor Patching) Minor Rehab on Collector (Curb & Gutter) , , ,000 15,000 15, , , , ,000 7,000 7, (Crack Sealing plus Clean & Reseal Joints, Partial Depth Patching, Grinding, Cross- 108,000 50,000 Stitching, Slab Jacking, Full Depth Patching (Not Greater Than: 400 sq.yds.)) Minor Rehab on Collector (Non-curb & Gutter) 18 (Crack Sealing plus Clean & Reseal Joints, Partial Depth Patching, Grinding, Cross- 108,000 50,000 Stitching, Slab Jacking, Full Depth Patching (Not Greater Than: 400 sq.yds.)) 19 Major Rehab on Collector (Curb & Gutter) (Minor Rehab. Plus up to 800 sq.yds. Full Depth Patching plus 2" Saw & Seal 335, , Overlay) Major Rehab on Collector (Non-curb & Gutter) (Minor Rehab. Plus up to 800 sq.yds. Full Depth Patching plus 3.5" Saw & Seal Overlay) Major Rehab on Collector (Non-curb & Gutter) (Minor Rehab. plus up to 800 sq.yds. Full Depth Patching plus 3.5" Saw & Seal 335, , , , Overlay) Rubblize and Overlay on Collector (Non-curb & Gutter) (Rubblize + 5 Overlay) 887, ,
94 Table 5.5 Continuously Reinforced Concrete Pavement Treatment Costs (Work Types) and Treatment Type Descriptions # CONTINUOUSLY REINFORCED CONCRETE PAVEMENT COST PER MILE FOR COST PER MILE FOR TREATMENT DESCRIPTION 2 LANES EXTRA LANES 1 Minor Rehab on Interstate (Not Greater Than: 200 sq.yds. of Full Depth Patching & 4 A.C. Overlay) 609, ,000 2 Major Rehab on Interstate (Not Greater Than: 400 sq.yds. of Full Depth Patching & 8 A.C. Overlay or Bonded Concrete Overlay) 2,257, ,000 3 Reconstruction or Unbonded Concrete Overlay on Interstate (Curb) 4,823,000 (Curb) 1,132,000 (Non-curb) 2,047,114 (Non-curb) 1,028,156 4 Minor Rehab on Other (Not Greater Than: 200 sq.yds. of Full Depth Patching & 4 A.C. Overlay) 609, ,000 5 Major Rehab on Other (Not Greater Than: 400 sq.yds. of Full Depth Patching & 8 A.C. Overlay or Bonded Concrete Overlay) * 2,257,000 * 204,000 6 Reconstruction or Unbonded Concrete Overlay on Other (Curb) 4,823,000 (Curb) 1,132,000 (Non-curb) 2,047,114 (Non-curb) 1,028,156 Pavement LCP Strategies Federal Requirement. 23 CFR (b)(4). A life-cycle planning process shall, at a minimum, include the following: A strategy for managing each asset class or asset sub-group by minimizing its lifecycle costs while achieving the State DOT targets for asset condition for NHS pavements and bridges under 23 U.S.C. 150(d). LCP Strategy Defined. FHWA s interim guidance on using lifecycle planning to support asset management defines a life cycle planning strategy as a collection of treatments that represent the entire life of an asset class or subgroup. LADOTD Life Cycle Strategies. LADOTD has the pavement life cycle strategy of deploying the right treatment, at the right time, to gain the maximum possible life, at the most economical cost, from a pavement. No asset sub-group has been eliminated from this analysis. The ultimate goal is to continue to use the various treatments to extend the use of the asset indefinitely. This would involve construction of the pavement, then ongoing treatments at various times to renew the surface. Early on some type of crack sealing and minor repairs would occur, these could be repeated prior to a more advanced treatment being required such as a minor overlay or minor rehab depending on the asset sub-group. Crack sealing and minor repairs might then be applied again. As time goes on, medium or structural overlays, or major rehab options would need to be employed. Eventually a structural replacement would be required and the cycle would start all over again. For LADOTD, the PMS determines the actual collection of treatments, or strategies, for an asset class (Interstate, Non-Interstate NHS, etc.) and asset sub-group (Asphalt, Jointed Concrete Pavement, etc.), to be employed in any given year while maximizing the life cycle 5-14
95 cost benefit decisions in the process. Again, the current collection of treatments is identified above in Tables 5.2 through 5.5. The PMS performs this treatment analysis separately for each homogeneous pavement section made of the same pavement asset sub-group or surface type. This analysis involves identifying the current pavement condition which then use different condition index trigger points for each asset class to identify the appropriate treatments for these asset classes. For instance, if we consider the Asphalt pavement sub-group, five (5) condition indexes, Alligator, Random, Patch, Rut and Roughness, are used to trigger various treatments (work types). These various triggered treatments may be different for different asset classes. For instance, LADOTD does not use the same condition index trigger points or trigger the same treatments (work types) for low volume rural pavements as it does for Interstate pavements. In summary, the PMS fully meets the federal strategy requirements identified in this section. 5.4 BRIDGE LIFE CYCLE PLANNING Bridge Modeling Approach Federal Requirement. 23 CFR 515.7(b)(1) A life-cycle planning process shall, at a minimum, include the following: Incorporating the State DOT targets for asset condition for each asset class or asset sub-group into the analysis. LADOTD Life Cycle Planning Analysis. Similar to the PMS, the BMS is the heart of bridge LCP at LADOTD and provides for full compliance with this federal requirement. When a new bridge is built, the State commits itself not only to the initial construction costs, but also to the future costs to maintain that bridge. In many cases the future costs will exceed the initial construction cost during the life of a bridge asset. The BMS analyzes each bridge to predict needs for that bridges. Then the BMS identifies the most appropriate repair treatment at the right time, which provides the lowest lifecycle cost over time. While LADOTD is transitioning to the new AASHTO BrM BMS, the continued use of the AASHTO PONTIS BMS will allow LADOTD to remain fully compliant with this requirement. The BMS is utilized to analyze the outcome of various budget scenarios to determine the potential outcome of those budgets. This process allows LADOTD to determine the most appropriate budgets to achieve both the aspirational desired state targets and realistic targets. The BMS is also used to analyze the actual predicted budget for the analysis period. Louisiana LCP Bridge Issues. A benefit of LCP is that it identifies bridges that are not yet structurally deficient and supports the planning of relatively inexpensive projects that can 5-15
96 prevent those bridges from entering a state of deficiency, which thus extends their lives. This approach can be used to address more bridges, which more significantly reduces the number of deficient bridges. In the long-term, this saves money and keeps the inventory in better condition. It appears that Common Sense must also prevail in this matter. If an agency has received insufficient funding for any significant period of time, the agency must defer preservation strategies for some structures. In the case of Louisiana, this problem is further exasperated by not only a significant number of very large bridges, but also, a high number of bridges in general. In this case, LADOTD must balance between preservation strategies as much as practically possible, but can never eliminate major rehabilitation and replacement projects, which could be rightly considered worst first projects. These worst first projects will be required because there are many critical bridge structures that can absolutely never be removed from service. Bridge Condition Deterioration Modeling Federal Requirement. 23 CFR 515.7(b)(2). Deterioration models are required for TAMP assets. A life-cycle planning process shall, at a minimum, include the following: Identification of deterioration models for each asset class or asset sub-group, provided that identification of deterioration models for assets other than NHS pavements and bridges is optional The basis of life cycle planning is a deterioration model. For each structural element in the NBI inventory, the BMS contains an estimate of the median amount of time it takes to deteriorate from each condition state to the next-worst state. Expert judgment, reference literature and historical data are used to develop and update these estimates. The BMS uses this basic information to generate deterioration curves that forecast the change in condition over a long period of time. Figure 5.4 below shows a sampling of possible deterioration curves for reference. 5-16
97 Health index Louisiana DOTD Transportation Asset Management Plan Figure 5.4 Example Bridge Deterioration Curves A1- Concrete deck B2- Pourable joint seal C2- Coated metal rail D7- Reinforced concrete superstructure Bridge Treatments (Work Types) Age of element (years) Federal Requirement 23 CFR 515.7(b)(3). A life-cycle planning process shall, at a minimum, include the following: Potential work types across the whole life of each asset class or asset sub-group with their relative unit cost Bridge Maintenance and Rehabilitation Treatments. LADOTD has identified a number of low-cost preventative maintenance treatments, which can be used to extend the life of a bridge before falling out of a State of Good Repair. In addition, the Department will also start to target the use of rehabilitation treatments for at risk bridges which are likely soon to become structurally deficient without intervention. Table 5.6 below is just a few rows from a table that summarizes these potential bridge treatments. The actual table has seventy-seven (77) different PONTIS Elements Numbers that provide a proposed action, or in some cases multiple proposed actions, for each condition state, along with the unit treatment and replacement costs. 5-17
98 PONTIS Element # 10 (Stand-Alone) 12 (Primary) Element Description Asphaltic Concrete Overlay Deck - Concrete - Hardrock - Bare Deck - Concrete - Hardrock - w/ac Overlay Deck - Concrete Hardrock - w/coated Rebar Slab - Concrete - Precast - Hardrock - w/ac Overlay Slab - Concrete - Precast - Hardrock - Bare Bridge LCP Strategies Table 5.6 Small Sample of PONTIS Action and Cost Table Unit of Measure SF SF SF SF SF SF LADOTD Action/Cost Condition State 1 Condition State 2 Condition State 3 Condition State 4 Condition State 5 Do nothing Do nothing Do nothing Do nothing Do nothing Repair potholes Repair potholes Repair potholes and substrate Repair potholes and substrate $0.03 $0.21 $0.68 $3.41 Replace AC overlay Replace AC overlay Replace AC overlay $3.19 $3.19 $3.19 Do nothing Do nothing Do nothing Do nothing Do nothing Repair spalls/delam Repair spalls/delam Repair spalls/delam Repair spalls/delam; add an AC overlay $0.08 $0.50 $1.42 $25.14 Repair spalls/delam; add an AC overlay Replace Deck $3.72 $42.86 Do nothing Do nothing Do nothing Do nothing Do nothing Repair spalls/delam Repair spalls/delam Repair spalls/delam Repair spalls/delam; add an AC overlay $0.10 $0.63 $1.78 $27.65 Repair spalls/delam; add an AC overlay Replace Deck $4.09 $42.86 Do nothing Do nothing Do nothing Do nothing Do nothing Repair spalls/delam Repair spalls/delam Repair spalls/delam Repair spalls/delam; add an AC overlay $0.10 $0.63 $1.78 $25.14 Repair spalls/delam; add an AC overlay Replace Deck $4.09 $47.86 Do nothing Do nothing Do nothing Do nothing Do nothing Repair spalls/delam Repair spalls/delam Repair spalls/delam Repair spalls/delam; add an AC overlay $0.10 $0.63 $1.78 $27.65 Repair spalls/delam; add an AC overlay Replace Deck $4.09 $42.86 Do nothing Do nothing Do nothing Do nothing Do nothing Repair spalls/delam Repair spalls/delam Repair spalls/delam Repair spalls/delam; add an AC overlay $0.08 $0.50 $1.42 $25.14 Repair spalls/delam; add an AC overlay Replace Deck $3.72 $42.86 Federal Requirement. 23 CFR 515.7(b)(4). A life-cycle planning process shall, at a minimum, include the following: A strategy for managing each asset class or asset sub-group by minimizing its lifecycle costs while achieving the State DOT targets for asset condition for NHS pavements and bridges under 23 U.S.C. 150(d). LCP Strategy Defined. FHWA s interim guidance on using lifecycle planning to support asset management defines a lifecycle planning strategy as a collection of treatments that represent the entire life of an asset class or subgroup. Life Cycle Strategies. Similar to pavements, LADOTD has the bridge life cycle strategy of deploying the right treatment, at the right time, to gain the maximum possible life, at the most economical cost, from a pavement. Note also that the value of NHS bridges vastly exceeds the value of all NHS pavements as detailed in chapter 7. No asset sub-group has been eliminated from this analysis. Replacement Cost $3.19 $42.86 $42.86 $47.86 $42.86 $
99 As noted above, Table 5.6 is just a few rows from a table that summarizes these potential bridge treatments. The actual table has seventy-seven (77) different PONTIS Elements Numbers that provide a proposed action, or in some cases multiple proposed actions, for each condition state, along with the unit treatment and replacement costs. The BMS determines the actual collection of treatments, or strategies, for an asset class (Interstate, Non-Interstate NHS, etc.) and asset sub-group (steel bridge, concrete bridge, etc.), to be employed in any given year while maximizing the life cycle cost benefit decisions in the process. The BMS performs this analysis separately for each and every individual NHS bridge. Bridge Project Selection Process The following steps are used by the Bridge Preservation Project Selection Team in the selection of bridge projects for inclusion in the Highway Program: 1. The Bridge Design Section and Planning Section work together to identify projected funding for the eight-year Bridge Program. The appropriate program investment is determined to fulfill program needs. 2. A network analysis is performed based on the core elements for various projected outcomes using the Bridge Management System (BMS). Previously programmed structures are removed to perform the network analysis which queries data for selected criteria in order to determine a potential candidate list for repair, preventive maintenance, and rehabilitation, and replacement projects. The analysis is based on a specified element list and criteria for each type of project, which is set by the Program Manager. 3. The candidate selection focuses on the following: Removing Structurally Deficient Bridges from Enhanced NHS routes to meet MAP-21 performance goals. Repair, Preventive Maintenance and Rehabilitation projects that will improve or extend the service life of the structures. Return structurally deficient structures to a non-deficient condition. Remove posted bridges from established truck routes. Remove deficient timber bridges. 4. The potential candidate list is distributed to the Districts and Bridge Maintenance Section requesting the following: A District priority list of candidate structures based on the potential candidate list provided, Legislative and MPO input, and other needs not identified within the potential candidate list. 5-19
100 Stage 0 Structural Site Survey forms prepared for candidate structures to be considered for action. Prioritization of recommended candidate structures. 5. The District submits a prioritized list of structures for consideration, and a Stage 0 Structural Site Survey form for each structure. 6. The Program Manager prepares a list of projects composed of structures recommended by the Districts. A Stage 0 Parametric Cost Estimate is then prepared for each project. Additional work and structures may be added to projects to complete a section of roadway or complete a scope of work. 7. The Program Manager prepares a short list of proposed projects based on available funding. The short list is re-evaluated by the Bridge Management Unit to validate the recommendations by the Program Manager. 8. A meeting is held with the Bridge Preservation Project Selection Committee to discuss and select the final list of projects for the Bridge Preservation On-System Program, and the Bridge Preventive Maintenance Program which includes Historic Bridges. 9. Once the final selections are made, a transmittal of the final selections is sent back to the Districts to inform them which projects are being proposed for inclusion in the Highway Bridge Program. 10. The Program Manager orders project numbers and estimates funding requirements for the various phases of work to be performed on the project. This information is submitted to the Planning Section for inclusion in the Preliminary Highway Program. The Preliminary Highway Program for the upcoming fiscal year is submitted to the Joint Transportation Committee. The Preliminary Highway Program is used to present the program to the public during the annual October Road Show. 11. During the Legislative Session, the Highway Program is submitted to the Joint Transportation Committee for review and approval with changes from the Preliminary Highway Program noted. Approval of this document solidifies our program commitments to the Legislature. 12. Once projects are selected by the Bridge Preservation Project Selection Committee, the Project Manager assigned to the project may refine the alignment or concept, and then completes the other documentation. The Stage 0 Feasibility Study is submitted to the Program Manager for review and approval to move to Stage 3 Design. Additional details on the Bridge Preservation Project Selection Process including the Bridge Preservation Off-System Program, and the Local Public Agency (LPA) can be found in the current edition of the LADOTD Bridge Design and Evaluation Manual. 5-20
101 As needed, the Bridge Management Unit can run a network analysis taking into account programmed bridge projects to determine if appropriate structures and actions are consistent with Department goals. Existing BMS Solution and Issue. There is a lack of confidence in the analysis capabilities of previous versions of PONTIS to drive the project selection process. Although it is not used for selection, the work candidate list from PONTIS can be generated as another source for the Project Selection Team Plan. In PONTIS, the basis of LCP is a deterioration model. For each structural element in the Louisiana inventory, PONTIS contains an estimate of the median amount of time it takes to deteriorate from each condition state to the next-worst state. Expert judgment was used to develop these estimates for LADOTD. PONTIS uses this basic information to generate curves that forecast the change in condition over a long period of time. Sample curves are shown above in Figure 5.4. Each time an element deteriorates to its next condition state, one or more treatments become feasible, such as repairs or rehabilitation. Many of these treatments can potentially extend the service life of the bridge, but each also has a cost. PONTIS estimates the life cycle cost to keep the bridge in service, with and without the treatment, in order to see which alternative minimizes costs in the long term. Eventually, each bridge deteriorates to an advanced stage where replacement becomes necessary. Naturally, the owner of a facility wants to postpone this cost as much as possible. If costs can be postponed, then the money saved can be put to more important uses. In project level Life Cycle Cost Analysis (LCCA), this preference is quantified as a discount rate. A typical real discount rate is 2.3 percent. The term real means that the effects of inflation are removed from the computation in order to make the cost tradeoffs easier to understand. This discount rate divides any cost by a factor of for each year the cost is delayed. Although it is attractive to delay costs as much as possible and take advantage of the discount rate, there are limits. When maintenance is delayed or deferred, the condition of each asset gets worse and eventually affects the serviceability or even the safety of the infrastructure. Also, certain kinds of preventive maintenance actions are highly costeffective, but only if performed at the optimal time. For example, painting a steel bridge at the right time is highly effective in prolonging its life. If painting is delayed, at some point, too much of the steel is eaten away by rust, painting is no longer effective, and a much more expensive rehabilitation or replacement action is required. PONTIS identifies bridges that are already in a structurally deficient condition, as well as bridges that represent cost-effective life extension opportunities. It uses a benefit-cost ratio to prioritize all of these candidate projects, where the benefit of a project is the estimated savings in life cycle cost if an action is taken. Since funding is always constrained, only the highest priority bridges can be addressed. All other bridges are postponed until the following year or later, until they move up in priority and can be funded. 5-21
102 BMS Transition. LADOTD is currently implementing AASHTO s newest versions of PONTIS, AASHTOWare Bridge Management software (BrM), which considers not only life cycle cost, but also mobility, safety, risk and other performance concerns. LADOTD will also evaluate 3rd party BMS solutions from Deighton and AgileAssets to identify the most appropriate BMS solution going forward. As LADOTD implements and makes a final selection of a new and expanded bridge management system solution, it will need to upgrade its bridge inspection process and prepare forecasting models compatible with the new inspections and software. FHWA Inspection Improvements. Federal legislation specifies a number of important inspection process improvements, and the FHWA is currently preparing a new manual to document these improvements. LADOTD may need to update its deterioration models, treatment selections, costs, and treatment effectiveness to correspond to these changes. This will enable more advanced analysis of bridge deterioration and will also enable LADOTD to continue to quantify project benefits that affect risk, safety, mobility, and other performance concerns. 5-22
103 6.0 Risk Management Analysis 6.1 INTRODUCTION The international standard ISO defines risk as the effects of uncertainty on objectives. It its simplest terms, risk is anything that could be an obstacle to the achievement of goals and objectives. However, risks are more than just threats. Risks can be anything that may impede an objective or create a new opportunity. These risks may include, but are not limited to: Threats Variability Change Uncertainty Opportunity Risks may include, but are not limited to threats to transportation assets, variability in forecasted travel behavior, changes in rules and regulations, uncertainty of extreme weather conditions, and opportunity for increased or decreased financial support for assets. These risks can affect many aspects from budget allocations to retrofitting the design of a bridge for extreme weather threat mitigation. All levels of risks should be considered throughout the process in order to manage an agency s assets with the most efficient and effective strategies and methods. While risk management is a relatively new formal required for the TAMP, as a general rule, risk management is a common formal management method used worldwide in nearly every field of business. Existing Risk Management at LADOTD LADOTD is no exception to this general rule, with a number of formal risk controls in place in a number of different areas. Risk management one of the compelling factors that led to the implementation of pavement and bridge management systems and is a primary reason for conducting National Bridge Inventory (NBI) bridge safety inspections. Continuity of Operations Plan (COOP). LADOTD has essential functions that must be performed rapidly and efficiently in a disaster or emergency involving state-owned transportation infrastructure in the State of Louisiana. If the normal key staff and facilities are not available, LADOTD's Continuity of Operations Plan (COOP) ensures that LADOTD's essential functions can still be performed using alternate facilities, equipment, communications, and staffing. The COOP also includes assisting local governments in the movement of citizens, pets, and critical supplies during emergencies. 6-1
104 Project Risk Management. LADOTD has implemented an number of procedures, measures and software solutions to manage project risk. This ranges from digital design standards and the software solutions to validate project design compliance with these standards, to software solutions that provide the ability for the review of existing project item bids against historical and predicted bid item costs. Tools are also in place to evaluate contractor bids to identify if potential bid rigging might be occurring. Operational Risk Management. Maintenance superintendents are required to ride all the roads in their jurisdiction, at a minimum of every (2) two weeks, to inspect for any safety related or condition situations that warrant action. These could include activities such as replacing missing or damaged signs, pothole repair, guardrail or crash attenuator damage, shoulder edge drop-offs, and many other potential issues. In fact, field crews carry a supply of stop signs in their vehicles to immediately replace missing or damage signs when they are encountered. To support ongoing maintenance risk management effort, LADOTD replaced an old home-grown work order management system with a comprehensive third-party Maintenance Management System. With respect to guard rail and crash attenuator repairs, LADOTD has contracts in place to allow for immediate notification and rapid response to repair or replace these critical safety features. Procedural Risk Management. Other examples of risk management would include the qualified materials product list, various design manuals, the maintenance manual, and pavement condition protocols that support the pavement data collection QA/QC program, etc. Emergency Operations Risk Management. Prior to hurricane Katrina, LADOTD had created a dedicated Emergency Operations Section. Currently, all Emergency Ops staff members of this section are FEMA (Department of Homeland Security) trained and certified via National Incident Management System (NIMS), Incident Command System (ICS) and other FEMA specialty courses as appropriate. All other staff that are or may be engaged in response or recovery activities are also required to have certain FEMA/DHS course certifications as well. This staff is qualified to manage all aspects of emergency operations management and response for LADOTD. Emergency Operations Preparedness. LADOTD, along with many other Louisiana state agencies, conducted numerous simulated hurricane risk management exercises in order to gain expertise to allow for the most efficient management of the emergency requirements of large scale events. This led to the most efficient possible evacuation of the New Orleans residents, who chose to leave the city prior to hurricane Katrina s arrival. It included numerous risk management contracts that were activated to allow for contracted evacuation busses, Amtrak trains, and other support services. As an example of adapting to risk requirements, contra flow traffic control measures were in place for Hurricane s Katrina and Rita, essentially a lesson learned from an earlier New Orleans evacuation effort of a minor storm that turned away and did not hit the city. 6-2
105 Another example of a lesson learned was the creation of evacuation assistance options that allowed pet owners to take their pets along with them. LADOTD came to the realization that many pet owners simply would not evacuate if they were required to leave their pets behind. Risk Management Analysis Requirements Federal Requirement. (23 CFR 515.7(c)) The TAMP must describe a methodology for: Identifying risks that can affect the condition of NHS pavements and bridges, and the performance of the NHS, including the risks listed in 23 CFR 515.7(c)(1). Assessing the identified risks in terms of the likelihood of their occurrence and their impact and consequence if they do occur. The State DOT s process must include methods to explain how the risks were identified and describe what issues were considered for risk identification. The process must also include the following good practice elements: Evaluating and prioritizing the identified risks. Developing a mitigation plan for addressing the top priority risks that involve potentially negative consequences. Developing an approach for monitoring top priority risks. Including in the analysis, and considering, a summary of the results of the 23 CFR Part 667 evaluations of facilities in the State repeatedly damaged by emergency events, including at a minimum the results relating to NHS pavements and bridges. 6.2 LEVELS OF RISK MANAGEMENT LADOTD has identified formal risk registers for (3) three levels of risk including Department Level risks, Program Level risk and Project Level risk. Figure 6.1 below identifies the concepts behind these three risk levels. 6-3
106 Figure 6.1 Levels of Risk RESPONSIBILITY: Executives DEPARTMENT TYPE: Risks that impact achievement of Department goals and objectives and involve multiple functions STRATEGIES: Manage risks in a way that optimizes the success of the organization rather than the success of a single business unit or project. RESPONSIBILITY: Program managers PROGRAM TYPE: Risks that are common to clusters of projects, programs, or entire business units STRATEGIES: Set program contingency funds; allocate resources to projects consistently to optimize the outcomes of the program as opposed to solely projects. PROJECT RESPONSIBILITY: Project managers TYPE: Risks that are specific to individual projects STRATEGIES: Use advanced analysis techniques, contingency planning, and consistent risk mitigation strategies with the perspective that risks are managed in projects. Department Level. Department level risks affect the achievement of the Department s strategic objectives and are represented by items such as funding issues or changes in regulatory policies. The resulting changes in design standards required after Hurricanes Katrina and Rita is an example of risk mitigation effort for risk level. Executives must manage departmental risks in a manner that optimizes the success of the organization. The mitigation actions, or strategies to manage these risk, would best be accomplished by optimizing strategic level policies, procedures and management methods. Program Level. Program level risks affect the different funded programs in the Department such as the pavement or bridge preservation program or the safety program. These risks could include funding, lack of personnel for program delivery, or rapid deterioration of the pavement or bridge asset. The mitigation actions, or strategies to manage these risk, would best be accomplished by optimizing the programs efficiency and effectiveness. Project Level. Project level risks are generally unique to a specific project. In addition to the project examples provided in the introduction section of this chapter, further examples of project level risks include environmental clearance issues, geotechnical issues, right-of-way acquisition delays or outside interference in proper project selection. The mitigation actions, or strategies to manage these risk would be accomplished via continuing efforts to optimize the projects efficiency and effectiveness. 6-4

107 6.3 RISK METHODOLOGY Initial Risk Assessment The TAMP requirements identify than an extensive, integrated, formal risk management program is required at LADOTD. To address the initiall formal risk management program requirements, a FHWA contractor led a series of Risk Management Workshops in 2014 that resulted in the February 2015 Pilot Draft TAMP. LADOTD was one of the FHWA s (3) three DOT s chosen to develop pilot TAMPs. The workshops included stakeholders from throughout the Department and local FHWA. The Department s initial risk registers were developed via the following steps: 1. Risk Education Participants separated into working groups for the three risk levels (Department, Program, and Project). A brief training exercise followed with working groups being informed about the concept of risk registers including how to create them and how they will be used by the Department. 2. Risk Identification Additional workshops were held with the three working groups to identify the potential risks for their assigned risk level. The workshop participants also determined the proper description for each risk and identified possible causes of each risk. 3. Risk Analysis - Workshop participants then assessed the relative likelihood of occurrence and impact of each risk, using a risk matrix similar to the one in Figure 6.2, to evaluate each risk in terms of a risk rating consequence scale of low impact to critical. Figure 6.2 Risk Matrix 4. Risk Evaluation, Risk Mitigation, and Risk Finalization - A smaller core team then reviewed each risk register. The core team combined risks, when the same risks were duplicated in multiple categories (Department, Program, and/or Project Level) and then also finalized the risk rating consequence for each risk. 6-5
108 The core team also reviewed the proposed mitigation actions, or strategies to manage the risks identified by each team, to determine if mitigation strategies could impact and reduce other risks. Finally, the team performed a prioritization of the risks and finalized the risk registers Updated Risk Assessment Update Methodology. In early 2018, LADOTD conducted another set of risk management workshops to review and update these initial risk registers and to gain compliance with the final federal requirements. This update effort included a consideration of current and projected infrastructure conditions, along with potential funding issues, environment issues and geotechnical issues. In addition, staffing issues and potential loss of expertise were considered. Finally, changes in assets due to other programs (e.g., freight, safety, congestion) and other factors (e.g., climate change, extreme weather) were considered. Over the course of these update workshops, participants revised the risk registers including identifying additional risk not originally considered and identifying risk that could be removed from consideration. For all new risks, a qualitative risk assessment, based on likelihood of occurrence and the potential risk impact was conducted in order to identify the potential consequence should the risk occur. This risk assessment was based on the risk matrix shown above in Figure 6.2. The participants then identified the proposed mitigation actions/ strategies to manage the new risk. Next, the participants reviewed existing risks to determine if the past assessment still held true. When updates to impact and likelihood were made, new risk ratings were assessed. Next, the existing proposed mitigation actions/strategies to manage the risk were reevaluated and adjusted as necessary. Top-Rated Risks Update Methodology. The participants then used the proposed mitigation actions to aid in further identifying the Risk Mitigation Plan details for the risk rated as Critical or High. The mitigation plan efforts identified the Risk owners, the first step to take to begin to mitigate the risk and where appropriate, a projected implementation date. Following this effort, the team identified the necessary information to generate a Risk Monitor Plan for these top-rated risks. Potential methods to accomplish the monitoring effort along with the frequency of monitoring the risk and who would perform the monitoring effort were established. 6-6
109 RISK REGISTERS Tables 6.1 through 6.3 below are LADOTD s updated risk registers with the top priority risk identified. Note that the Risk Numbers are not in a sequential order due to the fact that this is not the first risk assessment and the risk ratings for these risks have been updated. Table 6.1 Departmental Level Risk Register Risk # Risk Description Impact Likelihood Risk Rating D2 Loss of staff Major Almost Certain Critical D4 Insufficient match for federal funds Major Almost Certain Critical D6 Bridge Closure Major Almost Certain Critical D1 Lack of operating funding Major Very Likely High D5 Weather events (Hurricanes, Floods, Ice Storms, etc.) includes 23 CFR part 667 Moderate Almost Certain High D7 Adverse legislative actions to priority programs Major Likely High D12 D3 D8 D9 D10 D11 Very large bridge becomes Structurally Deficient Cut in federal funding Negative public opinion Changes in regulatory policy Continuity of operations Terrorist/criminal acts Major Likely High Major Unlikely Medium Moderate Likely Medium Moderate Likely Medium Major Rare Low Catastrophic Rare Low 6-7
110 Table 6.2 Program Level Risk Register Risk # Risk Description Impact Likelihood Risk Rating PM2 Increased truck weights increase deterioration rates of existing infrastructure. Catastrophic Almost Certain Critical PM1 PM4 PM5 Lack of reliable traffic loading data decreases confidence and effectiveness of pavement design Public demand for low construction impacts increases costs and decreases quality Lack of personnel for program delivery Major Likely High Moderate Almost Certain High Moderate Very Likely High PM10 Political pressure for suboptimal projects Moderate Almost Certain High PM3 Unexpected sustained revenue decreases Major (pavement) Catastrophic (bridge) Unlikely Medium (pavement), Medium (bridge) PM6 PM7 PM9 PM8 Emerging technologies improve efficiencies Diversion of work force to other activities (e.g., storm response) Unexpected revenue increase in program level that cannot be covered by projects on the shelf Increased lane miles increases long term preservation costs Moderate Likely Medium Minor Very Likely Medium Moderate Likely Medium Moderate Unlikely Low 6-8
111 Table 6.3 Project Level Risk Register Risk # Risk Description Impact Likelihood Risk Rating PJ1 PJ2 Railroad Agreement (or lack thereof) can delay project Scope creep on projects that increase cost Major Almost certain Critical Major Likely High PJ3 Contractor quality Major Likely High PJ5 PJ6 PJ7 Lack of experience of project delivery staff ROW acquisition problem or delay Utility relocation problem or delay Major Very Likely High Major Likely High Major Likely High PJ8 PJ14 PJ 15 PJ4 PJ9 PJ10 PJ11 Environmental document and permitting delays Lack of DBE Subcontractor availability increase cost IT System Ownership causes insufficient support Public Involvement delays/kills the project Overworked project delivery staff decreases efficiency Large change orders increase cost Lack of contractor availability increase cost Major Likely High Moderate Very Likely High Major Very Likely High Major Unlikely Medium Minor Very Likely Medium Moderate Likely Medium Major Unlikely Medium PJ12 Lack of control of Design- Build projects (quality issue) Moderate Unlikely Low PJ13 Low estimates Minor Unlikely Low 6-9
112 6.5 RISK MITIGATION AND MONITORING PLAN Risk Mitigation Plan. Agencies are now required to develop a Risk Mitigation Plan for the top-rated risk identified in the risk registers. This involves identifying either the mitigation actions or strategies to manage the risk, identifying the risk owner, providing for an implementation date and identifying the initial step to get these actions, or strategies, started. Methodology. During the 2018 risk workshops, participants reviewed and updated the proposed mitigation actions, or strategies to manage the risks. They then identified the owners of the individual risks, identified a realistic implementation date for these actions and strategies, and identified the first step required to initiate the mitigation plan. Risk Monitoring Plan. Also, agencies are now required to monitor the top-rated risk identified in the risk registers. LADOTD began this workshop activity by identifying the method used to accomplish the monitoring effort, this includes, but is not limited to, taking corrective actions, performing data analysis, using various legal activities, conducting meetings, updated or new policy/procedural changes, reports, etc. Methodology. Next participants defined the frequency the individual would be monitored and who would be responsible for the monitoring activity. The mitigation and monitoring results are show below in Tables 6.4 through
113 Risk # Risk Description Risk Rating D2 Loss of staff Critical D4 D12 Table 6.4 Departmental Level Risk Mitigation & Monitoring Plan 2018 Top Priority Risk Department Level Mitigation Plan Insufficient match for federal funds D6 Bridge Closure Critical D1 Lack of operating funding High D5 D7 Weather events (Hurricanes, Floods, Ice Storms, etc.) 23 CFR part 667 Adverse legislative actions to priority programs Very large bridge becomes Structurally Deficient Mitigation Action or Strategy to Manage Risks Continue succession planning strategies to keep productive employees and focus on recruiting to attract new employees. Continue to cross train employees for the ability to continue delivering services when key employees retire or resign. Continue to employ the workforce development program and structured training to advance the ability of our workforce. Outsource when necessary to fill void of reduced staff. Restructure State highway program to allow for maximum funding for match to the federal program. Cut the following programs: Port and Flood Control Owner(s) Projected Implementation Date First Step Method To Accomplish Frequency Who Performs HR Ongoing Maintain Current Actions Procedure - Update Ongoing Each Section HR Ongoing Maintain Current Actions Training Ongoing Each Section Curriculum Council Ongoing Maintain Current Actions Training Ongoing Each Section HR Ongoing Maintain Current Actions Contracting As Necessary Section Head Parish Transportation Fund Critical State Police Executive Staff As Necessary Annual Finance Forecast & Analysis Policy - Update As Necessary High High LADOTD Operating Budget Use toll credits as match for federal funds. Apply for General Obligation bonds and State General Fund monies to offset reductions. Possible reduction in the level of service. Continue to strictly control the issuance of truck permits to control overweight trucks. Focus funding on bridge preservation. Continue to operate a comprehensive bridge inspection program. Educate elected officials on funding needs. Employ strategic thinking and continuous improvement for efficiency within the Department. Truck Permits Ongoing Maintain Current Actions Procedure - Existing Ongoing Truck Permits Bridge Project Selection Team Annually Data Analysis Procedure - Existing Ongoing Bridge Project Selection Team Section 51 Ongoing Maintain Current Actions Procedure - Existing Ongoing District Inspectors Secretary Continuously/ Annually Maintain Current Actions Meeting(s) Ongoing Secretary Executive Staff Continuously Maintain Current Actions Meeting(s) / Procedure - Update Ongoing QCIP Elimination of low priority services. Executive Staff As Necessary Annual Budget Review Corrective Action(s) As Necessary Executive Staff Possible reduction of staff. Executive Staff As Necessary Annual Budget Review Other As Necessary Executive Staff Implement design standard changes and infrastructure hardening to mitigate possible damages and improve resiliency. Dedicated and fully functional emergency preparedness program & staff while maintaining comprehensive disaster recovery plan. Fully support to the local levee districts and flood control programs. Conduct annual evaluations/analysis for facilities in the State repeatedly damaged by Part 667 emergency events Develop actions to address vulnerabilities and risks identified in the Part 667 analyses Continue to implement a transparent project selection process. Encourage the continence of strong statutory controls. Continue active liaison efforts and legislative education/outreach. Chief Engineer Secretary of Operations As Necessary Post Event Assessment to Identify Need Policy & Procedure - Existing As Necessary Design Sections Continuously Maintain Current Actions Procedure - Existing Ongoing Emergency Operations Public Works As Necessary Event Based Procedure - Existing As Necessary HQ & District Staff Secretary of Operations Secretary of Operations Assistant Secretary of Planning Annually / As Necessary Annual Review / After Action Review Monitoring Top Priority Risks Data Analysis As Necessary As Necessary After Action Review Data Analysis As Necessary QCIP Annual Maintain Current Actions Procedure - Existing Annually Annual Risk Update Team / QCIP Transportation Planning Section Secretary Continuously Maintain Current Actions Meeting(s) Ongoing Secretary Secretary Continuously Maintain Current Actions Meeting(s) Ongoing Legislative Liaison High Repair with emergency action Executive Staff As Necessary Determine Corrective Action Allocate Funds As Necessary Statewide Planning Office of Engineering 6-11
114 Risk # Risk Description Risk Rating PM2 PM1 PM4 PM5 PM10 Table 6.5 Program Level Risk Mitigation & Monitoring Plan 2018 Top Priority Risks Program Level Mitigation Plan Increased truck weights increase deterioration rates of existing infrastructure. Lack of reliable traffic loading data decreases confidence and effectiveness of pavement design Public demand for low construction impacts increases costs and decreases quality Lack of personnel for program delivery Political pressure for suboptimal projects Critical High High High High Mitigation Action or Strategy to Manage Risks The Department shall aggressively communicate implications to infrastructure. Educate legislature on impact to the pavement and bridge system. Collect permanent WIM data at 20 locations across the State which will determine regional loading factors that can be used for design. Educate legislature and public on the impacts of night time construction to the cost to a project that minimizes impacts to users. Employ succession planning strategies to keep productive employees and focus on recruiting to attract new employees. Continue to cross train employees for the ability to continue delivering services when key employees retire or resign. Continue to employ the workforce development program and structured training to advance the ability of our workforce. Possible outsourcing needed to fill void of reduced staff. Educate legislature on impact to infrastructure level of service. Educate legislature about Federal Laws, Requirements, etc. Enforce statute that requires project selection to follow the annual highway priority process. Owner(s) Projected Implementation Date Secretary Ongoing Maintain Current Actions Secretary Ongoing Maintain Current Actions Assistant Secretary Planning First Step Method To Accomplish Frequency Who Performs Meeting(s) / Multi-Media Options Continuously Secretary HR Ongoing Maintain Current Actions Procedure - Update Ongoing Each Section HR Ongoing Maintain Current Actions Training Ongoing Each Section Curriculum Council Ongoing Maintain Current Actions Training Ongoing Each Section HR Ongoing Maintain Current Actions Contracting As Necessary Section Head Secretary Ongoing Maintain Current Actions Secretary Ongoing Maintain Current Actions Assistant Secretary Planning Monitoring Top Priority Risks Meeting(s) / Multi-Media Options Meeting(s) / Multi-Media Options Meeting(s) / Multi-Media Options Continuously Early 2019 Advertise Consulting Contract Contracting Annually Secretary Ongoing Maintain Current Actions Meeting(s) / Multi-Media Options Ongoing Ongoing Ongoing Ongoing Maintain Current Actions Procedure - Existing As Necessary Secretary Section 21 Data Collection Secretary / Public Information Office Secretary Secretary Assistant Secretary Planning 6-12
115 Table 6.6 Project Level Risk Mitigation & Monitoring Plan Risk # Risk Description Risk Rating PJ1 PJ2 Mitigation Action or Strategy to Manage Risks Owner(s) Projected Implementation Date First Step Method To Accomplish Frequency Who Performs Start working with railroad early. Project Managers As Necessary Maintain Current Actions Procedure - Existing As Necessary Work on developing better relationships with the railroad companies. Commissioner of Multimodal Commerce Ongoing Maintain Current Actions Meeting(s) Ongoing Railroad Agreements Engineer Freight and Passenger Rail Director Improved scoping skills of the project managers. Curriculum Council Ongoing Maintain Current Actions Training As Necessary LTRC Continue to improve communication among groups within the department. Project Managers Ongoing Maintain Current Actions Meeting(s) Ongoing Project Managers Enforcement of existing policies. Project Managers Ongoing Maintain Current Actions Policy - Enforcement As Necessary Project Managers PJ3 Contractor quality High HQ Construction & Continue to improve enforcement of specifications. Project Managers Ongoing Maintain Current Actions Policy - Enforcement As Necessary Project Engineers Employ succession planning strategies to keep productive employees and focus on recruiting to HR Ongoing Maintain Current Actions Procedure - Update Ongoing Each Section Continue to cross-train employees for the ability to continue delivering services when key employees HR Ongoing Maintain Current Actions Training Ongoing Each Section PJ5 Lack of experience of retire or resign. High project delivery staff Continue to employ the workforce development program and structured training to advance the Curriculum Council Ongoing Maintain Current Actions Training Ongoing Each Section ability of our workforce. Possible outsourcing needed to fill void of reduced staff. HR Ongoing Maintain Current Actions Contracting As Necessary Section Head PJ Top Priority Risks Project Level Mitigation Plan Railroad Agreement (or lack thereof) can delay project Scope creep on projects that increase cost ROW acquisition problem or delay Critical High Monitoring Top Priority Risks High Start working with Right-of-Way section earlier. Project Managers As Necessary Access Need Procedure - Existing As Necessary Real Estate Section PJ7 Utility relocation problem or delay High Work with utility companies early to try and mitigate any issue. Project Managers As Necessary Access Need Procedure - Existing As Necessary Road Design Utility Unit PJ8 Environmental document and permitting delays High Start working with environmental section earlier. Project Managers As Necessary Access Need Procedure - Existing As Necessary Environmental Section PJ14 Lack of DBE Subcontractor availability increase cost High Recruit new DBE Subcontractors Compliance Section Ongoing Continue Recruitment Meeting(s) / Multi-Media Options Ongoing Compliance Section PJ 15 IT System Ownership causes insufficient support High Regain control of critical DOTD systems Undersecretary Ongoing Identify Critical Systems Meeting(s) / Multi-Media Options As Necessary Undersecretary 6-13
116 6.6 FACILITIES IN THE STATE REPEATEDLY DAMAGED BY EMERGENCY EVENTS Federal Requirement. 23 CFR Part Each State, acting through its department of transportation (State DOT), shall conduct statewide evaluations to determine if there are reasonable alternatives to roads, highways, and bridges that have required repair and reconstruction activities on two or more occasions due to emergency events. Reasonable alternatives include options that could partially or fully achieve the following: (1) Reduce the need for Federal funds to be expended on emergency repair and reconstruction activities; (2) Better protect public safety and health and the human and natural environment; and (3) Meet transportation needs as described in the relevant and applicable Federal, State, local, and tribal plans and programs. Relevant and applicable plans and programs include the Long-Range Statewide Transportation Plan, Statewide Transportation Improvement Plan (STIP), Metropolitan Transportation Plan(s), and Transportation Improvement Program(s) (TIP) that are developed under part 450 of this title. Definition. Repair and reconstruction means work on a road, highway, or bridge that has one or more reconstruction elements. The term includes permanent repairs such as restoring pavement surfaces, reconstructing damaged bridges and culverts, and replacing highway appurtenances, but excludes emergency repairs as defined in 23 CFR CFR Part Data time period, availability, and sources: (a) The beginning date for every evaluation under this part shall be January 1, The end date must be no earlier than December 31 of the year preceding the date on which the evaluation is due for completion. Evaluations should cover a longer period if useful data is reasonably available. Subject to the timing provisions in 667.7, evaluations must include any road, highway, or bridge that, on or after January 1, 1997, required repair and reconstruction on two or more occasions due to emergency events. (b) State DOTs must use reasonable efforts to obtain the data needed for the evaluation. If the State DOT determines the necessary data for the evaluation is unavailable, the State DOT must document in the evaluation the lack of available data for that facility. (c) A State DOT may use whatever sources and types of data it determines are useful to the evaluation. Available data sources include reports or other information required to receive emergency repair funds under title 23, other sources used to apply for Federal or nonfederal funding, and State or local records pertaining to damage sustained and/or funding sought. 6-14
117 23 CFR Part Timing of evaluations: (a) Not later than November 23, 2018, the State DOT must complete the statewide evaluation for all NHS roads, highways and bridges. The State DOT shall update the evaluation after every emergency event to the extent needed to add any roads, highways, or bridges subject to this paragraph that were affected by the event. The State DOT shall review and update the entire evaluation at least every 4 years. In establishing its evaluation cycle, the State DOT should consider how the evaluation can best inform the State DOT's preparation of its asset management plan and STIP. (b) Beginning on November 23, 2020, for all roads, highways, and bridges not included in the evaluation prepared under paragraph (a) of this section, the State DOT must prepare an evaluation that conforms with this part for the affected portion of the road, highway, or bridge prior to including any project relating to such facility in its STIP. 23 CFR Part Consideration of evaluations: (a) The State DOT shall consider the results of an evaluation prepared under this part when developing projects. State DOTs and metropolitan planning organizations are encouraged to include consideration of the evaluations during the development of transportation plans and programs, including TIPs and STIPs, and during the environmental review process under part 771 of this title. Nothing in this section prohibits State DOTs from proceeding with emergency repairs to restore functionality of the system, or from receiving emergency repair funding under part 668 of this title. (b) The FHWA will periodically review the State DOT's compliance under this part, including evaluation performance, consideration of evaluation results during project development, and overall results achieved. Nothing in this paragraph limits FHWA's ability to consider the results of the evaluations when relevant to an FHWA decision, including when making a planning finding under 23 U.S.C. 134(g)(8), making decisions during the environmental review process under part 771 of this title, or when approving funding. The State DOT must make evaluations required under this part available to FHWA upon request. Part 667 Methodology Initial Methodology. LADOTD s initial effort to provide for this requirement involved seeking assistance from the local office of the FHWA to analyze Fiscal Management Information System (FMIS) data to identify projects that would include highways or bridges that have required repair and reconstruction activities on two or more occasions due to emergency events. These projects would use federal emergency relief (ER) funds. LADOTD assumed that this was the best available data to meet this requirement. While a number of projects existed that used federal ER funds, no FMIS projects meeting this repeatedly damaged requirement were found. It was understood that LADOTD would monitor these assets going forward to ensure efforts were made to prevent a repeat event from happening if possible. 6-15
118 Methodology Update. LADOTD recently came to a new understanding of this requirement, noting that it also included state declared emergencies, not just federal declared emergencies. Additionally, after November 23, 2020, LADOTD must prepare an evaluation for all STIP road, highway, and bridge projects. LADOTD also notes the additional federal requirements listed above. As a result, going forward, a committee led by the AME will conduct an investigation to identify all potential state-maintained pavements and bridges that could have also been included in these additional criteria. This will involve investigating all potential data, maps, 511 calls, declarations of emergency, etc. to produce the best available data for a more comprehensive assessment. The outcome of this investigation will be reported to the TAM Steering Committee and the Executive Champion. This effort could result in additional policy and procedure updates, as well as potential risk management updates. This effort is expected to be completed by the end of the 2018 calendar year. Part 667 Tracking Solution. The AME will also endeavor to have a Part 667 tracking solution implemented in the departments GIS based Road and Highways solution to manage this effort into the future. This solution will provide easy access to all staff required to evaluate these assets in the development of transportation plans and programs, including TIPs and STIPs, and during the environmental review process under part 771 of this title. Upon completion, this solution will ensure that LADOTD remains compliant with all Part 667 requirement going forward. 6.7 THREE R S - REDUNDANCY, ROBUSTNESS, RESILIENCY Asset Management is not a complete answer to addressing the threats to physical transportation assets but it can serve as an important component of the Three R s, particularly in making assets robust and agencies asset-repair practices resilient in times of crisis. An agency may not be able to plan for every threat. However, by creating a transportation network and a transportation agency that includes redundancy, robustness and resiliency, it possesses the tools to more ably cope with a wide and unpredictable range of threats. This general preparedness has been called an all hazards approach that suggests that planning for one kind of hazard or threat can increase an agency s or a community s ability to deal with others. LADOTD intends to make every effort to implement the Three R s going forward as the TAM effort matures under the ongoing TAMP implementation. This will be especially true for critical at-risk bridge structures. 6-16
119 Three R s 4 Redundancy can be defined as duplicative or excess capacity that can be used in times of emergency. Adding redundant highway capacity generally falls outside the practice of asset management. However, sound management of the assets on detour and emergency evacuation routes increases a highway system s redundancy. Robustness can be defined as the capacity to cope with stress or uncertainty. Asset management focuses upon optimizing the conditions of assets with available revenues. Well-maintained assets generally are better able to withstand the stresses of storm events and other disasters better than weakened and poorly maintained ones. Resiliency has been defined as the ability to prepare and plan for, absorb, recover from, and more successfully adapt to adverse events. Enhanced resilience allows better anticipation of disasters, better planning to reduce disaster losses and faster recovery after an event. A risk-based asset management program contributes strongly to all three, particularly robustness and resiliency. 3 R Practices 1. Providing accurate inventories of assets and their condition assists with identifying which assets are at risk for given types of events such as floods, hurricanes, or earthquakes. 2. Sound maintenance practices within an asset management regime hardens assets. Well maintained drainage structures are better able to withstand floods. Sound high-mast lights and overhead signs are more wind-resistant. Bridges with well-maintained wing walls, bank protection and scour protection are more robust during high water. Pavements with cleaned under drains and catch basins drain more quickly and perform longer. 3. The hierarchal prioritization of critical assets conducted in a risk-based asset management program provides priorities for asset repair after events. 4. Asset management staffs become competent at asset management scenario planning, which is critical when developing a post-event recovery plan. 5. Sound asset inventories and good unit-cost data assist with estimating recovery costs. 6. Asset mapping and GIS capability assists with identifying assets and prioritizing their coordination with evacuation planning. 7. Complete and accurate inventories of traffic control devices, signs, guardrail and culverts allows the faster development of contract plans immediately after a flood or hurricane. Contractors can be instructed to restore the assets that existed before the event. 8. Risk-management capability provides not only critical before-event prioritization but also is useful in post-event recovery allocation of resources. 4 Report 5: Managing External Threats Through Risk-Based Asset Management; FHWA March
120 6.8 ROLE OF RISK MANAGEMENT IN THE ASSET MANAGEMENT PROCESS All three of LADOTD s risk registers will be used throughout the asset management process, when setting the budgets, prioritizing projects and revising asset management guidance. The following describes how each of the risk registers will be used in the process: Department and Program Level Risks The Executive Staff meets once a year to set the Departments goals and objectives and to set the funding appropriations for the various programs. During this meeting, the Departmental risks, which are the global level risks, are considered when setting the funding levels for the various programs in a manner that the Department can most effectively meet our asset performance targets. Project Level Risks As per the Department s Highway Project Selection Process Manual, there are project selection committees for each of the funded programs. These selection committees meet once each year to prioritize the projects for the next year s program of projects. During this meeting, the project selection committees will review the Project Level risks and then consider these risks when prioritizing the projects so that the program will efficiently and effectively appropriate the funding to meet the Department s performance targets. Existing policies and procedures will be adjusted, and if necessary, new policies will be generated to support this requirement. The roles of the risk management and risk registers will help the Department become more efficient in managing transportation assets. 6.9 FUTURE RISK REGISTER UPDATES In the first quarter of each calendar year, LADOTD s Asset Management Engineer will conduct workshops to identify any changes needed in the working risk registers via the procedures outlined in the Risk Methodology section of this chapter. Over the course of these future workshops, participants will review and update the existing risks, identify and process any new risks and remove risks that no longer apply. 6-18
121 7.0 Financial Plan and Asset Valuation 7.1 INTRODUCTION A financial plan provides the link between an agency s strategic objectives and the improvement programs that identify projects. The federally required 10-year TAMP financial plan has elevated the importance of the financial plan and strengthened the link between the financial plan and the improvement programs for physical assets such as pavements and bridges. In addition, individual involved in asset management are now more aware of the need for long-term financial planning and its impact on agency goals and funding allocations. For LADOTD, the overall investment strategies, used to generate the financial plan, must tie into LADOTD s mission to provide a safe and reliable multimodal transportation and infrastructure system that enhances mobility and economic opportunity. With regard to LADOTD s primary asset classes included in this TAMP (roadways and bridges), this means the investment strategies must enhance quality of life and economic growth by enabling individuals and businesses to efficiently and effectively travel the State s system of roads and bridges in a safe manner. In doing so, LADOTD will accomplish its mission. The financial components in the TAMP also provide an opportunity for the agency to convey to outside stakeholders that it is being accountable in managing assets effectively using preservation strategies that help to maintain asset conditions. Financial Plan Development Federal Requirement. 23 CFR 515.7(d) identifies the TAMP must describe a methodology for producing a financial plan that: Covers at least a 10-year period. Includes the estimated cost to implement the investment strategies by State fiscal year and work type. Includes the estimated funding levels that are expected to be reasonably available, by fiscal year, to address the costs of implementing the investment strategies, by work type. Identifies anticipated sources of available funding. Includes a summary asset valuation for the State s NHS pavement and bridges, including the investment needed on an annual basis to maintain the asset value. 7-1
122 7.2 FINANCIAL PLAN Methodology LADOTD uses a number of financial strategies, documented in chapter 8, to advise the future budget projections outlined in the budget partitions that are generated for the next 10 years. This 10-year plan allows for more precise needs-based analysis than are possible within the 30-year horizon of the Statewide Transportation Plan. Based on projected funding sources, and federally and state legislative constrained funding uses, LADOTD identifies the available funding that can be applied to pavements and bridges. Using the PMS and BMS predictive capabilities, LADOTD is able to analyze any number of various long-term funding scenarios to identify the resulting effect on pavement and bridge condition. These analyses are informed by the imbedded various treatments, or work types, along with the associated costs to implement each work type. LCP methodologies are employed to ensure that limited funding resources are used in the right place, at the right time, to produce the largest return for the given investment. If there is insufficient funding to meet performance targets, a cross-asset resource allocation analysis strategy is performed. This cross-asset resource allocation strategy results in a funding mix change for one or more of the other road and bridge asset classifications, until there is a consensus that the adopted funding scenario will be the best solution to achieve the Department s mission, and federal requirements, with the constrained funding. In a significant funding shortfall, the strategy must then focus on doing everything possible to minimize the decline of assets into an unusable state. This is accomplished by completely eliminating capacity projects and focusing the very limited available funding on scenarios that attempt to keep critical assets, with the most traffic, functional and safe. For the lower traffic volume facilities, bridges become the point of focus as you can t cross a closed bridge, while roads could unfortunately revert back to gravel and still be serviceable. For the remainder of this chapter, the following financial plan elements are provided: Financial resources Budget allocation Historical funding levels for pavement and bridge Forecasted funding and condition levels for pavement and bridge Asset valuation methodology 7.3 OVERALL FINANCIAL RESOURCES The funding that LADOTD has available for pavement and bridge preservation is part of the overall annual funding allocation that it receives from the Legislature. There are many 7-2

123 revenue sources that make up the overall annual operating and capital budgets. Figure 7.1 below shows the sources of the SFY overall funding which totals $1.9 billion. Funding Flexibility Confusion. There is often confusion, when the total funding dollar amount is discussed, as the general public believes that LADOTD can do what it wants with the funding. That couldn t be further from the truth. Not only does LADOTD have legislatively mandated Aviation and Port funding responsibilities, along with Safety Program responsibilities, a high percentage of federal funding is allocated to the Non-Discretionary program via federal mandates such as Transportation Alternatives Projects, Urban System, Congestion Mitigation/Air Quality, Federal Earmarks, and more. It must be noted that a significant portion of the Federal Funding dollars are simply not available for pavements and bridges. The actual available Pavement and Bridge funding is reviewed later in this chapter. More Information. A detailed description of each funding source can be found in the appendix, LADOTD Revenue and Budget Allocation Descriptions while the projected pavement and bridge funding for the next ten years is included in the appendix, LADOTD 10 Year Pavement & Bridge Projected Budget. Figure 7.1 LADOTD SFY Funding Sources (millions) All data from HB1(Act ) & HB2(Act ) Except $0.04 TTF from TTF Distribution Spreadsheet 9/9/
124 7.4 OVERALL BUDGET ALLOCATION PROCESS The Financial Plan Development Process begins with a forecast of federal and state funding. The Statewide Transportation Plan includes a 30 year revenue forecast based on four scenarios which are level funding, reduced federal funding, moderate growth and robust growth. The TAMP ten-year financial plan utilizes some of the assumptions in the Statewide Transportation Plan financial forecast, but first starts off by utilizing the five year State forecast from the State Revenue Estimating Conference. This group is composed of the President of the Senate, Speaker of the House, Commissioner of Administration and an economist from Louisiana State University (LSU). The Legislative Fiscal Office economist and the Division of Administration economist both present their five year forecasts to the Conference members at meetings conducted a minimum of twice per year and the selected forecast becomes the official revenue for the State as well as the TAMP. Once the revenue forecasts for the next ten years are agreed upon by LADOTD s Project Development Steering Committee and the Executive Committee, LADOTD s Budget Office goes through an iterative process whereby the funding needed for the operating budget (personnel services, professional and consulting contracts, supplies, equipment, etc.) is funded first and then the remaining amount is deemed available for the other programs and the constitutionally permitted uses of the Transportation Trust Fund (TTF). The resulting document is the TTF Distribution Worksheet which is maintained by LADOTD s Budget Director. The current TTF Distribution Worksheet covers the actual revenues and expenditures for SFY and SFY , the projected revenues and expenditures for the current SFY and the requested revenues and expenditures for SFY , SFY and SFY A copy can be found in the appendix LADOTD Transportation Trust Fund Distribution. The capital program for highways and bridges is called the Highway Priority Program. The funding available for the Highway Priority Program, determined by the previous step, is partitioned into categories and subcategories based on the different types of assets and/or needs of the system. This effort is performed by the Transportation Planning section in the Office of Planning with Executive Committee oversight and uses inputs from the pavement and bridge management systems to model budget impacts on systems. This document is called the Budget Partition and is maintained by the Office of Planning. The budget partition for SFY can be found in the appendix LADOTD State FY Budget Partition. Funding Breakdown. The funding levels available for pavement and bridges are broken down into the four classifications of highways. The funding levels are set based on available funding, historical funding levels, and goals of the Statewide Transportation Plan, TAMP requirements, investment strategies and performance targets. Once the budget partitions 7-4

125 are set and the capital funding available for the different subcategories of the budget partition are known, the projects in the annual Highway Priority Program are determined using the process set forth in LADOTD s Highway Project Selection Process Manual. The allocation of these funds is shown in below Figure 7.2. A detailed description of each budget allocation can be found in the appendix LADOTD Revenue and Budget Allocation Descriptions. It should be noted that in the figure below, Appropriated to Others includes $23 million to the State Highway Improvement Fund debt service and $46.4 million to the Parish Transportation Fund. Figure 7.2 LADOTD SFY Funding Uses (millions) All data from HB1(Act ) & HB2(Act ) Or TTF Distribution Spreadsheet 9/9/ HISTORICAL FUNDING LEVELS For a number of year, LADOTD has been focusing on sustainability (preservation, rehabilitation & reconstruction) projects with very little funding available for capacity projects. This is due to limited funding. 7-5
126 In Table 7.1 below we review the historical expenditures, or Budget Recap, for the previous five years and see the various funding amounts along with the percentage each of these represent in the total budget partition funding. Included in Table 7.1 are the green highlighted sub-partitions that are relevant to the TAMP. It should be noted that the overall percentage of expenditures for the Preservation budget partition (which includes preservation, rehabilitation and replacement of assets) has averaged 51.9% of the total budget partition for the past five years; however that value had a high of 58.8% in SFY and a low of 43.4% in the most recent SFY Non-Discretionary funding is currently set at 26.0% in SFY from a high of 39.8% in SFY TAMP Assets. Unfortunately for the most part, the budget recap does not provide for a separation of NHS assets from other state-maintained assets. The Road Preventive Maintenance, the Bridge Preventive Maintenance, the Bridge -on system, and the Movable Bridge Rehab/Preventive Maintenance categories are lumped together. The Interstate Pavements and Non-Interstate NHS pavements do show that, for both asset classes, preservation dollar totals have been continuously increasing. Mandated Funding. As mentioned earlier, not only does LADOTD have legislatively mandated Aviation and Port funding responsibilities, along with Safety responsibilities, a high percentage of federal funding is allocated to the Non-Discretionary program via federal mandates, so a significant portion of the Federal Funding dollars are simply not available for pavements and bridges. The funding totals and percentage of the total budget are detailed in Table 7.1. Table 7.1 Relevant Historical TAMP Budget Recap (millions by state fiscal year) Budget Recap TAMP Specific Sub-Categories Budget % of Grand Total Budget % of Grand Total Budget % of Grand Total Budget % of Grand Total Budget Sustainability Program Totals % % % % % Non-Interstate NHS - Pavements % % % % % Non-Interstate - Pavements - Non-Fed Aid (1) % % % % % Road Preventive Maintenance % % % % % Interstate - Pavement % % % % % Bridge - On-System % % % % % Bridge Preventive Maintenance % % % % % *Bridge - Off System (Not TAMP Relevant) (2) % % % % % % of Grand Total Operations Total % % % % % Movable Bridge Rehab / Preventive Maintenance % % % % % Safety Program Total (2) % % % % % Capacity Program Total % % % % % **Non-Discretionary Program Total (2) (3) % % % % % * Included to show all preservation totals SFY Grand Total (1) - Includes SHIF Bonds in years & 14-15; (2) - Does not include local match; (3) - Does not include Planning, Training, or Research SFY SFY SFY SFY ** Non-Discretionary Program: TIMED Debt Service, Transportation Alternatives Projects, Urban System, Congestion Mitigation/Air Quality, Federal Earmarks, Road Transfers, Intermodal Connectors, etc. 7-6

127 7.6 PROJECTED FUNDING LEVELS In Figure 7.3 below, we see LADOTD s continuing trend of focusing as much future funding as possible on the Preservation budget partition, with respect to the other project categories. Capacity Budget Eliminated. In SFY , the Capacity budget is no longer sustainable. While LADOTD s clear fiduciary responsibility is to maintain the existing assets in the best condition possible, the inability to gain access to additional funding is also clearly identified in the declining funding percentages across the remaining budget partitions. Figure 7.3 Projected Budget Partition Percentages (percent by state fiscal year) Table 7.2 below provides the projected Preservation funding over the 10-year TAMP analysis period. The funding, based on various funding scenarios applied to the PMS along with a cross-asset resource allocation analysis, provides for steady state funding on Interstate and Non-Interstate NHS pavements and will allow LADOTD to retain its desired state of good repair for these asset classes. That is not the case for the SHS & RHS pavements which will continue to decline with the available funding. Budget Line Item Table Year Preservation Budget Projections SFY 2022 Scenarios (Statewide Transportation Plan) Year Preservation Budget Projection* Budget* Interstate Pavement Non-Interstate NHS Pavement Non-Interstate SHS Pavement Non-Interstate RHS Pavement Bridge Preservation (On System) NHS Bridge Preservation (On System) SHS & RHS Bridge Preservation (Off System) * Does Not Include Preconstruction and (CE&I) Construction, Engineering, Inspection Totals 7-7
128 7.7 ASSET VALUATION GASB 34 For financial reporting, LADOTD calculates asset value based on the standard depreciation approach described in GASB Statement 34. This calculation is performed at an aggregate level using historic cost data and assuming straight-line depreciation. The GASB 34 calculation, though performed in a manner consistent with financial reporting requirements, is of limited value in asset management. NCHRP Report 608 published in 2008 reviews transportation agency experience implementing GASB Statement 34 and concludes that absent significant changes to the calculation approach, asset valuation results developed based on the GASB 34 standard approach are unlikely to play substantial role in asset management and decision making. The report identifies a number of reasons for this conclusion. Ongoing research on asset valuation currently underway through NCHRP Project on financial planning for asset management further supports this conclusion. Asset Valuation Method While a number of options can be used to determine asset valuation, LADOTD has decided to use the asset replacement cost to identify the value of the TAMP NHS assets. Pavement Asset Valuation Interstate Pavement Replacement Costs. The PMS replacement treatments, or work types, for Interstate pavements are a structural overlay on Asphalt pavements, a structural treatment on Composite pavements, a reconstruction for both curb and non-curb on Continuously Reinforced pavements and a reconstruction for both curb and non-curb on Jointed Concrete pavements. The cost of these treatments, or work types, used by the PMS are identified in the Pavement Treatments (Work Types) section of Chapter 5. There are different costs associated with curb and non-curb projects, so these values are averaged to determine the value to use in this calculation. An average cost per lane mile is identified for each treatment and then multiplied by the total number of lane miles for that pavement type. Table 7.3 below identifies the valuation for each Interstate pavement type along with a total Interstate pavement valuation of $1.53 billion dollars. 7-8
129 Table 7.3 Interstate Asset Valuation Pavement Type Replacement Cost Asphaltic Concrete Pavement $281,730,150 Composite Pavement $172,166,640 Continuously Reinforced Concrete Pavement $69,491,203 Jointed Concrete Pavement $1,008,275,106 Total Replacement Costs $1,531,663,099 Current Interstate Funding. LADOTD s current Interstate funding projection is $33 million increased at 2% per year for 10 years, noting that this is the actual available total after Preconstruction and (CE&I) Construction, Engineering, Inspection totals are removed. This Interstate pavement projected budget will maintain these pavement assets at a steady state condition or a state of good repair for the 10-year analysis period. Non-Interstate NHS Pavement Replacement Costs. The PMS replacement treatments, or work types, for Non-Interstate NHS pavements are a structural overlay on Asphalt pavements, a rubblize and overlay treatment on Composite pavements, a reconstruction for both curb and non-curb on Continuously Reinforced pavements and a rubblize and overlay on Jointed Concrete pavements. The cost of these treatments, or work types, used by the PMS are identified in the Pavement Treatments (Work Types) section of Chapter 5. There are different costs associated with curb and non-curb projects, so these values are averaged to determine the value to use in this calculation. An average cost per lane mile is identified for each treatment and then multiplied by the total number of lane miles for that pavement type. Table 7.4 below identifies the valuation for each Non-Interstate NHS pavement type along with a total Non-Interstate NHS pavement valuation of $1.21 billion dollars. Table 7.4 Non-Interstate NHS Asset Valuation Pavement Type Replacement Cost Asphaltic Concrete Pavement $399,463,655 Composite Pavement $454,708,020 Continuously Reinforced Concrete Pavement $32,341,062 Jointed Concrete Pavement $322,109,615 Total Replacement Costs $1,208,622,352 Current Non-Interstate NHS Funding. LADOTD s current Non-Interstate NHS funding projection is $83 million increased at 2% per year for 10 years, noting that this is the actual available total after Preconstruction and (CE&I) Construction, Engineering, Inspection totals are removed. This Non-Interstate NHS pavement projected budget will maintain these 7-9
130 pavement assets at a steady state condition or a state of good repair for the 10-year analysis period. Bridge Asset Valuation As noted above, LADOTD has decided to use the asset replacement cost to identify the value of the TAMP assets. Historically, as noted in chapter 5, bridges were designed in a one-off manner, with a limited number of bridges using the same design. As a result, LADOTD has a total of sixtyfour (64) different types of bridges on the state-maintained system. Currently, LADOTD considers seven (7) different generalized bridge types when replacing these bridges, with 95% of replacements being prestressed concrete girders or slab span bridges. Bridge Replacement Costs. LADOTD maintains the replacement type and replacement cost in the BMS for each existing bridge on the state-maintained system. Table 7.5 below summarizes the seven (7) replacement types and the asset valuation for those bridges that they would replace. The total replacement cost for NHS bridges would be $26 billion dollars, clearly identifying that bridge assets comprise the most expensive asset maintained by LADOTD. Table 7.5 NHS Bridge Asset Valuation Bridge Replacement Type Replacement Cost Large Plate Girders $246,503,922 Movable $621,748,378 Plate Girders $6,862,007,899 Prestressed Concrete Girders $14,111,349,414 Heat-Curved Rolled Beams $113,211,167 Slab Span $189,637,645 Cable Stayed $3,874,827,964 Total Replacement Costs $26,019,286,389 Current NHS Bridge Funding. LADOTD s current NHS bridge funding projection is 101 million increased at 2% per year, noting that this is the actual available total after Preconstruction and (CE&I) Construction, Engineering, Inspection totals are removed. A 20-year analysis is performed due to the slow deterioration of bridges. This projected budget allocation was the results of numerous budget runs, using different funding ranges, which is a significant benefit of a fully functional BMS. This NHS bridge projected budget will maintain these bridge assets at a steady state condition or a state of good repair for the 20-year analysis period. 7-10
131 8.0 Investment Strategies 8.1 INTRODUCTION The purpose of investment strategies is to identify the best means possible to achieve progress towards the preservation of assets and their conditions. Investment strategies begin with a thorough understanding of projected funding and with estimates of the preservation and renewal activities that can be accomplish within funding constraints. The development of various investment strategies for an organization is an iterative process that is best served using the predictive capabilities of the pavement and bridge management systems. The outcome of investment strategies will lead to identifying if performance targets will be met. Comprehensive investment strategies are directly influenced by life cycle planning, gap analysis and risk analysis. The strategies also consider changes in factors such as growth trends, technology, design and construction. This chapter focuses on the various investments strategies employed by LADOTD at this time. Investment Strategy Requirements Federal Requirement. 23 CFR 515.7(e) A State DOT shall establish a process for developing investment strategies meeting the requirements in 23 CFR 515.9(f). This process must result in a description of how the investment strategies are influenced, at a minimum, by the following: (1) Performance gap analysis required under 23 CFR (a); (2) Life-cycle planning for asset classes or asset sub-groups resulting from the process required under 23 CFR (b); (3) Risk management analysis resulting from the process required under 23 CFR (c); and (4) Anticipated available funding and estimated cost of expected future work types associated with various candidate strategies based on the financial plan required by 23 CFR 515.7(d). Per 23 CFR 515.9(f), an asset management plan shall discuss how the plan's investment strategies collectively would make or support progress toward: (1) Achieving and sustaining a desired state of good repair over the life cycle of the assets, 8-1
132 (2) Improving or preserving the condition of the assets and the performance of the NHS relating to physical assets, (3) Achieving the State DOT targets for asset condition and performance of the NHS in accordance with 23 U.S.C. 150(d), and (4) Achieving the national goals identified in 23 U.S.C. 150(b). 8.2 OVERALL INVESTMENT STRATEGIES Funding Strategies In Louisiana, the Annual Highway Budget Partitions provides the projected funding for the investment strategies that serve as the link to the agency s tactical plans that are represented in the Annual Highway Priority Program. The Planning Division projects highway budget partitions out for ten years. LADOTD incorporates several overall strategies into its process when allocation funding for pavements and bridges including: Preservation funding will be the primary funding focus for various Assets classes with the focus on eliminating the worst first strategy. Interstate and Non-Interstate NHS pavement have their own funding categories to better manage these Asset Classes. Capacity funding will be relegated to non-traditional means such as Grant Anticipation Revenue Vehicles (GARVEE) bonds, State General Obligation bonds, State General Fund Surplus, federal INFRA grants, federal BUILD Transportation grants, and specifically where new lanes are needed to maintain traffic while the existing asset is reconstructed. Maximize the life cycle performance of asset classes, via cross-asset resource allocation analysis, on a priority basis with a goal of achieving the desired state of good repair for asset classes. o Perform iterative PMS and BMS analysis using various budget scenarios on the different asset sub-groups to identify the most compelling funding for each asset class using actual treatments (work types in 23 CFR 515.7(b)). o Select the most opportune cross-asset resource allocation budget for each asset class based on various priorities outlined below. Fund NHS (Interstates, then Non-Interstate NHS), then SHS, then RHS assets Allocate funding to various bridge asset classes in the following order, NHS bridges, SHS bridges, RHS bridges. 8-2
133 Allocate funding to various pavement asset classes in the following order, Interstates, Non-Interstate NHS, SHS and RHS. On all assets, bridges take the priority over pavements for funding when funding constraints are encountered. Provide sufficient funding to NHS assets to remain penalty free with respect to targets for asset condition and performance of the NHS in accordance with 23 U.S.C. 150(d). Identify and address performance gaps due to insufficient funding or other reasons. Project Strategies Non-Interstate NHS pavement projects are now selected in the same manner as Interstate pavement projects. LADOTD implemented Performance Based Practical Design (PBPD), grounded in a performance management framework, to deliver a greater number of projects. PBPD allows a realization of cost savings by exercising engineering judgment to build up improvements from existing conditions to meet both project and system objectives. PBPD doesn t require improvements to meet every single detail in the current design standards but does not eliminate, modify, or compromise existing design standards or regulatory requirements. LADOTD will also work to incorporate comprehensive cross-asset resource allocation strategies that include HSIP Project Selections, Louisiana Freight Mobility Plan projects in all TAM related activities to ensure maximum benefit for project investments. Risk Management Strategies LADOTD has instituted a Risk Management Program that will insure that Risk Assessment will be used throughout the asset management process, when setting the budgets, prioritizing projects and revising asset management guidance. This effort is fully described in Chapter 6. As LADOTD advances its competency in Risk Management, additional policy and procedural changes could be implemented to further embed risk management as a fundamental operational function of LADOTD. Data Improvement Strategies Federal Requirement. 23 CFR 515.7(g) requires the use of the best available data and bridge and pavement management systems to develop the TAMP. LADOTD Strategy. LADOTD understands the value of good data and is continually working to ensure that all TAMP related data is both accurate and timely. Data quality assurance is a never-ending effort that requires diligent focus and perseverance. The FHWA Office of Safety under contract DTFH61-10-D-0002 prepared a Roadway Data Improvement Program (RDIP) report for LADOTD designed to help improve the quality of 8-3
134 their roadway data to better support safety and other engineering initiatives. The RDIP focused on the process and practices used by LADOTD for collecting, managing, and utilizing roadway data. While this investigation was specific to improving safety related data, safety data often overlaps into other areas so the RDIP included a review of transportation asset related data as well. As a result of the RDIP report and the TAMP requirements, LADOTD has made significant TAM data improvements with respect to: Roadway Data Collection implemented latest pavement data collection technology including new 3D data collection in updated data collection contract, adjusted the data collection cycles to the calendar year instead of the fiscal year to aid in meeting NHS pavement data capture deadlines, Data Analysis Tools and Uses currently updating Bridge Management System and investigating commercial Safety Management solutions; new 3D data allowed for further reduction in manual pavement condition data ratings and analysis; identified JCP joints prior to post processed faulting data provided for significant improvements in data accuracy, Data Sharing and Integration implemented GIS based, ESRI s Road and Highways solution to provide easy access to data, while eliminating data silos and redundant data, Data Management and Governance formalized the pavement data Quality Assurance and Quality Control Program. Local NHS Pavement Data Strategy. To ensure data collection on the Local NHS pavements is captured in the same manner as other NHS pavements, LADOTD has agreed to extend the existing pavement data capture effort to include the Local NHS pavement data for the Louisiana MPOs. LADOTD has not previously captured pavement data for the Local NHS routes and will include both the required federal data and the pavement distress data so that data can be included in DOTD s PMS. After (3) three data cycles have been captured LADOTD, will create deterioration curves, which with appropriate funding identified by the Local NHS owners, could then be used to identify future valid performance targets. Future Data Efforts. LADOTD will continue to further these data improvement strategies going forward. This will include ongoing strategic identification; collection sharing/repurposing; coordination; updating knowledge, information, and data needed for policy; and costs, risks, performance, and other forms of analysis that support data resiliency efforts. Policy Strategies The AME, with the assistance of QCIP and the Executive Champion/Committee, will update all appropriate policies and procedures as necessary to ensure that all TAMP related 8-4
135 requirements will be implemented throughout LADOTD. This includes, but is not limited to, setting of investment strategies and budgets, LCP based prioritization and selection of projects and implementation of risk management. A list of policies will be developed and reviewed for TAMP compliance by the 4 th quarter Then the TAMP compliance review process will be accomplished within 6 months of the TAMP publication. Then the required policy updates will occur over the remaining 3- year time frame, with completion expected to occur prior to the required 4-year TAMP update. 8.3 INVESTMENT STRATEGY DEVELOPMENT PROCESS Annually, LADOTD s Secretary and the Executive Committee meet to review the investment strategies that have been and will be used to update the annual budget partitions that are projected for the next ten years. The process includes a review of the following information: Past performance of the system Pavement and bridge needs Available funding Policies supporting asset management and a whole life approach Asset inventories Pavement and bridge scenario forecasts Level of service targets Using this information and considering the recommendations of the Asset Management Engineer and the TAM Steering Committee, the Secretary and the Executive Committee will consider whether or not to adjust the investment strategies. The final set of investment strategies are communicated to LADOTD s personnel via the Annual Highway Budget Partitions and the project selections within the Annual Highway Priority Program. 8-5
136
137 9.0 Asset Management Enhancements Asset management is never complete so the TAMP is essentially an ongoing Asset Management Process improvement program. As such LADOTD will endeavor to make continual improvements in all areas that the TAMP touches to further enhance asset management. The initial Pilot TAMP of 2015 identified a number of potential enhancements to LADOTD tools and business processes that could substantially improve the effectiveness of the asset management process. Many of these tools and business processes were modified or implemented since then and the steps taken to make those changes have yielded clear benefits over the ensuing years. The investment strategies in chapter 8 are essentially a summary of many of the asset management enhancements that are a direct result of this continuous asset management improvement process. With the exception of a few data improvement strategies, which were already underway, every other investment strategy identified is a direct result of the TAMP related asset management improvement process. The ongoing effort to make continuous improvements in asset management related endeavors is enhances by a directional road map, pun intended, going forward. The following sections provide for some of that direction. 9.1 ASSET MANAGEMENT ORGANIZATIONAL ENHANCEMENTS TAMP Maturity Analysis Initial Maturity Analysis. As part of the pilot TAMP effort, LADOTD conducted a Transportation Asset Management Self-Assessment Survey using the approach outlined in the Transportation Asset Management Guide (NCHRP Project 20-24(11)). The survey was designed to answer four primary questions. How does policy guidance benefit from improved asset management practices? Do resource allocation decisions reflect good practices in asset management? Are appropriate program delivery processes that reflect industry good practices, being implemented? Do information resources effectively support asset management policies and decisions? In summary, 55 questions were scored by staff and management across the agency with answers based on Strongly Disagree, Disagree, Agree, and Strongly Agree. The results are 9-1
138 summarized below with the percent showing the average combined score of Agree and Strongly Agree. 11 Policy Guidance questions 80.0% average (agree & strongly agree) 13 Resource Allocation Decision questions 82.1% average (agree & strongly agree) 11 Program Delivery questions 84.0% average (agree & strongly agree) 20 Information Resource questions 80.1% average (agree & strongly agree) The survey results very clearly reflect the outcome one would expect from an agency that long ago established a cultural philosophy that focuses on a policy and procedural driven transportation asset management (TAM) approach based on appropriate data. While there may have been some confusion with regard to the actual status of TAM, there was no confusion that efforts to continue to enhance and improve the concepts outlined were accepted and expected by the respondents. Maturity Analysis Update. Since the initial survey, efforts by AASHTO have provide a more comprehensive and detailed self-assessment analysis process and NCHRP research project 08-90A Phase 1 has developed a TAMP Maturity GAP analysis spreadsheet tool to aid in the performance of this analysis. The tool breaks down the analysis into six major areas each with a number of elements and criteria supporting the analysis effort. Policy Guidance Planning and Programming Program Delivery Information and Analysis Life-Cycle Management and TAM Legislative Compliance Future TAM Maturity Analysis. Going forward, LADOTD will once again conduct a Maturity Analysis to both assess the knowledge of the current staff, many have retired since the initial survey, and to identify gaps that could lead to improvements in every phase of asset management. The TAMP Maturity GAP analysis process will then be used to create the step by step methodology to expand and enhance LADOTD s TAMP maturity level. It will essentially form the basis of the TAMP Improvement Plan. The maturity GAP analysis cycle will be repeated necessary with the intention of performing the analysis every three to five years just prior to the strategic planning effort. 9-2
139 9.2 ADDITIONAL PLANNED ENHANCEMENTS In addition to the investment strategies outlined in chapter 8, this section summarizes LADOTD s plans for future improvements related to the asset management program and the TAMP. Cross-Asset Resource Allocation Analysis LADOTD s long term asset management goal is to accomplish comprehensive cross-asset resource allocation between pavements, bridge, maintenance, safety and freight requirements. The intent of cross-asset resource allocation analysis is to allow maximum benefit to be gained, at the most appropriate spending levels, across various asset types, while incorporating various requirements including life cycle planning and risk management. LADOTD actually performed a cross-asset resource allocation analysis, based on investment strategies, in developing the funding allocations to support the state of good repair, or steady state funding for Interstate pavements, Non-Interstate NHS pavements and NHS bridges outlined in this TAMP. The 2015 NCHRP Report 806, Guide to Cross-Asset Resource Allocation and the Impact on Transportation System Performance provides the most comprehensive summary of requirements and opportunities to accomplish this cross-asset resource allocation analysis goal. Going forward, LADOTD will endeavor to implement the detailed concepts outlined in NCHRP Report 806. This will not be a trivial effort and will require enhancements and improvements to both data and management systems. Bridge Management System Update As identified throughout this TAMP, LADOTD is currently migrating away from the older AASHTO PONTIS BMS solution and is currently implementing the AASHTOWare Bridge Management software (BrM). BrM is designed to consider not only life cycle cost, but also mobility, safety, risk and other performance concerns. This dovetails with the Since a BMS update is necessary, LADOTD has decided to take this opportunity to evaluate the best of breed 3rd party BMS solutions on the market as well. LADOTD will investigate the solutions provided by Deighton and AgileAssets to identify the most appropriate BMS solution going forward. Maintenance Management System Update LADOTD has implemented a set of level of service and performance indexes within its Maintenance Management System, AgileAssets as noted in chapter 2.3, TAM Tools. This effort introduced performance measures with the intent to improve field staff performance. It also provides more detailed information, as noted in chapter 5 Consequences of Delayed Preservation on Maintenance Costs for LCP efforts. 9-3
140 The next step will be to determine how to incorporate the relevant TAM related maintenance activities that support pavement and bridge preservation into the overall cross-asset resource allocation strategies. All of these efforts will inevitably help to maintain the condition of LADOTD assets in a state of good repair Additional Asset Classes LADOTD s AME will coordinate the investigation into which asset classes will be added to the future TAMP. The non-nhs pavements and bridges will be considered along with culverts, signals, intelligent transportation system equipment, sign trusses, guard rails, cable barriers, crash attenuators, sound walls, shoulders, high mast lighting, dams and signs. Asset Data Collection and Inspection Enhancements LADOTD will continue to investigate state of the art, emerging field data collection solutions in an effort to significantly expand and improve, in a cost effective manner, the asset inventory data collection and associated inspection capabilities. The goal will always be to significantly increase the available capabilities for inventory and inspection without requiring extensive technical skills of available staff. For instance, existing field crews could be trained to inspect culverts, embankments, slopes, and retaining walls, while using technology tools that facility condition data capture useful to the asset management process. This same approach can be applied to other assets such as guide rails, attenuators, etc. This could include using drone technology to enhance the safety of bridge inspectors performing the mandated bridge inspections. LADOTD intends to leverage all available technology going forward to improve the asset management process. Expand Risk Assessment of Structures LADOTD has identified the most critical at-risk bridge structures and developed a short document outlining the approach that was used in the process. As part of the Risk Management program, LADOTD intends to review this analysis procedure, and to formally incorporate the three R s, Redundancy, Robustness and Resiliency into the risk analysis process for these bridges going forward. Policy and Procedural Support As noted in Policy Strategies in chapter 8, the AME, with the assistance of QCIP and the Executive Champion/Committee, will update all appropriate policies and procedures as necessary to ensure that all TAMP related requirements will be implemented throughout LADOTD. This will be an ongoing effort to ensure that asset management efforts are fully supported throughout LADOTD 9-4
141 Communication Plan LADOTD will further enhance its existing communication strategy by making the best use of the data and analysis results to communicate the implications of asset management decisions to stakeholders and the public. In particular, these asset management capabilities should enable Department officials to be more proactive in working with the State Legislature and other external stakeholders to optimize funding and foster a clear understanding of the linkage between funding and performance. An Executive Summary TAMP document will be developed upon completion of the FHWA review and acceptance of this TAMP. This document will focus on the most important concepts for the state legislature and the general public and will make use of as many graphical tools as possible to convey these concepts. The LADOTD Communications Director and his staff will provide significant assistance in developing both this plan and the Executive Summary. 9.3 TAMP UPDATE PROCESS Transportation asset management, and the processes, procedures and details outlined in the TAMP, clearly show that a sustained and ongoing effort will be required by LADOTD. The maturity GAP analysis cycle will be repeated necessary with the intention of performing the analysis every three to five years just prior to the strategic planning effort. With this in mind, LADOTD intends to update the TAMP in conjunction with the strategic planning effort, or no less than the mandated 4 year update requirement. This planned schedule will certainly be modified if appropriate reasons to do so become evident. The update cycles will be concurrent with the work outlined in the TAMP, meaning that the actual work of TAM will continue non-stop for the foreseeable future, with the TAMP providing the roadmap to success. 9-5
142
143 10.0 Appendices 10-1
144
145 10.1 TERMS & DEFINITIONS AME Asset Management Engineer; LADOTD s full time staff person primarily responsible for implementing, maintaining and updating the TAMP ARRA - American Recovery and Reinvestment Act of 2009 funding; one-time federal stimulus funding BMS - Bridge Management System COOP - Continuity of Operations Plan, ensures that LADOTD's essential functions can still be performed after a disaster DQM - Data Quality Management DSGR - Desired State of Good Repair, a new federal designation of asset condition FAST ACT - Fixing America s Surface Transportation; the federal law issued in 2015 FHWA Federal Highway Administration GARVEE - Grant Anticipation Revenue Vehicles bonds HPP - Annual Highway Priority Program, identifies projects that are scheduled for construction letting during the year and projects which are in various stages of planning and preparation HSIP - Highway Safety Improvement Program, a core Federal-aid program with the goal to achieve a significant reduction in traffic fatalities and serious injuries on all public roads HSIP Highway Safety Improvement Program; the federally mandated safety program LADOTD the Louisiana Department of Transportation and Development LCCA - Life Cycle Cost Analysis, performed on individual projects LCP - Life Cycle Planning, the general concepts of LCCA performed on a system basis MAP-21 - Moving Ahead for Progress in the 21st Century Act; the federal law issued in 2012 MMS - Maintenance Management System MPO Metropolitan Planning Organization; a federally mandated and federally funded transportation policy-making organization in the United States that is made up of representatives from local government and governmental transportation authorities NBI - National Bridge Inventory federal bridge inspection and data reporting requirements NHPP National Highway Performance Program; a FHWA funding category 1
146 NHS - National Highway System; created by the ISTEA legislation, encompasses both the Interstate and Non-Interstate System sometimes referred to as National Highways of Significance which are both federal aid eligible. PMS - Pavement Management System QCIP - Quality and Continuous Improvement Program STIP - Statewide Transportation Improvement Plan, provide a fiscally sound, capital improvement plan for the state s surface transportation program STP - Statewide Transportation Plan, documents a long-range multimodal transportation strategy to meet the goals and objectives for the State s transportation and infrastructure system TAM Transportation Asset Management TAMP 2018 Federal NHS Transportation Asset Management Plan; a NHS highway and bridge asset management plan mandated by the MAP-21 legislation TIMED - Transportation Infrastructure Model for Economic Development; this is a constitutionally dedicated, voter approved, 1989 (TTF) Transportation Trust Fund created from the collection of a 4 cent per gallon motor fuel excise tax. TTF - Transportation Trust Fund VMT - Vehicle Miles of Travel 2
147 10.2 LADOTD REVENUE AND BUDGET ALLOCATION DESCRIPTIONS The TTF distribution table that follows in the Appendix, LADOTD Transportation Trust Fund Distribution identifies the financial plan for State revenue. The table includes the projection of the revenues as well as the budgeted expenditures. The TTF distribution table includes the past two completed years, the current year, and the requested budget for three future years. A description of the contents of the TTF Distribution line items is as follows: Revenue State Transportation Trust Fund (TTF) - This includes the 16 cent per gallon motor fuel excise tax. The State constitutionally permitted uses of TTF include: the construction and maintenance of the state owned highways; the Port Priority Program; the Flood Control Program; the Parish Transportation Fund; transit; and State police for traffic control. The amount used for programs other than the construction and maintenance of the state highway system cannot exceed 20%. Transportation Infrastructure Model for Economic Development (TIMED) TTF - This includes the collections from the 4 cent per gallon motor fuel excise tax. This revenue stream is now dedicated to debt service for the 16 projects listed in the constitution. Vehicle License Tax This is generated from vehicle registration fees. Aviation Fuels This is a sales tax on these fuels Interest, Fees and Fines This includes toll revenue from Statewide ferries, oversized/overweight truck permits, overweight truck fines, outdoor advertising/junk yard sign permits, and right of way permits. Transfer from DS1 bonds paid off by CCCD state highway fund # 2 State Highway Improvement Fund (SHIF): This includes the registration fees collected on trucks and trailers that operate in the State. The revenue can only be used for projects on the State-owned system that are not eligible for federal funds. Undesignated Fund Balance from prior years: These are obligated funds for multiyear projects that are carried over into the next fiscal budget from a prior year. Interagency Transfers from Office Motor Vehicles: This was previously known as the Debt Recovery Fund. Expenditures Regular Operating State funding allocated to the operating budget 3
148 Aviation Operating State aviation tax revenue allocated to the aviation operating budget Highway Program Matching funds current year match required for current year FHWA funding Highway Program Matching funds out year match required for designated FHWA funding on multi-year projects Highway Program State funded and other State funding on projects not funded with FHWA funds Take up projects funds available for miscellaneous close-out items. Retainer Contracts funds for contracts that span many projects and are Statewide in nature Hot Mix, Pipe, Bridge Materials funds for materials used in capital projects handled by district personnel Secretary Emergency Fund funds for emergency projects such as critical movable bridge mechanism failure, culvert failure, etc. Transportation Infrastructure Model for Economic Development (TIMED) Program - $0.04 tax Debt service on TIMED program bonds paid from $0.04 tax TIMED Debt Service paid from $0.016 cent tax debt service on TIMED program bonds paid from $0.16 tax Non-Fed Eligible (NFA) Roads funding from the State Highway Improvement Fund (SHIF) (registration fees on trucks and trailers) on assets that cannot receive federal funding Off System Bridges funding for state bridges that are maintained by various local authorities Flood Control Program funding for the Flood Control Program. Port Priority Program funding for the Port Priority Program Airport Priority Program Aviation fuel sales tax funding for the Aviation Priority Program Facilities Major Repair funding for major repairs to LADOTD buildings, pump stations, etc. Ferry Repairs funding for capital repairs to ferries Deficit Reduction this was a mid-year budget cut exercised to help balance the state budget State Police funding for State Police for traffic control purposes Capital Outlay Parish Transportation funding for the Parish Transportation Fund (parish road fund, transit fund and off-system bridges match program) 4

149 10.3 LADOTD TRANSPORTATION TRUST FUND DISTRIBUTION 5
150 10.4 LADOTD PAVEMENT SYSTEM TREATMENTS Summary of Treatments (Work Types) The table below shows the summary of PMS treatments (work types) by pavement type. Flexible Pavement Treatment 2 Lane Total Cost Extra Lane - Cost / Lane Microsurfacing $ 74,000 $ 34,000 Thin Overlay - 2 inch $ 195,000 $ 82,000 Thin Overlay $ 242,000 $ 112,000 Medium Overlay inch $ 354,000 $ 150,000 Medium Overlay $ 481,000 $ 183,000 STRUCTURAL OVERLAY - 5.5" $ 911,000 $ 273,000 STRUCTURAL OVERLAY - 7" $ 1,127,000 $ 333,000 In Place Stabilization $ 534,000 $ 201,000 Polymer Surface Treatment $ 74,000 $ 29,000 Composite Pavement Treatment 2 Lane Total Cost Extra Lane - Cost / Lane Microsurfacing $ 74,000 $ 34,000 Thin Overlay $ 223,000 $ 103,000 Medium Overlay $ 480,000 $ 183,000 Structural Overlay - Curb & Gutter $ 346,000 $ 159,000 Structural Overlay - Rural $ 783,000 $ 269,000 Rubbelize and Overlay $ 771,000 $ 163,000 Polymer Surface Treatment $ 74,000 $ 29,000 Jointed Concrete Pavement Treatment 2 Lane Total Cost Extra Lane - Cost / Lane Seal Joints & Cracks $ 23,000 $ 11,000 Minor Rehab $ 106,000 $ 50,000 Major Rehab $ 292,000 $ 139,000 Reconstruction $ 4,712,000 $ 1,101,000 Rubblize & Overlay $ 1,034,000 $ 289,000 Rubblize & Overlay - Rural $ 1,249,000 $ 349,000 Continuous Reinforced Concrete Pavement Treatment 2 Lane Total Cost Extra Lane - Cost / Lane Minor Rehab $ 643,000 $ 206,000 Major Rehab $ 2,249,000 $ 200,000 Reconstruction $ 4,712,000 $ 1,101,000 Additional Explanation of Treatments (Work Types) Including Non- PMS Activities This section is included to provide a more descriptive explanation of the information in the table above. It also provides a few details of maintenance activities provided by district, or contract, staff that are tracked by the Maintenance Management System (MMS). 6
151 Emergency Repair This describes work activities generally necessary to return a pavement back to a minimum level of service following a significant event. These could be performed by department or contract forces. Examples could include: Concrete Blowups Road Washouts Corrective Maintenance This is maintenance performed once a deficiency occurs in the pavement. These are typically performed by Department forces. Examples could include: Pothole Filling Spall Repair Pavement Preservation This is a defined program employing a network level, long-term life cycle cost strategy that enhances pavement performance by using an integrated, cost-effective set of practices that extend pavement life and improve pavement surface conditions. Pavement Preservation activities would not be classified as structural enhancements. Routine Maintenance This is defined as repair work typically performed by Department forces that is planned and carried out on a scheduled basis to maintain the pavement in serviceable condition. Examples could include: Spot Leveling Pothole Patching Bump Grinding Machine Leveling Preventive Maintenance This maintenance is a planned strategy of cost-effective, non-structural treatments to existing pavements that preserve the current condition and retard future deteriorations. These could be performed by department or contract forces. Examples could include: Micro-Surfacing includes Single or Multiple Course Micro Surfacing, Thin Asphaltic Concrete (<1.5 ), or an Open Grade Friction Course 7
152 Polymer Surface Treatment includes Single or Multiple Lift Chip Seal, Slurry Seal, Cape Seal, Fog Seal, or Ultrathin Hot Mix Asphaltic Concrete Wearing Course (e.g. NovaChip ) Joint Resealing Crack Sealing Ultra-Thin Overlay (<1.5 ) Thin Overlays (>1.5 and <2 ) Light Minor Rehabilitation This consists of non-structural improvements or repairs made to existing pavement sections to address pavement distresses. These could be performed by department or contract forces. Examples could include: PCC Pavement Patching Asphaltic Pavement Patching Asphaltic Concrete Single Lift Overlays (<2 ) Pavement Grooving/Grinding Load Transfer Restoration Minor Rehabilitation This consist of single lift Overlays (<2 ), with cold planed and/or patching pavement preparation, and are not qualified as structural overlays. These are typically performed by contract forces. Examples could include: Patching with Single Lift Overlay (<2 ) Cold Plane with Single Lift Overlay (<2 ) Major Rehabilitation This consists of structural enhancements that improve the load carrying capacity and extend the service life of the existing pavement. These pavements would generally be designed for a minimum of years design life within the existing crown. These are typically performed by contract forces. Examples could include: Rubbilization & Overlay Bonded Concrete Overlay Whitetopping 8
153 Single or Multi Lift Asphaltic Concrete Overlay includes Medium Overlays (>2 to 4 ) or Structural Overlays (>4 ) In-Place Recycling In Place Stabilization - Base Rehabilitation (stabilized or treated) and Overlay (>2 ) Geometric Changes to Alignment Addition and/or Lengthening of Turn Lanes and Ramps Replacement This is the replacement of the entire existing pavement structure by the placement of an equivalent or increased pavement structure generally within the existing crown. These pavements would typically be designed for a 20-year life. These are typically performed by contract forces. Examples could include: Concrete Pavement Reconstruction Full Depth Asphaltic Concrete Pavement 9


154 10.5 LADOTD 10 YEAR PAVEMENT & BRIDGE PROJECTED BUDGET 10
155 10.6 LADOTD STATE FY BUDGET PARTITION 11
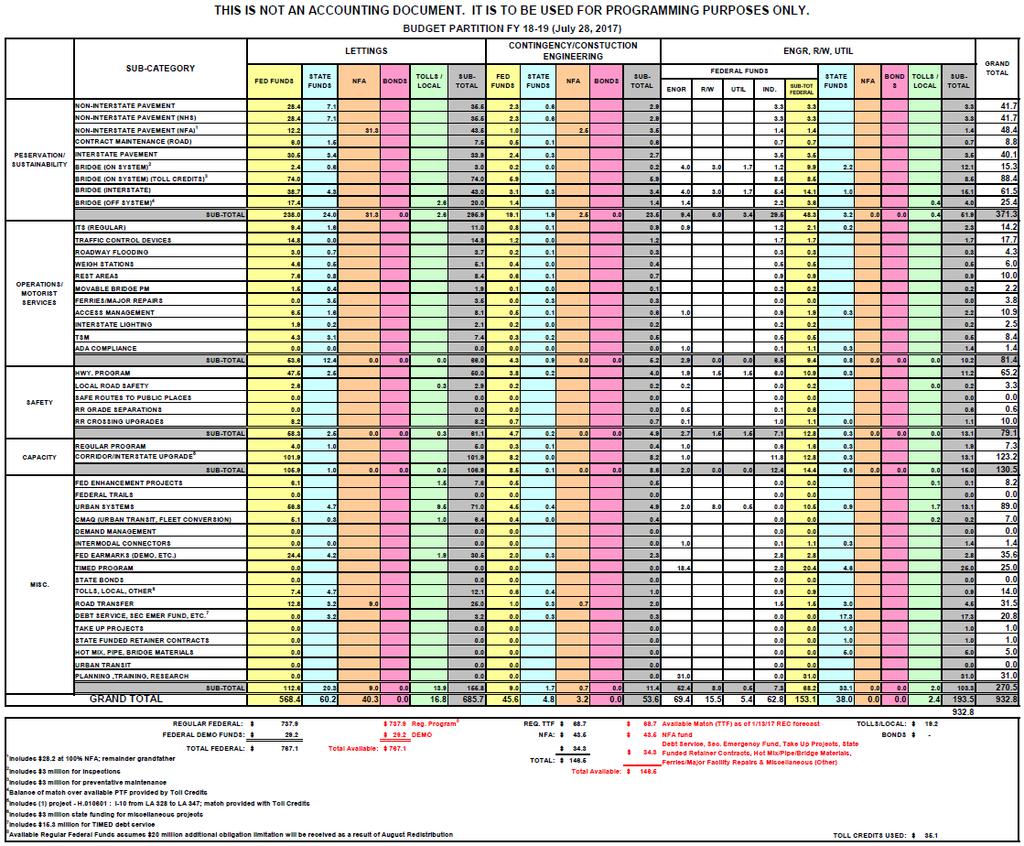
156 12