OPSM 901: Operations Management
|
|
|
- Claud Chandler
- 5 years ago
- Views:
Transcription
1 Koç University Graduate School of Business EMBA Program OPSM 901: Operations Management Session 2: Process flows Process analysis Zeynep Akşin Individual assignment: due next week Problems 2.5, 2.10,3.6,and 4.3 (a,b,f,g only) from the book Use * and ** questions with solutions from the textbook as study questions 1
2 Organization Chart Process View customer customer suppliers 2
 ( 15 M Domestic + 30 M International) 21 st busiest airport")


 On average, how much time does a typical flow unit spend within")

3 Process Flows İstanbul Atatürk Airport total passenger traffic of 45 millions (2012) ( 15 M Domestic + 30 M International) 21 st busiest airport in the world in total passenger traffic 13 th busiest in the world in terms of international passenger traffic How do you improve customer service? reduce the time customers spend in the airport security checkpoints 5 Process Flow Measures Process flow measures internal process performance measures that capture the essence of process flows (flow time, flow rate, inventory) On average, how much time does a typical flow unit spend within process boundaries? On average, how many flow units pass through the process per unit time? On average, how many flow units are within process boundaries at any point in time? 6 3
4 Flow Time (T) Flow time (throughput time, cycle time) average time spent by a flow unit within process boundaries Some flow units move through the process without any wait Others may wait long time in the process 7 Flow Rate (R) Flow rate (throughput) average number of flow units that t flow through h a specific point tin the process per unit of time 8 4

, horizontal")
5 Inventory (I) Inventory average number of flow units present within process boundaries 9 Slope (R), verical distance (I), horizontal distance(t) 5
6 Little s Law Flow Rate Inventory Flow Time John Little Professor of Marketing MIT Inventory I [units] Flow Rate R [units/hr] Flow Time T [hrs] 11 An Intuitive Argument for Little's Law Consider a process with the FCFS process Time = 0 flow unit enters the process Time = T flow unit leaves the process Any old ( ) items left in the process? How many new ( ) items entered the process? 12 6
7 An Intuitive Argument for Little's Law Consider a process with the FCFS queue discipline An order departs the process: At this moment there are I (Inventory) orders within the process The orders that are in the process now are the ones that came after our departing order had arrived, in other words, they arrived during the waiting period of the departing order Since order arrival rate is equal to the flow rate, we have the following relationship: 13 Little s Law Basics Little s Law is for a stable system input rate = output rate Applies to all systems, even those with variability Applies to systems within systems Uses average values Valid as long as: T, I and R are long term averages for a stable system All units are consistent 14 7
8 Example: flow unit is material Fast food restaurant processes an average of 5000kgs, of hamburgersper week. Typical inventory of raw meatin cold storage is 2500kg. Throughput R=5000kg/week Average Inventory I=2500 kg. Average flow time T=I/R=2500/5000=0.5 weeks Example: flow unit is customers A café in Beyoglu serves on average 60 customers per night. A typical night is about 10 hours. At any point there are on average 18 customers in the café. Throughput R=60 customers/night; 6 customers/hour Average Inventory I=18 customers Average flow time T= I/R= 3 hours 8
9 Example: flow unit is cash A steel company processes $400 million of iron ore per year. The cost of processing is $200 millionper year. The average inventory is $100 million. How long does a typical dollar spend in the process? R=$600 million/year I=$100 million T=I/R=1/6 / year or 2 months Inventory Turns (Turnover Ratio) Turnover ratio shows how many times the inventory is sold and replaced during a specific period. Accounting: cost of goods sold / average inventory R Inventory turns I R R T 1 T A company with high inventory turns has small flow times, and thus is quicker at turning its inputs into sold outputs. 18 9
10 Inventory Turns (Turnover Ratio) 19 Inventory Turns (Turnover Ratio) Home Depot (1/30/2011) Wal Mart (1/31/2011) Migros (1/30/2011) Net Sales $67,997 $418,952 $6,365 Cost of Sales $44,693 $315,287 $4,781 Net Income $3,338 $15,355 $42 Inventories $10,625 $36,318 $746 R HD = 44,693 and I HD = 10,625 Turnover Ratio (Home Depot) = 4.2 times/yr R WM = 315,287 and I WM = 36,318 Turnover Ratio (Wal Mart) = 8.7 times/yr R M = 4,718 and I M = 746 Turnover Ratio (Migros) = 6.3 times/yr 20 10
11 Inventory Turns (Turnover Ratio) Home Depot (1/30/2011) Wal Mart (1/31/2011) Migros (1/30/2011) Net Sales $67,997 $418,952 $6,365 Cost of Sales $44,693 $315,287 $4,781 Net Income $3,338 $15,355 $42 Inventories $10,625 $36,318 $746 Turnover Ratio What if Migros was as efficient as Wal Mart? 21 Inventory Turns (Turnover Ratio) Home Depot (1/30/2011) Wal Mart (1/31/2011) Migros (1/30/2011) Net Sales $67,997 $418,952 $6,365 Cost of Sales $44,693 $315,287 $4,781 Net Income $ 3,338 $15,355 $42 Inventories $10,625 $36,318 $746 Turnover Ratio Turnover Ratio of 8.7 times/year is equivalent to carrying 1.38 months worth of inventory 22 11
12 Inventory Turns (Turnover Ratio) Home Depot (1/30/2011) Wal Mart (1/31/2011) Migros (1/30/2011) Net Sales $67,997 $418,952 $6,365 Cost of Sales $44,693 $315,287 $4,781 Net Income $3,338 $15,355 $42 Inventories $10,625 $36,318 $746 Turnover Ratio Migros 1.38 months worth of inventory = ,781/12 = $550 Migros would save $746 $550 = $196 million! 23 Little s law: It s more powerful than you think... What it is: Inventory (I) = Flow Rate (R) * Flow Time (T) How to remember it: units Implications: Out of the three fundamental performance measures (I,R,T), two can be chosen by management, the other is GIVEN by nature Hold throughput constant: Reducing inventory = reducing flow time Examples: Indirect measurement of flow time Throughput: 5000kg/week Throughput: 1500 customers/day Inventory: 2500kg Inventory: 25 customers Inventory turns: compute right from financial data Cost of Goods sold: 20,000 mill $/year Inventory: 391 mill $ Cost of Goods sold: 25,263 mill $/year Inventory: 2,003 mill $ 12
13 Inventory Turns in Retailing and Its Link to Inventory Costs Inventory Turns 10 9 Retailer B Retailer A % 10% 20% 30% 40% 50% Gross Margin (%) Inventory Cost Calculation Compute per unit inventory costs as: Per unit Inventory costs= Example: Annual inventory costs Inventory turns Annual inventory costs=30% Inventory turns=6 30% per year Per unit Inventory costs= 5% 6 turns per year Source: Gaur, Fisher, Raman Example The ER of American Hospital is currently organized so that all patients register through an initial check in process. At his or her turn, each patient is seen by a doctor and then exits the process, either with a prescription or with admission to the hospital. Currently, 55 people per hour arrive at the ER, 10% of whom are admitted to the hospital. On average, 7people are waiting to be registered and 34 are registered and waiting to see a doctor. The registration process takes, on average, 2 minutes per patient. Among patients who receive prescriptions, average time spent with a doctor is 5 minutes. Among those admitted to the hospital, average time is 30 minutes
14 Example Prescription Waiting Room 1 Registration Waiting Room 2 Doctor 55/hr I WR1 =7 T R =2 min I WR2 =34 T pres =5 min T admis = 30 min On average, how long does a patient stay in the ER? Admission to Hospital 27 Example Prescription Waiting Room 1 Registration Waiting Room 2 Doctor 55/hr I WR1 =7 T R =2 min T WR1 = I WR1 /R WR1 = 7/55 = hr = min T WR2 = I WR2 /R WR2 = 34/55 = 0.62 hr = 37.1 min I WR2 =34 T= 0.9 ( ) ( ) = 54.2 min T pres =5 min T admis = 30 min Admission to Hospital 51.7 min 76.7 min 28 14
15 Example Prescription Waiting Room 1 Registration Waiting Room 2 Doctor 55/hr I WR1 =7 T R =2 min I WR2 =34 T pres =5 min T admis = 30 min On average, how many patients are being examined by doctors? Admission to Hospital 29 Example Prescription Waiting Room 1 Registration Waiting Room 2 Doctor 55/hr I WR1 =7 T R =2 min I WR2 =34 T pres =5 min T admis = 30 min I pres = T pres R pres = 5/60 hr 49.5 patients/hr = patients I admis = T admis R admis = 30/60 hr 5.5 patients/hr = 2.75 patients Admission to Hospital I Dr = I pres + I admis = patients 30 15
16 Example Prescription Waiting Room 1 Registration Waiting Room 2 Doctor 55/hr I WR1 =7 T R =2 min I WR2 =34 T pres =5 min T admis = 30 min On average, how many patients are in the ER? Admission to Hospital 31 Example Prescription Waiting Room 1 Registration Waiting Room 2 Doctor 55/hr I WR1 =7 T R =2 min I WR2 =34 T pres =5 min T admis = 30 min I Reg = R Reg T Reg = 55 2/60 = 1.83 patients I= I WR1 + I Reg + I WR2 + I Dr = = patients Admission to Hospital 32 16
17 Smiley Faces Factory... Volunteers? Flow Time (T) Flow time (throughput time, cycle time) average time spent by a flow unit within process boundaries Some flow units move through the process without any wait Others may wait long time in the process 34 17
18 Value of Flow Time Flow time is a valuable measure of process performance: 1. Affectsdelivery response time (a key product attribute) 2. Short flow times Reduced inventory (Little s law) 3. Fast feedback for quality problems 4. Postpone production closer to the time of sale (gain market information) 5. Integrative measure of overall operational excellence 35 Flowchart Process flowchart graphical representation of the network structure of the process. structure of the process. Symbol Meaning Example Tasks and operations Decision points Storage areas and queues Flows of materials and customers Giving an admission ticket to a customer, installing an engine in a car How much change should be given to a customer, which wrench should be used Lines of people or cars waiting for a service, parts waiting for assembly Customers moving to a seat, mechanic getting a tool 36 18
19 Examples Process 1 Process 2 Alternative paths 37 Examples Process 1 Process 2 Process 3 Simultaneous activities 38 19


20 Examples Process 1 Process 2 Different products 39 X Ray Service at Valley of Hope Hospital 1. Patient walks to x ray lab 2. X ray request travels to lab by messenger 3. X ray technician fills out standard form based on info from physician 4. Receptionist receives insurance information, prepares and signs form, sends to insurer 5. Patient undresses in preparation of x ray 6. Lab technician takes x ray 7. Darkroom technician develops x ray 8. Lab technician checks for clarity rework if necessary 9. Patient puts on clothes, gets ready to leave lab 10. Patient walks back to physicians office 11. X rays transferred to physician by messenger 40 20
21 START X Ray Service: explicitly accounting for rework % Patient walks to x ray lab 2. X ray request travels to lab by messenger 3. X ray technician fills out standard form based on info from physician 4. Receptionist receives insurance information, prepares and signs form, sends to insurer 5. Patient undresses in preparation of x ray 6. Lab technician takes x ray 7. Darkroom technician develops x ray 8. Lab technician checks for clarity rework if necessary 9. Patient puts on clothes, gets ready to leave lab 10. Patient walks back to physicians office 11. X rays transferred to physician by messenger END START X Ray Service at Valley of Hope Hospital END 1. Patient walks to x ray lab 2. X ray request travels to lab by messenger 3. X ray technician fills out standard form based on info from physician 4. Receptionist receives insurance information, prepares and signs form, sends to insurer 5. Patient undresses in preparation of x ray 6. Lab technician takes x ray 7. Darkroom technician develops x ray 8. Lab technician checks for clarity rework if necessary 9. Patient puts on clothes, gets ready to leave lab 10. Patient walks back to physicians office 11. X rays transferred to physician by messenger 21
22 START X Ray Service at Valley of Hope Hospital END Path 1: Time = 50 min START X Ray Service at Valley of Hope Hospital END Path 1: Time = 50 min Path 2: Time = 60 min 22
23 START X Ray Service at Valley of Hope Hospital END Path 1: Time = 50 min Path 2: Time = 60 min Path 3: Time = 69 min START X Ray Service at Valley of Hope Hospital END Path 1: Time = 50 min Path 2: Time = 60 min Path 3: Time = 69 min Path 4: Time = 79 min 23
24 START X Ray Service at Valley of Hope Hospital END Critical Path: Time = 79 min Suppose that a random sample of 50 patients are observed over a two week period. The average flow time was recorded as 154 minutes. Flow time efficiency = 79 / 154 = 51% Flow Times in White Collar Processes Industry Process Average Flow Theoretical Flow Time Time Flow Time Efficiency Life Insurance New Policy Application 72 hrs. 7 min. 0.16% Consumer Packaging New Graphic Design 18 days 2 hrs. 0.14% Commercial Bank Consumer Loan 24 hrs. 34 min. 2.36% Hospital Patient Billing 10 days 3 hrs. 3.75% These very low values highlight the importance of reducing waiting times to improve flow time performance
25 Levers for Reducing Flow Time Decrease the work content of critical activities work smarter work faster do it right the first time change product mix Move work content from critical to non critical activities to non critical path or to outer loop Restructure sequential activities into parallel activities Reduce waiting time 49 Resource Pool X Ray: process capacity Res. Unit Load Load Batch Theoretical Capacity of Res. unit No of units in pool Theoretical capacity of pool ( ) Patient/hr Messenger /40= (6)=9 min/patient patients/hr Receptionist /5= X-ray /16= technician X-ray lab (6)= 1 60/7.5= Darkroom (12) 25(12) 1 60/15= technician =15 Darkroom (1 1 60/15= )=15 Changing room /6=
26 Resource pool Utilizations given an observed throughput of 5.5 patients/hr Theoretical capacity Patients/hr Messenger Receptionist X-ray technician X-ray lab Darkroom technician Darkroom Changing room Capacity utilization In class exercise 26
27 Example: Insurance Office Mailroom clerk Data entry clerk Claims processor Claims supervisor 53 Example: Insurance Office Resource Pool (i) Number of Units in the Resource Pool (c i ) Unit Load (minutes per claim) (T i ) Effective Capacity of Resource Unit (claims per minute) (1/T i ) Effective Capacity of Resource Pool (claims per minute) (c i /T i ) Mailroom clerk Data entry clerk Claims processor Claims supervisor
28 Example: Insurance Office Resource Pool (i) Number of Units in the Resource Pool (c i ) Unit Load (minutes per claim) (T i ) Effective Capacity of Resource Unit (claims per minute) (1/T i ) Effective Capacity of Resource Pool (claims per minute) (c i /T i ) Mailroom clerk Data entry clerk Claims processor Claims supervisor Example: Insurance Office Resource Pool (i) Number of Units in the Resource Pool (c i ) Unit Load (minutes per claim) (T i ) Effective Capacity of Resource Unit (claims per minute) (1/T i ) Effective Capacity of Resource Pool (claims per minute) (c i /T i ) Mailroom clerk Data entry clerk Claims processor Claims supervisor
29 Capacity Utilization Suppose 400 claims are processed per day Assume8 hour work day Throughput = 400/day = 50/hour = 0.83/min Mailroom clerk Data entry clerk Claims processor Claims supervisor 57 Capacity Utilization Resource Pool (i) Number of Units in the Resource Pool (c i ) Unit Load (minutes per claim) (T i ) Effective Capacity of Resource Unit (claims per minute) (1/T i ) Effective Capacity of Resource Pool (claims per minute) (c i /T i ) Mailroom clerk Data entry clerk Claims processor Claims supervisor
30 Capacity Utilization Resource Pool (i) Effective Capacity of Resource Pool (claims per minute) (c i /T i ) Capacity Utilization (u i ) Mailroom clerk 1.00 Data entry clerk 1.60 Claims processor 1.50 Claims supervisor Capacity Utilization Resource Pool (i) Effective Capacity of Resource Pool (claims per minute) (c i /T i ) Capacity Utilization (u i ) Mailroom clerk /1.00 = 83% Data entry clerk /1.60 = 52% Claims processor /1.50 = 56% Claims supervisor /2.00 = 42% 60 30
31 Suppose claim demand doubles to 800 claims/day or 1.66 claims/minute Resource Pool (i) Effective Capacity of Resource Pool (claims per minute) (c i /T i ) Capacity Utilization (u i ) Implied Utilization Mailroom clerk /1.00 = 83% 1.66/1.00=166% Data entry clerk /1.60 = 52% 1.66/1.60=103.75% Claims processor /1.50 = 56% 1.66/1.50=110.67% Claims supervisor /2.00 = 42% 1.66/2.00=83% 61 Effect of Product Mix Firms often produce several products simultaneously Various products utilizeresources at different rates Effective capacity depends on the product mix Resource Pool Unit Load (Physician) (minutes per claim) Unit Load (Hospital) (minutes per claim) Mailroom clerk Data entry clerk Claims processor Claims supervisor
32 Effect of Product Mix Resource Pool Unit Load (Physician) i (minutes per claim) Unit Load (Hospital) (minutes per claim) Unit Load (60% 40% mix) (minutes per claim) Mailroom clerk Data entry clerk Claims processor Claims supervisor Effect of Product Mix Resource Pool Unit Load (Physician) i Unit Load (Hospital) (minutes (minutes per claim) per claim) Mailroom clerk Unit Load (60% 40% mix) (minutes per claim) = 1.20 Data entry clerk Claims processor Claims supervisor
 (minutes per claim) 1.00 0.6 + 1.50 0.4 = 1.20 Data entry clerk 5.00 6.00 5.40 Claims processor 8.00 8.00 8.00 Claims supervisor 2.50 4.00 3.")
 (1/T i ) Effective Capacity of Resource Pool (claims per minute) (c i /T i ) Mailroom clerk 1 1.20 0.83 0.83 Data entry clerk 8 5.40 0.185 1.48 Claims processor 12 8.00 0.")
33 Effect of Product Mix Resource Pool Unit Load (Physician) i Unit Load (Hospital) (minutes (minutes per claim) per claim) Mailroom clerk Unit Load (60% 40% mix) (minutes per claim) = 1.20 Data entry clerk Claims processor Claims supervisor Effect of Product Mix Resource Pool (i) Number of Units in the Resource Pool (c i ) Unit Load (minutes per claim) (T i ) Effective Capacity of Resource Unit (claims per minute) (1/T i ) Effective Capacity of Resource Pool (claims per minute) (c i /T i ) Mailroom clerk Data entry clerk Claims processor Claims supervisor
34 Effect of Product Mix Is the product with the highest unit contribution margin the most profitable for a company? Physician Claims Hosptial Claims Effective Capacity (claims per min) Effective Capacity (claims per hour) Contribution Margin ($ per unit) Process physician claims or hospital claims? Physician claims 5 60 = $300/hour Hospital claims 6 40 = $240/hour 67 Example: Fast Service Hair Salon Three hairstylists: François, Bernard and, run Fast Service Hair Salon for busy professionals in downtown Chicago. They stay open from 6:45 a.m. To 9:00 p.m. They perform only shampooing and hairstyling activities. When a customer arrives, she first checks in with the receptionist (Bernard s younger sister Lulu). This takes only 3 minutes. On average, it takes 10 minutes to shampoo, 15 minutes to sytle and 5 minutes to bill the customer
35 Example: Fast Service Hair Salon Reception 3 minutes Lulu Shampoo Styling Billing 10 minutes 15 minutes 5 minutes François, François, François, Bernard or Bernard or Bernard or One of the three stylists tlit tk take charge of a customer and performs all three activities shampooing, styling and billing, consecutively. What is the number of customers that can be serviced per hour? 69 Example: Fast Service Hair Salon Reception 3 minutes Lulu Shampoo Styling Billing 10 minutes 15 minutes 5 minutes François, François, François, Bernard or Bernard or Bernard or Resource Pool (i) Number of Units in the Resource Pool (c i ) Unit Load (hours per customer) (T i ) Effective Capacity of Resource Unit (customers per hour) (1/T i ) Effective Capacity of Resource Pool (customers per hour) (c i /T i ) Hairstylist 3 Receptionist
36 Example: Fast Service Hair Salon Reception 3 minutes Lulu Shampoo Styling Billing 10 minutes 15 minutes 5 minutes François, François, François, Bernard or Bernard or Bernard or Resource Pool (i) Number of Units Unit Load (hours in the Resource per customer) (T Pool (c i ) i ) Hairstylist 3 ( )/60 Receptionist 1 3/60 Effective Capacity of Resource Unit (customers per hour) (1/T i ) Effective Capacity of Resource Pool (customers per hour) (c i /T i ) 71 Example: Fast Service Hair Salon Reception 3 minutes Lulu Shampoo Styling Billing 10 minutes 15 minutes 5 minutes François, François, François, Bernard or Bernard or Bernard or Resource Pool (i) Effective Capacity Number of Units Unit Load (hours of Resource Unit in the Resource per customer) (T Pool (c i ) i ) (customers per hour) (1/T i ) Hairstylist 3 ( )/60 2 Receptionist 1 3/60 20 Effective Capacity of Resource Pool (customers per hour) (c i /T i ) 72 36
37 Example: Fast Service Hair Salon Reception 3 minutes Lulu Shampoo Styling Billing 10 minutes 15 minutes 5 minutes François, François, François, Bernard or Bernard or Bernard or Resource Pool (i) Effective Capacity Effective Capacity Number of Units Unit Load (hours of Resource Unit of Resource Pool in the Resource per customer) (T Pool (c i ) i ) (customers per (customers per hour) (1/T i ) hour) (c i /T i ) Hairstylist 3 ( )/ Receptionist 1 3/ Example: Fast Service Hair Salon Reception 3 minutes Lulu Shampoo Styling Billing 10 minutes 15 minutes 5 minutes François, François, François, Bernard or Bernard or Bernard or Resource Pool (i) Effective Capacity Effective Capacity Number of Units Unit Load (hours of Resource Unit of Resource Pool in the Resource per customer) (T Pool (c i ) i ) (customers per (customers per hour) (1/T i ) hour) (c i /T i ) Hairstylist 3 ( )/ Receptionist 1 3/
38 Example: Fast Service Hair Salon Reception 3 minutes Lulu Shampoo Styling Billing 10 minutes 15 minutes 5 minutes François, François, François, Bernard or Bernard or Bernard or A customer of Fast tservice HiSl Hair Salon, an operations specialist, ilithas suggested td that the billing operation be transferred to Lulu. What is the number of customers that can be serviced per hour? 75 Example: Fast Service Hair Salon Reception 3 minutes Lulu Shampoo 10 minutes François, Bernard or Styling 15 minutes François, Bernard or Billing 5 minutes Lulu A customer of Fast tservice HiSl Hair Salon, an operations specialist, ilithas suggested td that the billing operation be transferred to Lulu. What is the number of customers that can be serviced per hour? 76 38
39 Example: Fast Service Hair Salon Reception 3 minutes Lulu Shampoo 10 minutes François, Bernard or Styling 15 minutes François, Bernard or Billing 5 minutes Lulu Resource Pool (i) Number of Units in the Resource Pool (c i ) Unit Load (hours per customer) (T i ) Effective Capacity of Resource Unit (customers per hour) (1/T i ) Effective Capacity of Resource Pool (customers per hour) (c i /T i ) Hairstylist 3 Receptionist 1 77 Example: Fast Service Hair Salon Reception 3 minutes Lulu Shampoo 10 minutes François, Bernard or Styling 15 minutes François, Bernard or Billing 5 minutes Lulu Resource Pool (i) Effective Capacity Effective Capacity Number of Units Unit Load (hours of Resource Unit of Resource Pool in the Resource per customer) (T Pool (c i ) i ) (customers per (customers per hour) (1/T i ) hour) (c i /T i ) Hairstylist 3 (10+15)/ Receptionist 1 (3+5)/

40 Multi products and product mix The setting: Employment verification agency Working day of 10 hours Demandis 180 applications per day 30 for consulting positions 110 for staff positions 40 for internship positions Activity Times per application (min.) File 3 1 Contact Persons 20 2 Contact employers 15 3 Grade/school 8 2 analysis Confirmation letter 2 1 Workers 40


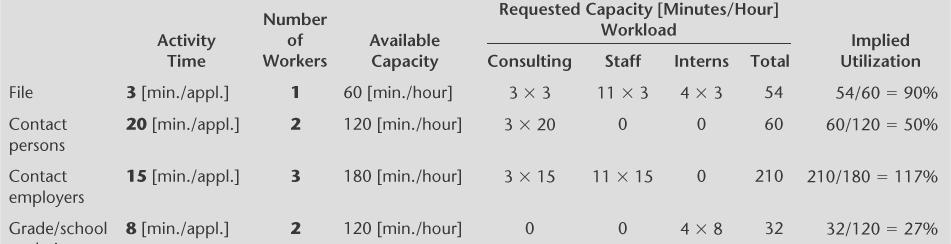
41 Flow unit: one application Flow unit: one minute of work 41
42 Levers for Increasing Process Capacity Decrease the work content of bottleneck activities work smarter work faster do it right the first time change product mix Move work content from bottlenecks to non bottlenecks to non critical resource or to third party Increase Net Availability work longer increase scale (invest) increase size of load batches eliminate availability waste 42