Mexico The next largest U.S. trading partner? Nearsourcing Trends and Logistics in Mexico. TPM Conference Monday March 4, 2013
|
|
|
- Evelyn Thomas
- 5 years ago
- Views:
Transcription

1 Mexico The next largest U.S. trading partner? Nearsourcing Trends and Logistics in Mexico TPM Conference Monday March 4, 2013
2 Mexico Economic Overview Economy, Politics, Business Climate
3 Mexico is a young country in an aging world 60% Proportion of Population Above 55 Years of Age 50% 40% Japan Europe China Canada US 30% Brazil Mexico 20% India 10% 0%
4 Mexico has competitive labor costs $55,000 Manufacturing Wage Comparisons in US$ in 2008 and 2012E $50,000 $45,000 $40,000 $35,000 $30,000 $25,000 $20,000 $15,000 $10,000 $5,000 $0
5 US$ Millions US$ Per Million BTU Mexico benefits from low cost US natural gas 300 US Natural Gas Prices and Trade With Mexico US Exports US Imports Natural Gas Price (right)
6 Mexico benefits from global FX trends Foreign Exchange Trends Peso per Dollar Yuan per Dollar Euro per Dollar
7 Mexico exports to the US have outperformed Asia since 2009 Index of US Imports From Mexico and Asian Trade Lanes (Jan 2009 = 100) Mexico N Asia S Asia
8 Millions of Tons Mexico vehicle exports to the US have outperformed since US Vehicle Imports and Mexico s Share (millions of tons) 25% % % 10% 5% 5 0 0% Mexico % (right axis) Mexico World
9 Mexico s economy has grown faster than the US but not as fast as China s, but 20% Real GDP Growth 15% 10% 5% China Mexico United States 0% -5% -10%
10 investment-driven GDP growth is not as stable as consumer-driven growth 60% Investment Spending Share of GDP 50% 40% China 30% Mexico 20% United States 10% 0%
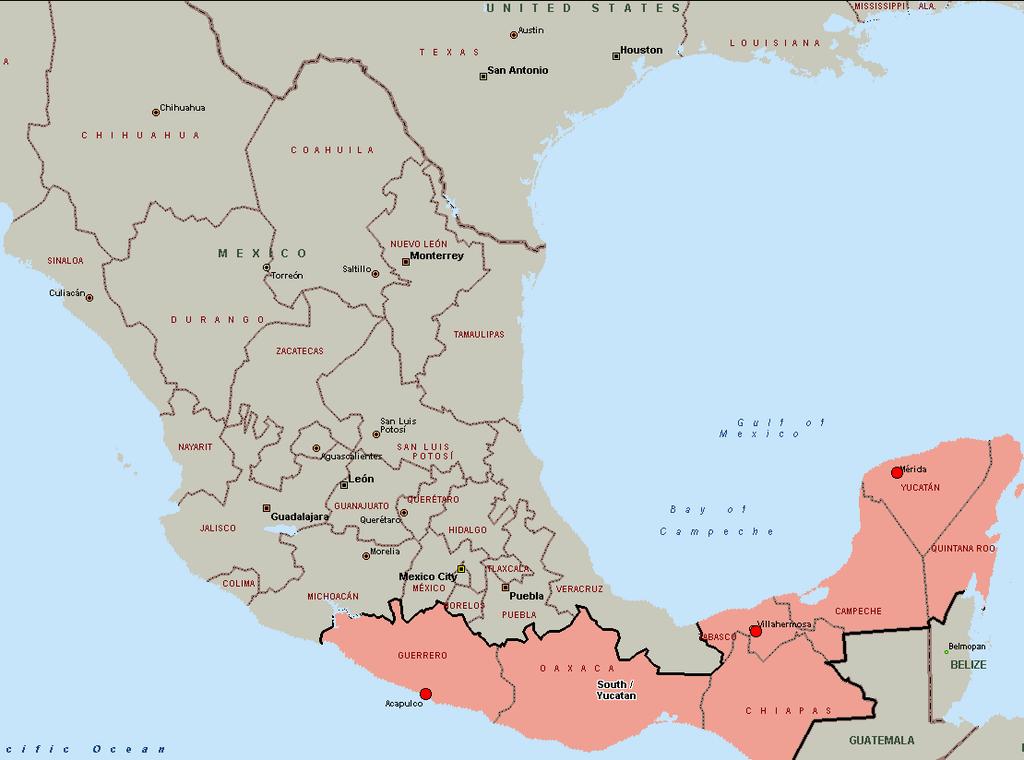
11 Mexico Logistics and Trend Volumes, Infrastructure, Mexico Zones, Supply & Demand, Modes of Transport, Load Sharing, Trends
12 Laredo is largest land based port Rank: Location: Type: Imports: Exports: 1 Port of Los Angeles, CA Water Gateway $202.6 bil $33.7 bil 2 Port of NY/NJ Water Gateway $125.1 bil $46.3 bil 3 JFK Intl Airport Air $77.7 bil $81.9 bil 4 Port of Houston Water Gateway $60.2 bil $70.7 bil 5 Laredo, TX Land $63.7 bil $57.3 bil 6 Detroit Land $48.2 bil $62.8 bil 7 Chicago Airport Air $75.3 bil $35.3 bil 8 Port of Long Beach, CA Water Gateway $56.6 bil $31.8 bil 9 Los Angeles Intl Airport Air $40.5 bil $36.9 bil 10 Port Huron, MI Land $38.7 bil $34.7 bil 11 Buffalo-Niagara Falls, NY Land $35.3 bil $37.4 bil 12 Port of Savannah, GA Water Gateway $34.4 bil $24.2 bil 13 New Orleans Air $35.0 bil $22.7 bil 14 El Paso, TX Land $23.9 bil $31.7 bil 15 Port of Charleston, SC Water Gateway $30.8 bil $19.4 bil By Jessica Naziri Posted 23 April 2012 CNBC.com Sources: Bureau of Transportation s Statistics of the Research and Innovative Technology Administration rankings (2010) and individual gateways (2007, 2010, 2011).
13 Texas Port Crossing North Jan-Nov ,800,000 1,600,000 1,400,000 1,200,000 1,000, , , , , % 2% 1% 1% 1% 0% 0% 6% 14% 51% 21% LAREDO EL PASO PHARR BROWNSVILLE EAGLE PASS DEL RIO PROGRESO RIO GRANDE HARLINGEN Truck Crossings comprise all commercial vehicles crossing through international bridges (2,3,4,5,6+ axle). North Bound Data provided by U.S. Customs Service at Laredo, TX. Texas A&M International University, Texas Center for Border Economic and Enterprise Development PRESIDIO
14 Maquiladora Program Existed Before NAFTA 1965 Over 3,000 Maquiladora Plants in Mexico Companies Import Components Duty Free Process: Assemble, Store, Re-Export Duty Paid on Value Added Only


15 Mexico Highway Investment Infrastructure development Toll roads Interstate highways New routes for produce

16 Laredo s access to Monterrey and Interior/Central Mexico Shortest distance to major cities 70% of Industrial Base Perception of less risk Avoids major mountain ranges
17
18
19
20
21
22

23 Imbalance of Equipment A Severe Issue Q1 Q2 Q3 Q4 Peak Season Weeks of the Year
24 Peak Season Solutions? Projecting Northbound Capacity Severely Restricted Customer Preparation: Critical Carriers Discussions/Planning Before Peak Season Year Around Volume or Premium Freight Advantage Consider Diversified Carrier Base Best Carrier Option - Balanced North and Southbound Consider Different Entry Ports & Modes of Transportation Rail/Intermodal Cross-Docking at Border Dedicated Truck Solutions
25 Diversified carrier base Laredo Bridge Both Directions Carrier Crossings 340,000 5, ,000 5, ,000 4, ,000 4, ,000 3, , , , Bridge Data Sum 2012 Bridge Data Sum Jan Feb Mar Apr May Jun Jul Aug Sep Oct Nov Dec 3,000 2,500 2, USX Data Sum 2012 USX Data Sum Jan Feb Mar Apr May Jun Jul Aug Sep Oct Nov Dec Spike in activity March, May-June, August-October Major truckload providers combined are less than 10% of overall daily crossings

26 Peak Season Solutions Shifting Capacity 2 segments 2 shifts With peak season demand both markets in Mexico and Laredo will need capacity miles from Dallas metro area down to Laredo miles from Mexico City area to Guadalajara.
 out of Mexico into Florida Opportunity to avoid congestion in Laredo and capacity shortages Project on-hold mainly due to limited westbound")
27 M-10 Marine Highway Route from Brownsville to Port Manatee, Florida $3.2 million government grant extended to end of 2013 Move overweight (57k lbs.) out of Mexico into Florida Opportunity to avoid congestion in Laredo and capacity shortages Project on-hold mainly due to limited westbound backhaul

28 U.S. Mexico Interline Rail-Ferry Service Rail-ferry service operates between Mobile and Veracruz. CGR's ferry service is provided by two 585-foot long, roll-on/roll-off, selfpropelled vessels that can each be loaded with 115 railcars. The vessels have double decks and 30-foot high sidewalls that protect the railcars from sea water


29 Rail is Becoming a Better Option Rail service has improved significantly Ferromex & Kansas City Southern Cost effective solution Generally longer haul makes economic sense. New options to northwest corner of Mexico West Coast markets Southbound - Mexican Customs Limitations
30 Security Perceptions and Misperceptions, Security Solutions


31 Mexico Risk by Geographic Region Central, Gulf Coast, and Northeastern parts of Mexico are high risk areas. Source: 2012 Mexico Cargo Theft Annual Report ; FreightWatch Supply Chain Intelligence Center 31 C op

32 32 C op Mexico Cargo Theft by Product Type Source: 2012 Mexico Cargo Theft Annual Report ; FreightWatch Supply Chain Intelligence Center
33 Quantifying Mexico Freight Theft One source estimated 4,715 reported thefts in 2012 Stolen freight represents a fraction of a percentage of the millions of loads moved each year Stolen freight load value increased 38% 2011 v Great security companies available Hidden GPS Virtual corridors Security providers capable of freight recovery is key
34 Cargo Insurance in Mexico Mexican carriers limited cargo liability Must be stated in the Carta De Porte Carmack applies or Mexico liability? Concealed theft Where did loss occur? Shipper Transit United States Laredo Terminal Laredo Customs Broker Facility/Yard Drayage Service Bridge Crossing Mexico Yard/Terminal Transit Mexico Consignee Transload Crossdock Maintenance
35 Cargo Theft Modus Operandi Highjacking - 83% of 2012 cargo theft incidents in Mexico Remaining 17% cargo theft incidents: Theft of unattended trailer Rail theft Warehouse burglaries Deceptive stops Thieves stop loads disguising themselves by driving fake police or military vehicles and/or wearing clothing with insignias of police or other law enforcement. Source: 2012 Mexico Cargo Theft Annual Report ; FreightWatch Supply Chain Intelligence Center 35

36 Mexico Security Concerns Carrier and Customer Practices Driver Hiring Process Equipment Communication C-TPAT Compliance Trailer Yard Terminal security. Route Control Monitoring and Quick Response
37 Best Practices
38 Role of Mexican Customs Broker Very different from the U.S. 750 licensed brokers in Mexico U.S. has 11,000 active brokers No new licenses in Mexico Handed down from generation to generation Mexican customs reducing number of brokers Liable for verifying paperwork and cargo against actual entry Mistakes create fines, confiscated cargo, loss of lic., jail Hold client s paperwork for 5 years
39 Border Trending Toward Integration Simplifying the border with single party accountability Hands off communication and limited visibility BLACK HOLE USA MEXICO U.S. CHB MX CHB U.S. Inland Move Border Process Mexico Inland Move
40 Ownership of Mexican Transport Partner vs. Interchange Better visibility of freight Clear separation of finances. No mixed priorities Improved trailer turns Profitable Trustworthy partner (but finances still audited) 2 fleets to manage


41 Best Practice - US-MX Border Operations Lengths of Haul in Primary Lanes ( Mi.) Legend Ontario Sunnyvale Eldersburg Plant DC Gateway


42 Collaborative Planning Co-Load Whirlpool s Product Daltile s Product Each Partner Saved 10-20% on Freight Spend
43 Intra Mexico Distribution Historically controlled by small/family owned carriers Limited infrastructure / low cost Larger players beginning to emerge New focus on technology (TMS) Improved optimization, efficiency and security
44 Thanks