Improve Inter Terminal Transportation: Using Agent Technology. May 16, 2017
|
|
|
- Mabel Fleming
- 5 years ago
- Views:
Transcription
1 Improve Inter Terminal Transportation: Using Agent Technology May 16, 2017 Lawrence Henesey School of Computing (COM) Blekinge Institute of Technology Biblioteksgatan 3 Karlshamn, S Sweden lhe@bth.se
2 Introduction Trend of containerization is increasing since introduction of container in 1960 e.g. Port of Rotterdam: 360,000 TEU 1 in 1970, 10.8 million in 2007, 15.9 million in 2020 (Albert Douma, 2008) Expansion of container ports Multi terminals in a single port Inter-terminal transportation (ITT) 1 TEU = Twenty Equivalent Unit
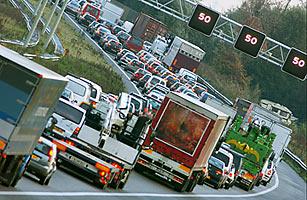
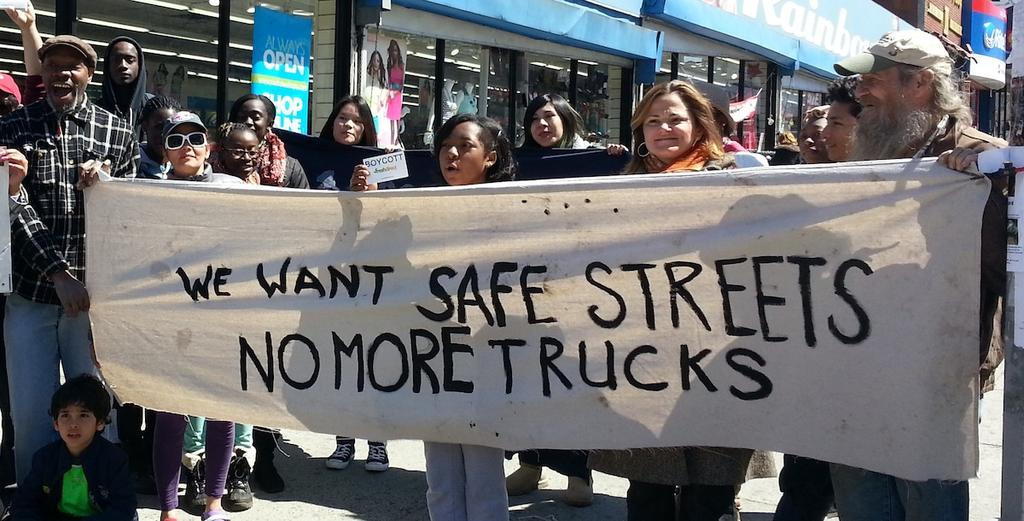
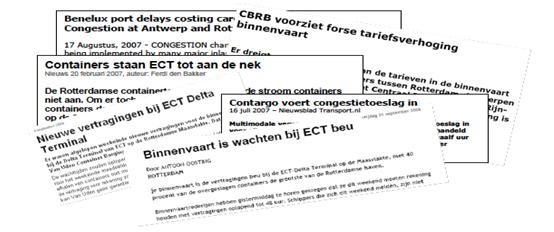
3 Motivation
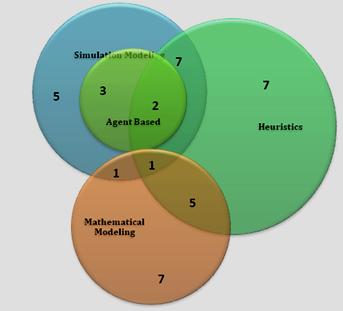
4 Related work Jaap A. Ottjes et. al 1996, 2006 Prior presents simulation concepts for ITT, later presents a model and comparison of three vehicle systems Albert Douma focused barge handling in 2008 Recently Tierney et. al presented mathematical model for ITT in 2014


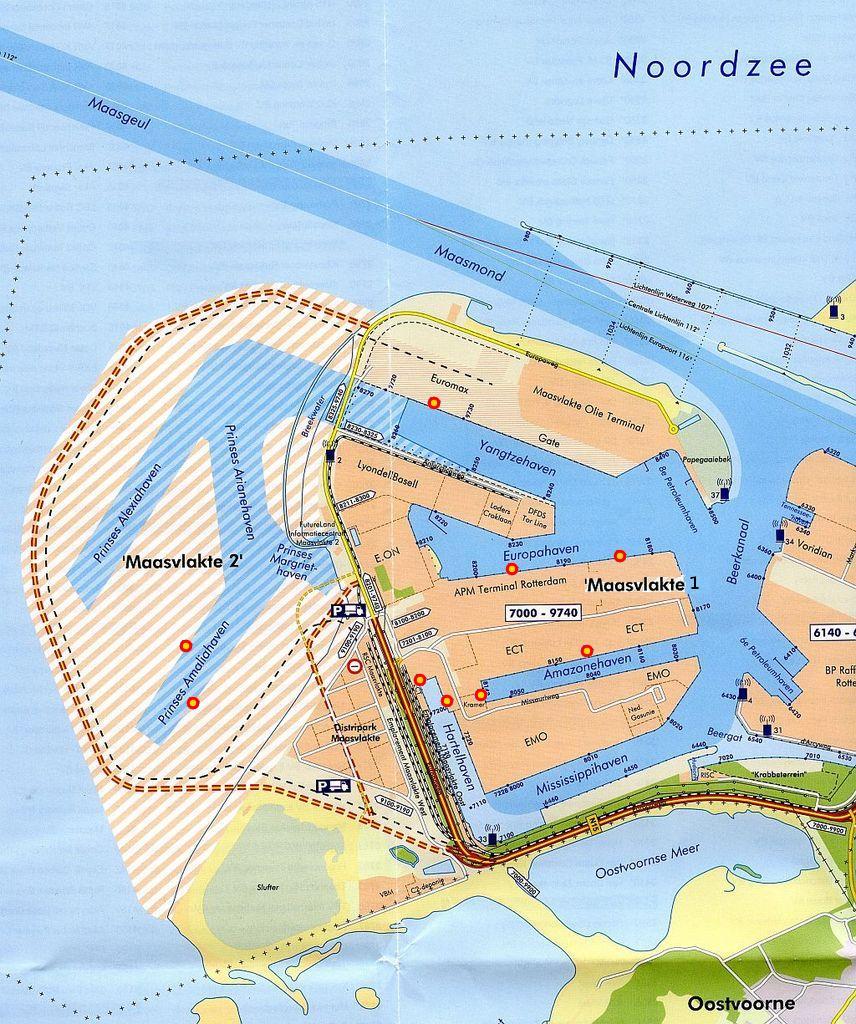
5 MV area of Port of Rotterdam
6 Research Questions How can operations of inter-terminal transportation be improved to meet future challenges of containerization? ü What are the challenges for container transportation at container terminals? ü What is state of the art for solving the problems identified in RQ1? ü How can we model ITT using a Multi-Agent system? ü How can we efficiently use resources involved in ITT?

7 Modern Container Terminal Operations in container handling Yard Operations H H Ship Operations Gate / Interchange Operations


8 Horizontal Transport types Cassette System is a floating buffer for decoupling and double stacking of containers Concepts & Designs Man Driven Solutions Automated Solutions TTS Translifter TTS Cassette AGV ATT Gaussin Automated ATT Gaussin

9 Problems Focused & Domain
10 Solution Approaches

11 Information Technology This diagram presents a general-purpose logical structure for any port operation It s a bit scary, but gives some context * Appreciation to Tom Ward Next Generation Container Terminal, ORCHID
12 TOS Terminal Operating System Business Information Management Sorting & Processing Yard Wharf Rail Yard Resources Rail Yard RY Yard Transport Storage and Retrieval Wharf Yard Transport Stevedoring Resources Equipment Operations Management Labor Management The TOS is focused on logistics, business, transactions, and regulatory compliance It is not designed to handle time and motion problems in real time
13 TOS Limitations The TOS determines: What needs to move When it needs to have handling finished What external data must be presented as work is done The TOS provides the target end-result of the operation, but is not naturally efficient at balancing all the competing needs The same TOS should be used for all terminals, without the burden of automation control where it is not needed We need something more robust and focused
14 Multi Agent Systems The container terminal is complex : Too complicated for most humans to comprehend Too random for normal algorithmics to optimize Multi Agent Systems (MAS) allow a layered, modular approach to rapidly getting to balanced solutions within complex systems In an MAS, agents search, coordinate, communicate, and negotiate with other agents via a market based mechanism Not optimum but balanced * c.f Multi-Agent Container Terminal Management by L. Henesey, 2006, pp.1-271
15 Agents in the Port Logical Model Road Network Truck Truck Services AGV Agent Marine Terminal Facility Berth Agent Water Gate Resources Gate Yard Transport Vessel Services Gate Agent Gate Rail Rail Agent Yard ASC Agent Wharf Vessel Train Rail Yard Resources RY Yard Transport Inventory Agent Yard Wharf Yard Transport Ship Agent Stevedoring Resources Train Services Security Rail Network This diagram depicts the scope of a number of Agents in a Port MAS: Berth, Ship, Gate, Rail, Inventory; ASC and AGV fleets; individual CHEs The MAS allows parallel balancing of complex issues in real time


16 Ship Operations A Simulated Container Terminal H ROAD Yard Operations H Gate / Interchange Operations RAIL Netlogo Simulation tool
17 Conceptual Modeling Terminal Agents Transport Agents (Vehicles) Road Vehicle Agents 1. Automated Guided Vehicle (AGV) 2. Multi-trailer system (MTS) 3. Truck Rail Agents Barge Agents

18 Road Vehicle Flow

19 Train Flow

20 Barge Flow
21 Tool Selection AnyLogic and NetLogo Comparison AnyLogic NetLogo Programming Language Java Scripting Programming Paradigm Object Oriented Procedural 3D animation Yes (Powerful) Yes (Limited) Drag and Drop Yes NO Components Data Analysis Yes (Powerful) Yes (Limited) Data Import/ Export Easy and several methods Limited (Text Files Only) Model Export Java Applet (Paid Version) Java Applet (Third Party) Developer Guide Yes Yes Help Training videos, Paid training sessions, Descriptive Documentation Online Social media Community
22 Structure of Simulation Data Sets and Parameters Container Demand Terminal resources Distances between terminals Vehicle parameters Update States Main Simulation Thread Monitor Simulation Load Data Terminal Agents Agents Transport Agents Road Vehicle T1 T2. Tn Barge T R U C K C A G V M T S Train
23 Container volume demand / flow Weekly ITT Volume (in TEU) Distribution for Scenario 3 RWG APMTMII ETR RCT APMTR DCS ECTDT ECTD-BFT VDCD KDD Total RWG APMTMII ETR RCT APMTR DCS ECTDT ECTD-BFT VDCD Total 94231
24 Experiment Setup Transport Settings Mode/ Vehicles Maximum Capacity (TEU) Average Speed (m/s) # of Vehicles AGV 4 (Double Stacking) 6 Variable MTS 10 6 Variable Truck 2 6 Variable Train Barge
25 Experiment Setup Terminal Settings Terminal Name Cranes Gate Barge Train Terminal Loading/ unloading Time per Container (Minutes) Cranes Loading/ unloading Time per Container (Minutes) Capacity in terms of Trains Train Change over Time (Minutes) RWG APMTII ETR RCT APMTR DCS NA ECTDT ECT-BFT VDCD NA 0 NA KDD NA
26 Summarizing all scenarios Road Vehicles Required for All Scenarios Scenario Name Road Vehicles Operational Hours/week Trucks Scenario 1 AGV MTS Trucks Scenario 2 AGV MTS Trucks Scenario 3 AGV MTS
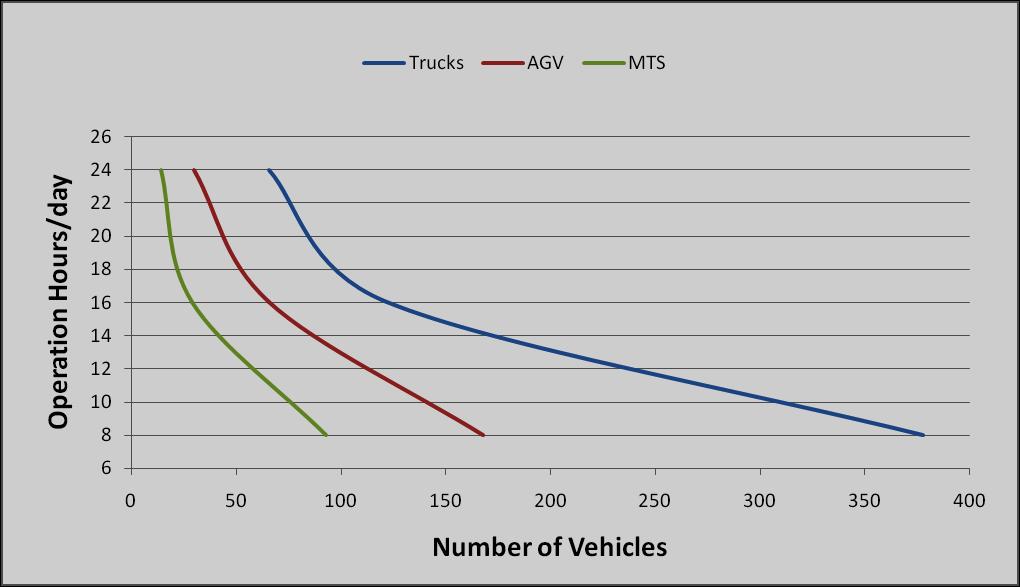
27 Summarizing Scenario 1
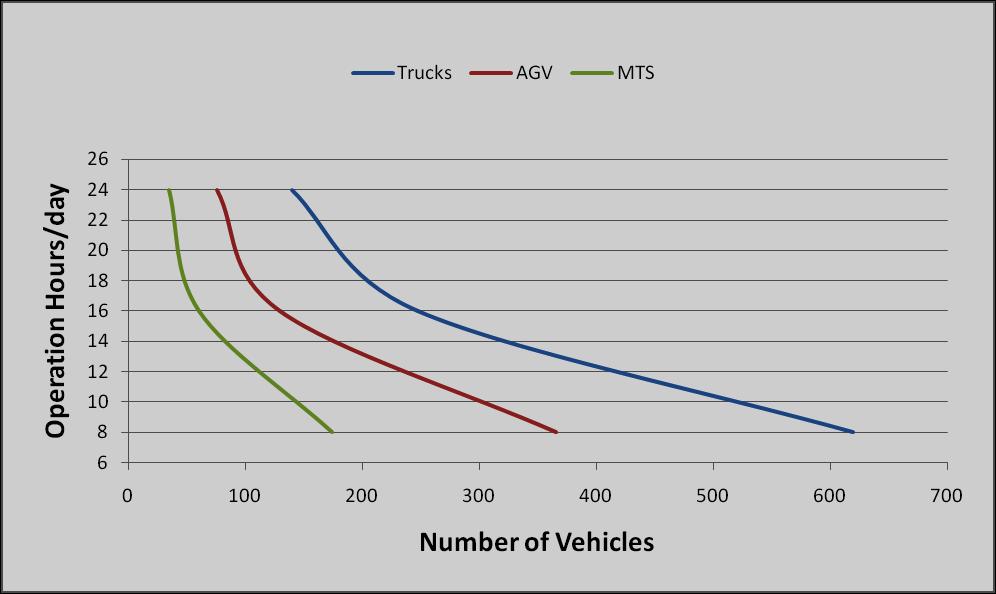
28 Summarizing Scenario 2
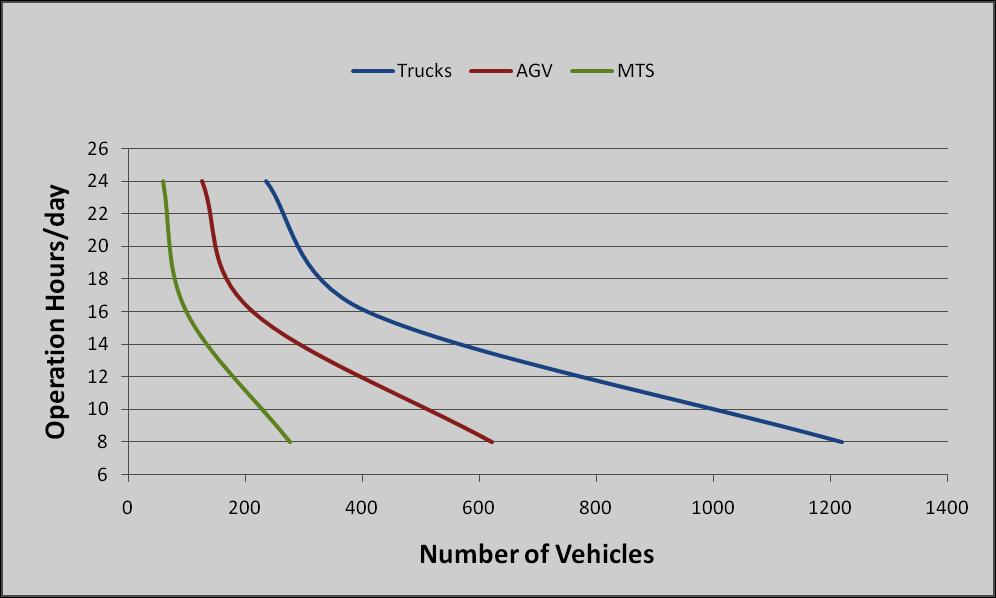
29 Summarizing Scenario 3
30 Strengths & Weaknesses Simulation Model Did not change more than one variable at a time during simulations Validation and verification functions Model does not perform as good as required for barges and trains in 56 hours/week scenario One scenario shows unexpected service time for AGVs
31 Concluding remarks Designed and implemented ITT model to help ITT planners in planning and estimation Explored different combinations of transport vehicles for different scenarios Discussed utilization of terminal resources
32 Future Work Model can be improved by working on its current limitations Model can be evaluated with variable number of barges and trains Model can be extended to consider Intra-terminal operations Additional automated vehicles to be considered, i.e., Automated lifting vehicles or Automated Multitrailer System,
33 Lawrence Henesey School of Computer Science Blekinge Institute of Technology Karlshamn, Sweden