Transportation Management Data:
|
|
|
- Dominick Turner
- 5 years ago
- Views:
Transcription
1 Delaware Department of Transportation 2016 ITE Mid-Colonial District Annual Conference Transportation Management Data: Enhancing the Way We Do Business Gene Donaldson Alyssa May, PE
2 Agenda Monitoring capabilities Enhancing the way we do business Case studies 2


 Delay-at-a-glance traffic Roadway weather")
3 Driving in Delaware? Access real-time traveler information g at your finer tips with the DelDOT App. The DelDOT App provides up-to-the-minute, reliable traffic data that comes directly from DelDOT s Transportation Management Center (TMC). Use the interactive traffic map to view Live video from 150 traffic cameras Travel times for the heaviest-traveled roadways Round-the-clock travel advisories (incidents) Delay-at-a-glance traffic Roadway weather Travel restrictions and closures The App also provides quick access to WTMC 1380 AM 24-hour broadcasts and social media connections. 3


4 Integrated Transportation Management Strategic Plan (1997) Required a foundation for a shared mission and vision between all of Delaware s Transportation Management System stakeholders. The plan defined Delaware s Transportation Management: Mission Vision Goals Strategies for Implementation Defined a Statewide Transportation Management Program managed from a central transportation management center (TMC). 4


5 Integration of Operations and Planning Making the most of transportation data. Involving the right cross-section of people. Developing good ideas. Making decisions. Taking action. 5
 Wind Speed & Direction Water Level & Speed")
6 Data Needs For Transportation Decision-Making Traffic Volume Delay Speed Weather Air Temperature Barometric Pressure Relative Humidity Precipitation Type & Volume Classification Travel Time Pavement Temperature Trip distribution Subsurface Temperature Origin and destination Pavement Surface (Dry, Wet, Ice) Wind Speed & Direction Water Level & Speed Capacity 6
7 Data Collection Then In 1999 Spot counts (intersections, tubes, travel time runs) Volume counts only from 60 Automatic Traffic Recorders (ATRs) Data collection duplication Model existing conditions Not enough data to measure reliability Severity of traffic congestion Touch on mobility in project prioritization 7
8 Data Collection Today Quantity and Quality 8 Continuous data (24/7/365 data from permanent sensors) Volume, class, travel time, weather, incidents, transit Collaborative data collection and sharing Measure existing conditions Plenty of data to validate other data Plenty of data to measure reliability Severity and frequency of traffic congestion Quantify mobility statewide in project prioritization

")
9 Over 1,000 Monitoring Devices Today, and More Planned Includes permanent and portable devices Live video from 150 permanent cameras, 20 portable cameras and now 40 live dash cams Speeds, volumes, delay and classification from over 150 permanent and 13 portable Wavetronix radar detectors Volumes and delay from over 1,000 traffic signal system loops Travel times and origin-destination data from 130 permanent, 4 portable trailers, and 10 portable suitcase Bluetooth readers 20 permanent roadway weather stations 10 hydrology stations 80 permanent Automatic Traffic Recorder (ATR) stations 9
10 How Do We Use All This Data?? Built the tools to manage and use the data Building predictive system by incorporating historical and real-time data Creating Storing systems to watch systems and sharing data 10


11 Monitoring the Traffic Heartbeat Heartbeat = normal traffic data trends 11 [ Change in Heartbeat ]


12 Now we can measure Reliability. Travel Time Statistics Sample size 12
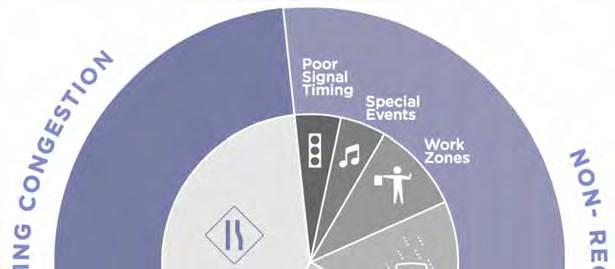
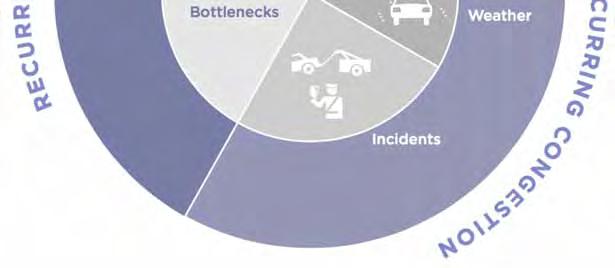
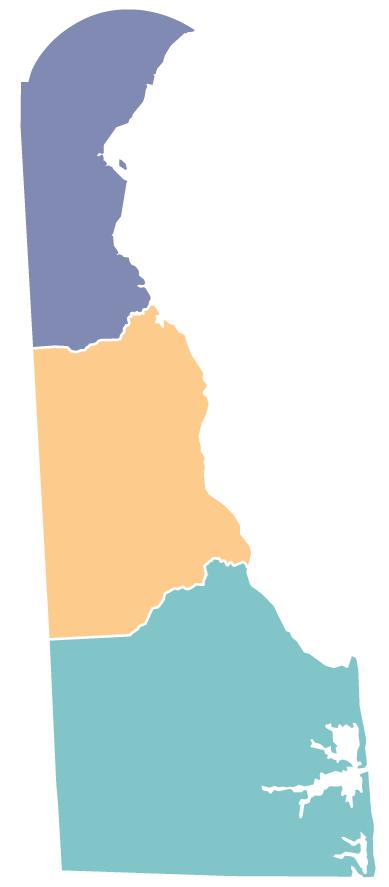
13 Traffic Congestion Diversity 13
14 Severity and Frequency 2015 traffic volumes on DE 1 near Milford Duration of resort peak Lightest traffic during winter storms Heaviest traffic on Summer Saturdays Winter traffic about ½ of summer traffic 14

15 Data Application: Customer Relations Citizen Call: DE 1 at Shuttle Drive Call 15 Can immediately check volumes, signal timings Sharing Data Citizens Economic development Transportation professionals Academia

16 Data Application: Operations Daily operations Traffic studies Special events require studies: NASCAR, Firefly, Papal Visit Measure normal volumes and travel times Predict failure thresholds Manage capacity Provide info to the public 16


17 Data Application: Transportation Solutions Before Signal timing: SR 141 Travel times Volumes Truck %s Pulled data multiple times in one year After 17
18 Data Application: Transportation Solutions Volumes DE1 1 AT CHRISTIANA MEADOWS DE1 1 NORTH OF US DE 1 AT BEAR RD DE 1 AT SPRINGFIELDS BLVD Multiple locations Dashboard DEE 1 AT DE1 US13 SP PLIT EXIT 156.N App roximate Color Scale: S in mph :45 AM :30 AM :15 AM :00 AM :15 AM :30 AM SR 273 8:00 AM :30 AM :45 AM :15 AM :45 AM :00 AM :15 AM :30 AM :00 AM :30 AM :45 AM AM 10:00 Speeds 9:45 AM RT1 1 AT CHRISTIANA MALL 5:15 AM Capacity Addition: DE 1 Auxiliary Lane 5:00 AM FIGURE E 3 - SPEED D DATA DA ASHBOAR RD FOR MA AINLINE AFTER C CONDITIO ONS (Decemb ber 1-3, 2015) 70 75


19 Data Application: Transportation Solutions Delaware Department of Transportation (DelDOT) Radar Traffic Detector System Enhancing Design Wavetronix SmartSensor Consideration of Operations Data for Traffic Book What it Does Detects vehicles by lane. Provides real-time traffic volume, speed and delay to the Transportation Management Center. Classifies vehicles by length. How it Helps AADT Each detector is positioned adjacent to the r oad, non-intrusive to traffic. Radar traffic detectors are one source of real-time data provided on DelDOT s public website and smartphone app. Truck percentages Changes in real-time data indicate lane blockages or other roadway issues. Data is also used in planning studies and for design. Plenty of data to identify design hours Image Courtesy of Wavetronix How it Works The radar traffic detector collects the following data: Timestamp of each passing vehicle Total number of vehicles by lane Project Prioritization Vehicle speeds (miles per hour) Vehicle lengths (short, medium, long) Where radar detectors are spaced suitably, DelDOT uses the speed data to calculate travel time and delay. Vehicle length measurements are correlated to the Federal Highway Administration vehicle classification system. DelDOT currently has about 140 detectors installed, and plans to continue gr owth on freeways and major arterials. 19
20 Data Application: Traffic Studies Planning projects: I-95 SB OriginDestination Study 20

")

21 Data Application: Planning Planning projects: Transportation Operations Management Plan (TOMP) Small Medium Large Based on traffic congestion Based on reliable data 21
22 Where are we going? Adding more data to the Extranet Using data to understand causes, severity and frequency of recurring and non-recurring congestion Predicting issues before they occur Identifying affordable quick wins Enhancing project prioritization 22
23 Where are we going? 23

24 The Data is in Your Hands! DelDOT App Real-Time Volumes, travel times, traffic cameras and more Extranet Historical Register: Download traffic counts and operations documents 24
25 Delaware Department of Transportation 2016 ITE Mid-Colonial District Annual Conference Thank You! Gene Donaldson Alyssa May, PE