Third AASHTO SSOM Webinar on Integrated Corridor Management. March 27, 2014
|
|
|
- Clement Wilkerson
- 5 years ago
- Views:
Transcription

1 Third AASHTO SSOM Webinar on Integrated Corridor Management March 27, 2014
2 Agenda 1. Introduction/Kickoff Patrick Zelinski 2. Webinar Software Patrick Zelinski 3. Overview Bob Sheehan, Federal Highway Administration 4. Washington State DOT Vinh Dang 5. Maricopa County, Arizona Reza Karimvand and Faisal Saleem 6. Utah DOT Jeff Harris 7. Q & A Patrick Zelinski, Bob Sheehan, Vinh Dang, Reza Karimvand, Faisal Saleem, Jeff Harris, and Melissa Ackert (Florida DOT) 8. Closing Remarks John Nisbet
3 Integrated Corridor Management 1
4 Webinar Series January ICM Program Review February San Diego ICM Demonstration Covered: History of Program Concept and Fundamentals Approaches and Strategies Benefits Analysis, Modeling, and Simulation Demonstration Knowledge and Technology Transfer 2
5 ICM Program Objectives 1. Demonstrate and evaluate pro-active integrated approaches, strategies, and technologies for efficient, productive, and reliable operations. 2. Provide the institutional guidance, operational capabilities, and ITS technical methods needed for effective Integrated Corridor Management. 3

6 San Diego, CA (I-15) Dallas, TX (US 75) Pioneer Sites Dallas, TX Houston, TX Minneapolis, MN Montgomery County, MD Oakland, CA San Antonio, TX San Diego, CA Seattle, WA 4
7 ICM Benefit Areas Safety Mobility Reliability Emissions and Fuel Consumption Benefits and Cost Comparison 5
8 Potential Benefits of ICM Three AMS Sites Dallas, Minneapolis, and San Diego PERFORMANCE MEASURE AREAS San Diego Dallas Minneapolis Annual Travel Time Savings (Person-Hours) 246, , ,000 Improvement in Travel-Time Reliability (Reduction in Travel-Time Variance) 10.6% 3% 4.4% Fuel Saved Annually (in Gallons) 323, ,000 17,600 Tons of Mobile Emissions Saved Annually (in Tons) 3,100 9,

9 Integrated Institutional Integration Operational Integration Technical Integration Coordination to collaboration between various agencies and jurisdictions that transcends institutional boundaries. Multi-agency and cross-network operational strategies to manage the total capacity and demand of the corridor. Sharing and distribution of information, and system operations and control functions to support the immediate analysis and response. 7
10 Management ICM requires that the notion of managed corridors, and the active management of ALL individual facilities within the corridor, be considered. Passive Active 8
11 ICM Operational Approaches A. Information Sharing / Distribution B. Improve Operational Efficiency at Network Junctions C. Accommodate (Passive) / Promote (Active) Cross Network Route and Modal Shifts D. Modify Capacity, Short Term Demand Relationship Within Corridor (Short Term) E. Modify Capacity, Long Term Demand Relationship Within Corridor 9


12 Stakeholders Who s here today? Who s missing? Roadway Agencies Planning Organizations Private Sector Transit Agencies Activity Centers Fleet Operations Public Safety Other agency departments Traveler 10


13 Vinh Dang Freeway Operation Eng. ICM in Seattle area State of the Practice Lynn Peterson Secretary of Transportation John Nisbet Director of Traffic Operation. SSOM - ICM Webinar May 27, 2014
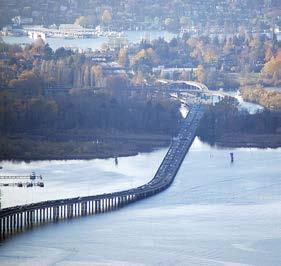
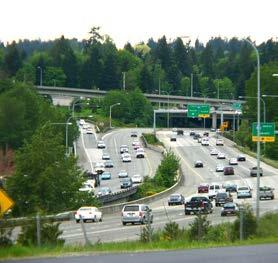
14 Background One of the 8 pioneer sites Funded through stage 1 - ConOps Partnership with City, County, Transit 7 miles initially 10 miles with more parallel routes and modes Partnership is not just sustained, but actually is growing
15 Challenges Unused capacity on arterial (sharp peak). Unstable freeway flow (flat peak). Impact of major incidents & events. Consistent presentation of traveler information. Planned closures, and major construction. Coordination and integration between stakeholders.
16 Objectives Corridor perspective goal Major partners shared this goal at the grass root level history of working together, sharing control and resources. Strengthen and expand this perspective out to more local agencies and new partners. Facilitate formation or new ICM corridor in the State, or extend the existing corridor in the Region.
17 Objectives Mobility/Reliability goal Improve travel predictability. Maximize the efficient use of any spare corridor capacity. Facilitate route shifts and mode shifts. Improve transit speed and reliability. Increase and retain mass transit ridership. Improve commercial vehicle operations through and around the corridor.


18 Operational strategies - Corridor Route shift at strategic interchanges Mode shift at regional Park and Ride and major parking Commuter rail line Light rail / Regional bus

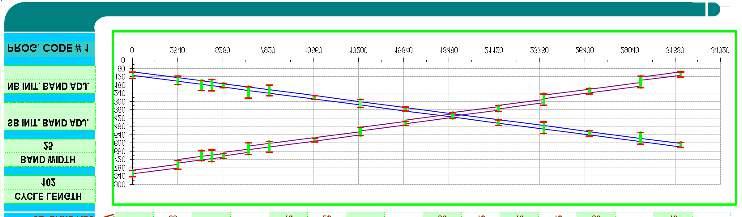
19 Tactical manage demand /capacity Ramp metering to manage demand Speed transition preserves smooth flow Lane control prepares navigation maneuvers Peak shift W Seattle Br - NB Onramp 0:00:00 1:15:00 2:30:00 3:45:00 5:00:00 6:15:00 7:30:00 8:45:00 10:00:00 11:15:00 12:30:00 13:45:00 15:00:00 16:15:00 17:30:00 18:45:00 20:00:00 21:15:00 22:30:00 23:45:00 10/27/2011 Average

20 Tactical VMS for route choice Up to 100% ramp volume increase
21 Tactical Parking for mode choice Expanded parking at the Tukwila Commuter rail station. Parking pilot projects: - permit parking at P&R - real-time parking availability Reduced parking cost at SeaTac on game day Increase light rail service during event day

22 Other potential corridor in the Region Green River Valley corridor - HOT lane - Good parallel routes - Major train stations - Freight distribution center in Kent Everett-Seattle - Good transit on SR 99 - Multiple jurisdictions Actively involve in the RTOC to build on the grass root perpective


23 LOOP 101 Faisal Saleem ITS Branch Manager MCDOT SMARTDrive Program Manager Maricopa County Department of Transportation & AZTech Project Manager Reza Karimvand, P.E. Assistant State Engineer Transportation Technology Manager Arizona Department of Transportation & AZTech Co-Program Manager
24 Goals Improve freeway-arterial coordination Event-driven major incident closing freeway Elevate coordination and communication among partners Work within available resources
25 AZTech ICM Role Developed Freeway-Arterial Coordination White Paper Developed Concept of ICM in the Region Proposed I-10 and I-17 ICM Projects for MAG Funding Advanced the L101 ICM (Developed Plan, implementation in progress) Focus of this presentation is L101 ICM
26 L101 ICM Partners & Roles Arizona Department of Transportation (ADOT) TOC, ALERT Arizona Department of Public Safety Maricopa County DOT TMC, REACT City of Scottsdale -TMC Scottsdale Police Department/Fire Department Salt River Pima-Maricopa Indian Community (SRPMIC) Maricopa Association of Governments

27 Loop 101 Characteristics Sector 1: South Scottsdale Loop 202 (Red Mountain) to Via De Ventura Boulevard Sector 2: Central Scottsdale Via De Ventura Boulevard to Frank Lloyd Wright Boulevard Sector 3: North Scottsdale Frank Lloyd Wright Boulevard to Scottsdale Road. Arterials - 3 Miles Either Side of Freeway Freeway Management System Arterial Management System

28 Loop 101: Initial Crash Analysis
29 Loop 101 Characteristics CHALLENGES Agency notifications Some diversion routes are a challenge Three distinct zones Different routes and options UNIQUE ASPECTS Commuter corridor Arterial ITS infrastructure TMC/TOC operations expertise Signal operations Traveler information Provide travelers with specific alternate routes

30 L101 ICM Plan -Strategies
31 ICM Plan Performance Measures Agency notification time dispatch/dispatch and dispatch/tmc; Incident measures (time to respond, duration, clearance off of roadway, recovery [time to return to normal traffic conditions]); Primary and secondary crashes; Local traffic signal measures (number of signal timing changes, time that signals are in adjusted timing plans); Travel times (on freeways and arterials); Traffic throughput; REACT measures (number of call-outs, response time, clearance time, DMS messages posted); FSP/ALERT measures (similar to REACT); Number of media initiated contacts (social media posts, press releases, newscasts via radio/tv, distributions); System usage (VDS access, 511 phone/web, CAD entries, HCRS/RADS) Joint operations activities (number of times local agency used another agency s camera, DPS used ADOT s cameras); After action, meetings after every major closure; Emissions and fuel consumption; and Public response. 9
32 L101 ICM Plan Operations Plan Roles and Responsibilities Freeway operations Arterial operations Coordination between traffic and responders Diversion routes and notifications Policies and Agreements Operational Capabilities and Processes Operational Guidelines Master Traffic Management Plan (TMP) Contact List and Lines of Communication


33 Arterial Traffic Management: REACT Response Plan - REACT route guidance plan - General Plan - Specific Scenario Plan 11
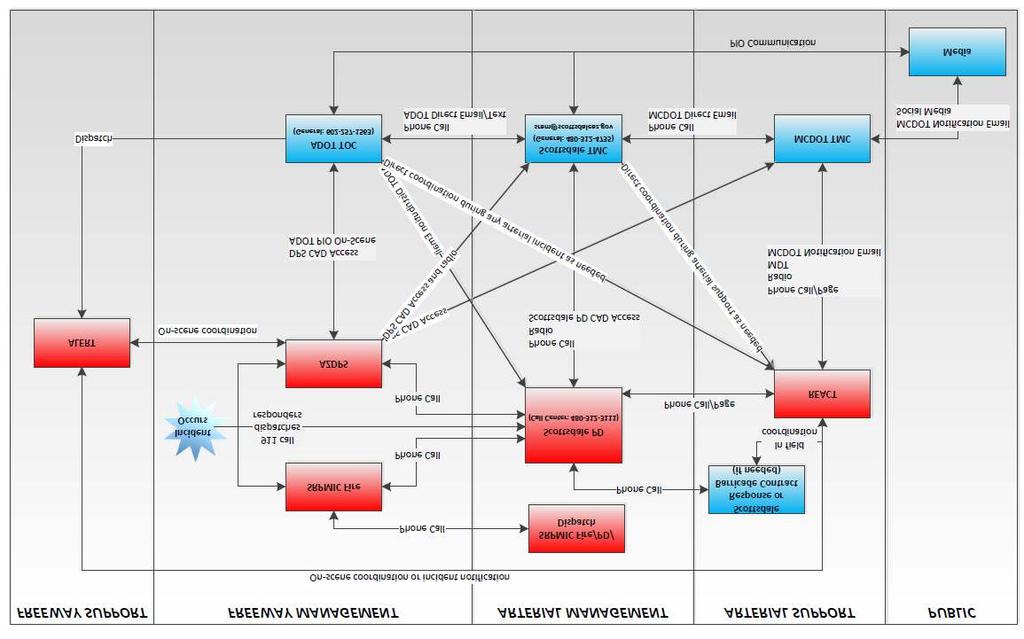
34 Lines of Communication

35 ICM Processes

36 ICM Tools: Modeling 14

37 ICM Master Plan 15

38 ICM Tools: Arterial Impact Tool Potential impacts based on: Traffic exiting freeway plus existing volumes Lane capacity on nearby routes Constraints on available arterials Provides input to: Signal timing strategies Traveler information REACT support Routes to get traffic back on freeway


39 L101 ICM Tools: Regional Archived Data System 17
40 L101 ICM Tools: Signal Management NORMAL EVERYDAY PLANS A.M. MID P.M. AVERAGE / BALANCED Moderate N/S Moderate E/W MID- NITE 10 EXTREME PLANS THRUS LEFTS THRU&LEFT 1 THRU&LEFT 2 N/S E/W

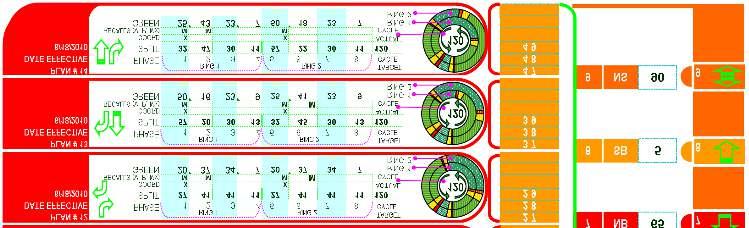
41 L101 ICM Tools: Signal Management 19

42 L101 ICM Tools: Signal Management 20


43 January 14, 2014 Crash involving a Scottsdale motorcycle officer Closed L101 southbound lanes Plan partially put in to action: ADOT s freeway-to-freeway diversion routes Scottsdale s signal timing plan updates REACT support for arterial diversions Traveler notifications 21
44 Reza Karimvand, P.E. Assistant State Engineer Transportation Technology Manager Arizona Department of Transportation & AZTech Co-Program Manager (602) Faisal Saleem ITS Branch Manager MCDOT SMARTDrive Program Manager Maricopa County Department of Transportation & AZTech Project Manager


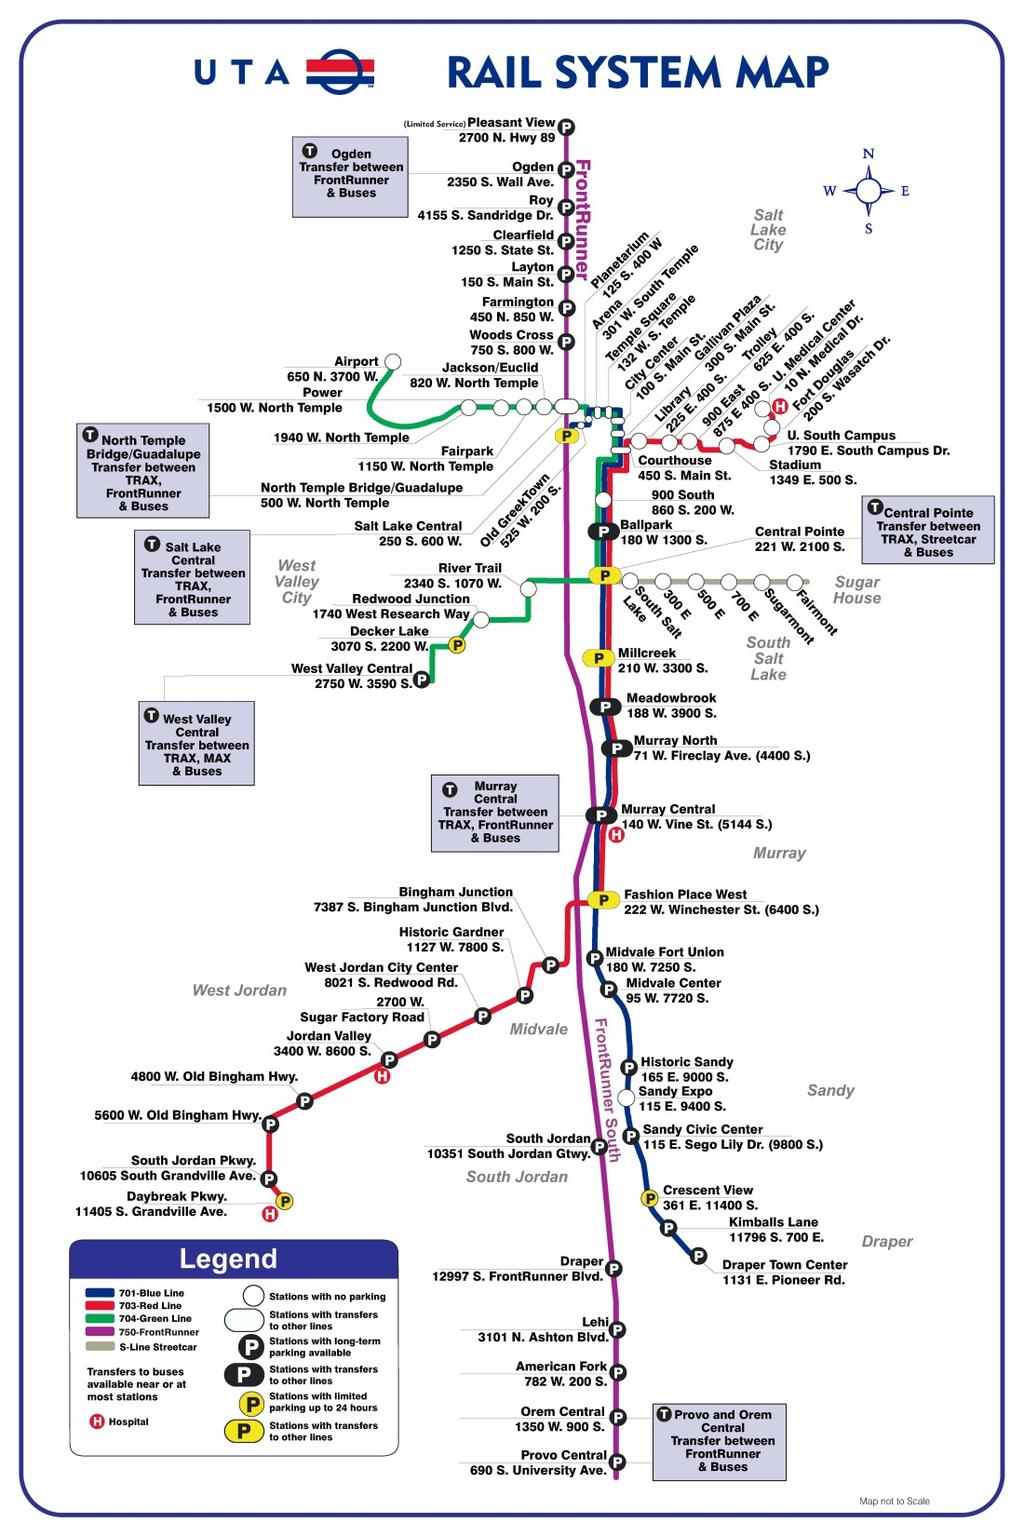
45 I-15 Transportation Corridor Jeff Harris Planning Director
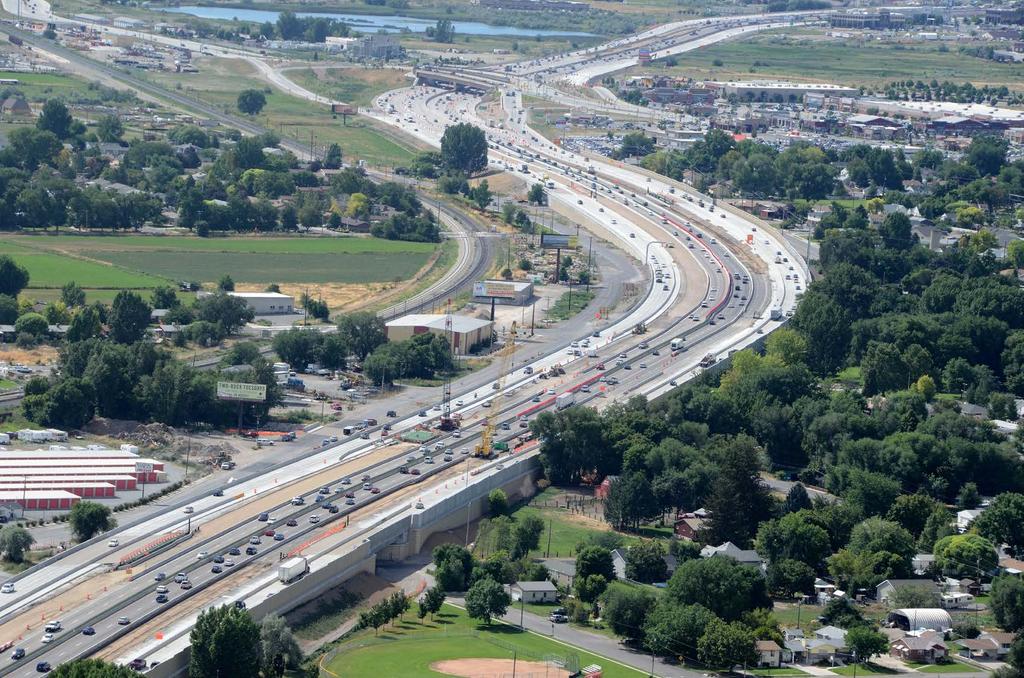
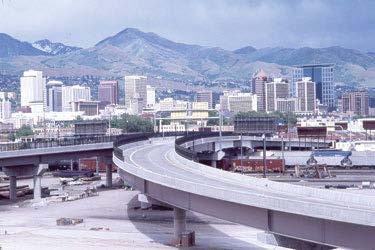
46 Roadway History of I-15 Corridor Improvements I-15 rebuild and expansion, late 2001 I-15 Core rebuild and expansion, late 2012 I-15 Point Project, in design Transit N/S LRT - December 1999 Commuter rail north - August 2005 Commuter rail south - December 2012 Mid Jordan - August 2011 Draper - August 2013 West Valley City - August 2011
47
48
49 Travel Demand Regional Significance of Corridor The Salt Lake County section of I-15 Corridor is and will be the most congested corridor in the state Mode Daily 2040 Trips % of Total I ,000 54% Arterials 204,000 35% Rail (LRT and RCR) 61,000 10% BRT 4,000 1% Total 518,000
50 Regional Significance of Corridor, Continued Economy Primary freight network Southern California and Nevada link to I-80 Logistics route linking most population and commercial centers in Utah CANAMEX Corridor In rural Utah, I-15 averages between Class 8 trucks/hour. In the urbanized area, I-15 averages Class 8 trucks/hour. Over 60% of long-haul trucks using I-15 south of Salt Lake City are connecting to or from I-80 east of Utah.


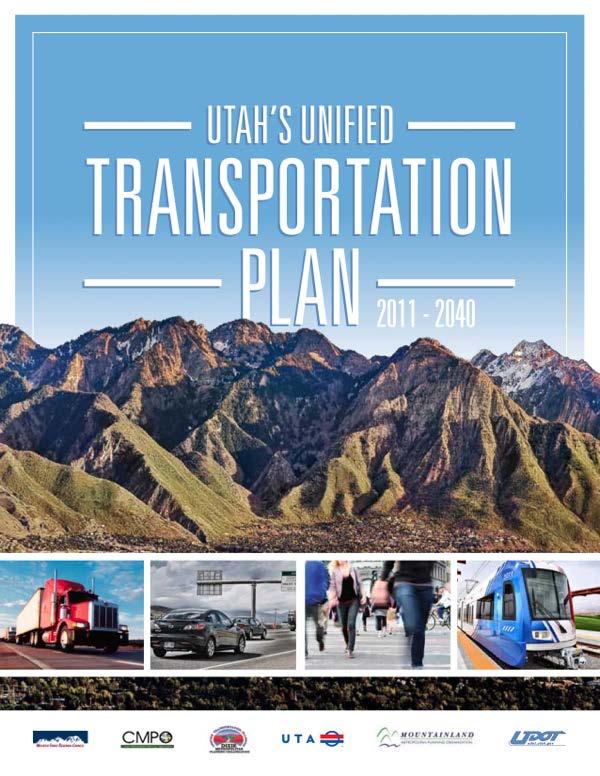
51 History of Partnerships Unified Transportation Plan four MPOs, UTA and UDOT Synch update cycles Consistent methodologies Consistent assumptions and data Communication tool - need! Approach to future updates of the RTPs and Statewide LRP On-going and continuous Joint roadway/transit corridors
52 I-15/Light Rail Intermodal DEIS


53 BRT Partnership 3500 S. University Parkway University Avenue

54 Project Collaboration 5600 W. Transit & Mountain View Corridor 400 S. Airport Extension
55
56 Vision for the I-15 Corridor Maximize use of existing infrastructure TravelWise and Rideshare Programs It will be difficult to expand future vehicular capacity Use of Technology I-15 area study to inform the 2019 RTP update Systemic approach Transit must carry a higher mode share in the future w/o using vehicles to access it Mode split to transit


57 Emphasis Area Integrated Transportation