Future Freight Flows: Today & Tomorrow
|
|
|
- Violet Benson
- 5 years ago
- Views:
Transcription


1 Future Freight Flows: Today & Tomorrow Chris Caplice Director, MIT FreightLab 15 June 2017 ctl.mit.edu MIT FreightLab Finding better ways to design, procure, manage, and assess freight transportation networks across all modes and regions. 1

 versus Responding MIT CTL Global Risk Survey n 1,500 responses from 70 countries n Rating from 0 (100% Prevention) to 4 (100% Response) Average overall was 1.")
2 FreightLab Partial Research Project List Optimal Transportation Procurement Global Ocean Transport Reliability Transportation Portfolio Design & Management Freight Transportation Productivity Carrier Fuel Burden Same Day Fleet Load Acceptance Small Carrier Profitability Strategies Direct to Store Delivery Strategies The Living Plan Robustness vs. Flexibility Supply Chain Complexity Disruptions of Dominant Distribution Design Underlying Question... How to deal with variability & uncertainty? Planning (Prevention) versus Responding MIT CTL Global Risk Survey n 1,500 responses from 70 countries n Rating from 0 (100% Prevention) to 4 (100% Response) Average overall was 1.41 n 54% Planners n 16% Responders n 30% On the Fence Demographic Drivers n Gender n Geography n Job Function Planner Responder Women are Responders Men are Planners (1.60 vs. 1.37) 4 2
3 Geography Of birth, not work! 5 Job Role or Function 3


4 The Living Plan: Robust vs. Flexible Planning 7 Is Ben Franklin still correct? An ounce of prevention is worth a pound of cure Poor Richard s Almanac 4
5 What is the problem? Overall Research Questions 1. How should a firm best select, on a strategic basis, what types of contractual relationship to use for which segments of its freight transportation network? 2. How should this decision fit into the general transportation procurement process? 3. How can we balance robustness with flexibility? Research Approach n Partnered with Wal-Mart n Extended research team (Dr. Francisco Jauffred co-pi) n Developed and implemented stochastic optimization model n Integrated in WM procurement process 9 Current Transportation Practice There is a continuum of relationships for TL based on: n Ownership of Assets versus Control of Assets n Responsibility for utilization n On-going commitment / responsibilities n Shared Risk/Reward Flexible contracts Spot Market Alternate Carriers Core Carriers Dedicated Fleet Private Fleet Use for random & distressed traffic Use for most reliable and steady flows 10 5
6 How much volume to assign to the fleet? Assigned Fleet Volume (AFV) per Week = AvgVol + (Buffer Volume) The Buffer Volume captures our confidence level. It can be positive or negative: > 0 indicates we prefer excess fleet capacity over being short (Short Sensitive) < 0 indicates we prefer short fleet capacity over having excess (Excess Sensitive) = 0 indicates we are indifferent to having excess or short fleet capacity (Risk Neutral) Lane: DCP -> S93304 ~N(14.6, 2) Probability 100% 90% 80% 70% 60% 50% 40% 30% 20% 10% 0% Prob Excess Sensitive Risk Neutral Cumul Loads Per Week Short Sensitive Continuous Lane Probability Lane: V > DCP ~P(3.6) 100% 90% 80% 70% 60% 50% 40% 30% 20% 10% 0% Prob Excess Sensitive Cumul Loads Per Week Risk Neutral Intermittent Lane Short Sensitive How do we determine the acceptable risk to calculate the optimal Buffer? All Tours Generated Optimally Each Week Frequency Histogram & CDF of All Tours in Complete Flexibility Operational Plan No. of weeks Frequency Cumulative % 100% 80% 60% 40% 20% 0% Consistent Tours! Cumulative %age of Occurrence 6
7 Annual Planned Tours that Appear in Weekly Frequency Histogram & CDF of Stochastic Plan Tours Greater Percentage of Consistent Tours!! No. of Weeks Frequency Cumulative % 100% 80% 60% 40% 20% 0% Cumulative %age of Occurrence Comparing Plan versus Operational Tours No. of Tours Break-down of the No. of weekly generated tours that consist of Stochastic Plan Tours Ad-hoc tours generated, that were not part of the Annual Plan (29%) No. of tours generated, that were part of the Annual Plan (71%) Operational Plan Simulation Week No. of Tours in Full Flexibility Operational Plan No. of Tours from Stochastic Plan 7

8 US TRANSCOM Project Explore, develop, and evaluate algorithmic techniques, methodologies, and approaches to better solve the tactical aircraft planning and scheduling problem for USTRANSCOM especially considering uncertainty and variability in missions. Sub-Objectives 1. Formulate and create code prototypes of candidate resilient optimization models 2. Examine the trade-off between robust planning and flexibility in response 3. Create a simulation test bed to enable hands-on testing and evaluation of different planning models, operational policies, and other factors Simulation Test Bed Overview Network Resources Requirements Parameters Simulation Module PLANNING MODULE Optimal Plan PLANNING MODULE Options: Heuristic Rules Deterministic Optimization Stochastic Optimization Robust Optimization UNCERTAINTY MODULE Options: Arrival of new requirements Change to old requirements Aircraft delays 2 1 UNCERTAINTY MODULE OPERATIONAL LOGIC MODULE OPERATIONAL LOGIC Options: Buy 3 rd party capacity Cargo re-routing allowed Aircraft re-routing allowed Cargo & Aircraft re-routing allowed SCENARIO ANALYSIS Actual Outcome SCENARIO ANALYSIS Lane capacity comparisons Total system cost Comparative statistics... etc. 8
9 Resilience Tradeoff Total System Cost Deterministic-Optimal Solution potentially fragile in face of any change Cost of the Plan Cost of Disruption Plan+Disruption Sweet Spot Resilient Solution proper balance of robustness & flexibility Overly Redundant Solution excess robustness or padding 0 No Resilience Level of Resilience (robustness & flexibility) High Resilience Synchromodal Flow 18 9
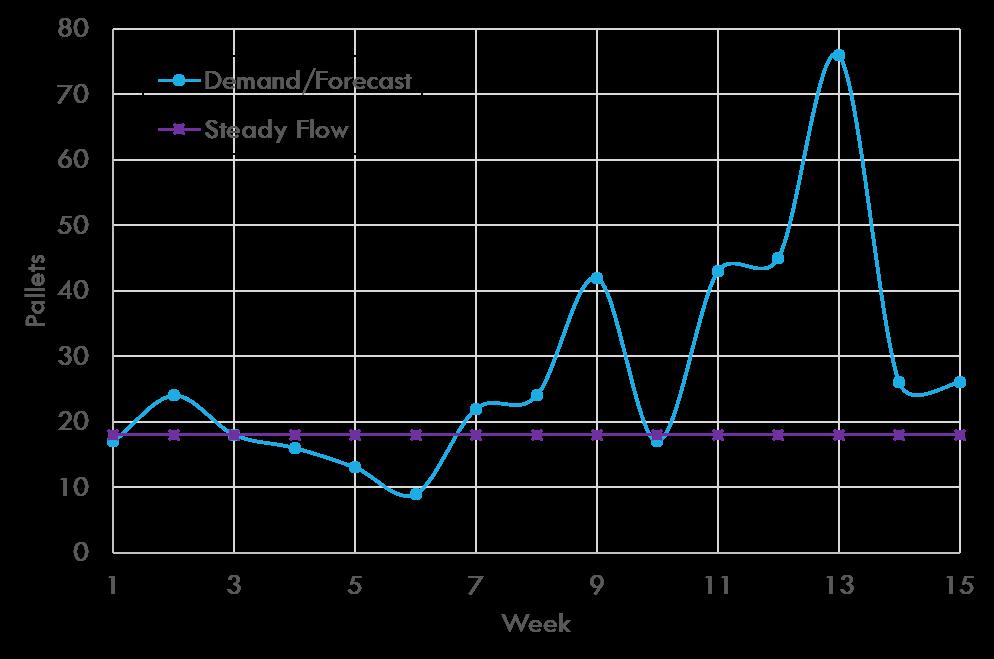
10 Synchronizing The Supply Chain Overall Research Questions 1. How can we identify SKUs that can be manufactured, transported, and distributed in stable quantities over an extended period of time? 2. Where do the savings come from for this synchronized flow? 3. How can we maintain/update this synchromodal plan going forward? Research Approach 1. Worked with large consumer packaged good (CPG) manufacturer 2. Thesis by Priya Andleigh and Jeffrey Bullock, supervised by Dr. Ahmad Hemmati 3. Developed model for identifying candidate SKUs and quantifying the benefits. Project Objective Plant Warehouse 10


 5 7 9 11")
11 Project Objective Plant Warehouse Which SKUs? How much? On- Demand Fixed Volume $ per load Steady Flow Trade-offs Transportation Savings Costs/Savings ($) Steady Flow (# of pallets/week) 11
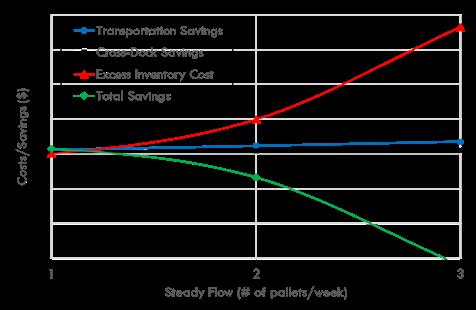
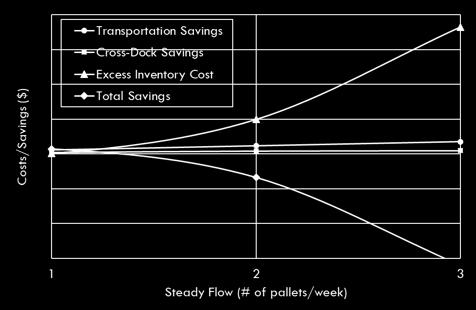
12 Steady Flow Trade-offs Transportation Savings Cross-Dock Savings Costs/Savings ($) Steady Flow (# of pallets/week) Steady Flow Trade-offs Costs/Savings ($) Transportation Savings Cross-Dock Savings Excess Inventory Cost Steady Flow (# of pallets/week) 12
13 Steady Flow Trade-offs Costs/Savings ($) Transportation Savings Cross-Dock Savings Excess Inventory Cost Total Savings Maximum Savings Steady Flow (# of pallets/week) Methodology 1 Forecast Data Historical Data ALL weeks F weeks H weeks Forecast Check Descriptive Statistics 5 % Forecast>0 > X% % weeks shipped > Y% COV < Z% Steady Flow Eligible? 6 No STOP Yes 7 9 Create Optimized Steady Flow Level Maximize {Transportation savings + Cross-dock savings Excess Inv cost} 8 Fixed Truck/IM Capacity Steady Flow SKUs List Quantity 13
 28 % weeks shipped 100% Mean (pallets/week)")

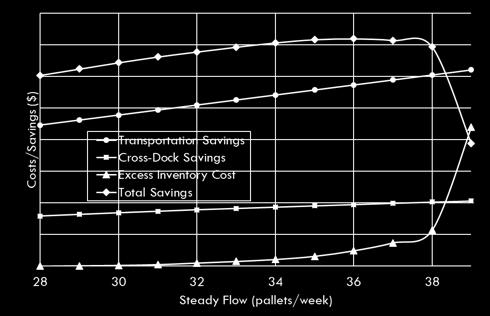
14 SKU Example 1 Demand Characteristics Minimum (pallets/week) 28 % weeks shipped 100% Mean (pallets/week) 37.7 COV 0.13 Std Dev (pallets/week) 4.80 Moderate Volume, Stable SKU SKU Example 1 Demand Characteristics Minimum (pallets/week) 28 % weeks shipped 100% Mean (pallets/week) 37.7 COV 0.13 Std Dev (pallets/week) 4.80 Moderate Volume, Stable SKU 14
 9 % weeks shipped 100% Mean")
 16.")
15 SKU Example 2 Demand Characteristics Minimum (pallets/week) 9 % weeks shipped 100% Mean (pallets/week) 27.9 COV 0.60 Std Dev (pallets/week) 16.7 High COV SKU SKU Example 2 Demand Characteristics Minimum (pallets/week) 9 % weeks shipped 100% Mean (pallets/week) 27.9 COV 0.60 Std Dev (pallets/week) 16.7 High COV SKU 15

 2.3 COV 0.")

16 SKU Example 3 Demand Characteristics Minimum (pallets/week) 1 % weeks shipped 87% Mean (pallets/week) 2.3 COV 0.52 Std Dev (pallets/week) 1.20 Low Volume, Not Shipped Every Week SKU Example 3 Demand Characteristics Minimum (pallets/week) 1 % weeks shipped 87% Mean (pallets/week) 2.3 COV 0.52 Std Dev (pallets/week) 1.20 Low Volume, Not Shipped Every Week 16


17 Implications Transportation Savings Identifying the steady movers has benefits beyond just transportation stability. Allows for manufacturing and crossdocking improvements. Contract Innovation Safety Stock Reduction Steady Flow Replenishment Cycle Time Reduction Bullwhip Dampening Cross-dock Productivity Global Ocean Transportation Reliability 34 17
18 Lead / Transit Time Reliability Key Questions: n What is the definition of reliability within a firm? n What are the sources of unreliability/variability? n How can the current situation be improved? Two Dimensions of Reliability n Credibility n Schedule Consistency Material adapted from Arntzen, B. (2011) Global Ocean Transportation Project, Internal (CTL) Report. Observations from Practice Contract reliability in procurement and operations do not always match Worse than contract Mean actual transit time Better than contract 45 line Estimated transit time Contracted transit time Material adapted from Caplice, C and Kalkanci, B. (2011) Managing Global Supply Chains: Building end-to-end Reliability, Internal MIT Center for (CTL) Report. 18


19 Observations from Practice Contract reliability differs dramatically across different route segments Origin port dwell Port-to-port transit time Destination port dwell While accurate estimates of the port-to-port transit times exist, there is only limited information on port dwell times. Observations from Practice Distributions are not always symmetric or uni-modal. 19
20 When should your ERP consider variability? Coefficient of Variation (std dev/median lead-time) ~15% Ignore Better off by ignoring lead-time variability Incorporate Worse off by ignoring lead-time variability ~5% ~80% Critical ratio Handling Today s Variability Use portfolio of transportation solutions n Identify best use of Robust & Flexible options n Determine optimal allocation across the network Segment the product by variability n Identify candidate SKUs for synchromodal flow n Benefits extend beyond just transportation savings Ignore it n Identify when it is worthwhile to invest or not 20
21 Shifting to Tomorrow Variability becomes Uncertainty Freight Transportation Planning is hard. Hard for shippers, Harder for carriers, Hardest for government planners! n Infrastructure planning timeframe is decades n Diverse and vocal constituents (NIMBY, BANANA) n Pallets don t vote n Both modal and jurisdictional silos n Revenue sources are decreasing dramatically n Removed from the system users Recognized by FHWA & NCHRP thus the NCHRP Projects 42 21
22 NCHRP 20-83(1) Project Objectives Two Objectives: n Provide decision makers [state DOTs] with a critical analysis of the driving forces behind high-impact economic changes and business sourcing patterns that may effect the US freight transportation system [in the year 2030 & beyond]. n Better enable informed discussions of national, multi-state, state, and regional freight policy and system investment priorities. Details: n National Academies - Transportation Research Board (TRB) & National Cooperative Highway Research Programs (NCHRP) n First of 7 projects focused on long-range strategic issues n Develop and deliver methodology through 6 workshops 43 Different Methods for Planning Time Planning Horizon But what about very long term (10 to 30+ years) planning? 44 22
## 3.75\" 3.5\" 3.25\" 3\" 2.75\" 2.")
23 Longer term planning is impacted by events Source: Scenarios: An Explorer s Guide, Shell International Poor Forecasting is not a thing of the past " 4.5" 4.25" 4" On#Highway#Diesel#Fuel##($/gallon)## 3.75" 3.5" 3.25" 3" 2.75" 2.5" 2.25" 46 2" Jan+06" Jul+06" Jan+07" Jul+07" Jan+08" Jul+08" Jan+09" Jul+09" Jan+10" Jul+10" Jan+11" Jul+11" Jan+12" Jul+12" Jan+13" Forecast_Jan2008" Forecast_Jan2009" Forecast_Jan2010" Forecast_Jan2011" Forecast_Apr2011" Actual" 23

24 Still not a thing of the past Different Methods for Planning Time Planning Horizon But what about very long term (10 to 30+ years) planning? Shift focus from prediction to preparation 48 24


25 Future Freight Flow Scenarios We created 4 FFF scenarios for November 2, 2037 Running 6 workshops across the US Over 300 shippers, carriers, and government planners Development of Scenario Planning Toolkit for state DOTs Technology Opinions 50 25
26 Technology Trends & Impact Large Impact Small Impact 5 none - ever 1 large-soon 3 small-soon Soon 5 years 2 large-later 4 small-later Later > 5 years Hot Topics Hit List nuber for Freight ndelivery Drones nautonomous Trucks nmobile Computing nadditive Mfg 51 Digital Freight Matching 52 26


27 Uber for X 53 Why not Uber for Freight? 54 27


28 Over $500M invested in these 67 start ups

29 >200 Transportation Electronic Marketplaces existed in 1999, but essentially none survived in their original form. 57 The last time VCs thought freight was sexy... Source: Boyle, Marc (2000) 58 29
30 Most Recent Real Disruption? Deregulation 110.0$ Index of Revenue per Mile for US. Trucking in Real $ 100.0$ 90.0$ 80.0$ 70.0$ 60.0$ 50.0$ 1980$1982$1984$1986$1988$1990$1992$1994$1996$1998$2000$2002$2004$2006$2008$2010$ 59 Does the Uber model fit? What do we do when we uber? 1. Contact a single source through an App 2. Real time visibility of nearby vehicles 3. Matched to one of multiple underlying providers 4. Payment handled off line, estimated in advance 5. Pricing varies based on surging Is Uber just Freight Brokerage for Passengers? 60 30
31 How do the Markets Compare? PAX FRGT Competitive Market Local Monopolies (taxis) Highly Competitive New Capacity Untapped/Part-Time None Business Type C2C B2B Service Types Limited Unlimited Frequency of Use Occasional Repetitive Planning Lead Time 0 min 1-3 Days Length of Haul Very Short (~6 miles) Much Longer (500 miles +) Loading Time ~ 30 seconds >1 hour Asset/Driver Type Personal Vehicle Commercial Vehicle Transportation Portfolio Continuum Different network segments require different relationships Segmentation of network and carriers by needs Continuum from one-off transactions to ownership n Ownership of Assets versus Control of Assets n Responsibility for utilization n On-going commitment / responsibilities n Shared Risk/Reward Flexible contracts Spot Market Alternate Carriers Core Carriers Dedicated Fleet Private Fleet Use for random & distressed traffic Use for most reliable and steady flows 31
32 Proposed value to better matching Improved vehicle utilization n Estimates in US 10%-30% empty miles n Differs by length of haul & carrier size Reduced transactional inefficiencies (friction) n Streamline matching, payment, notification, visibility, etc. n Does visibility of nearby trucks add value to a shipper? 63 My Take-Aways on Uber for Freight Most start ups in this space hate the name! Some start ups do have have improved functionality... n Evolutionary more than revolutionary, n Serving to increase customer expectations, but n Worthwhile functionality is being incorporated within TMS or brokers. Demise of brokers has been greatly exaggerated (again) n Middleman s role is growing, not being diminished n Promised two party transactions are really three party n Potential consolidation in brokerage space strong economies of scale Area for fit: Local real-time, on-demand delivery 64 32
33 Begs a bigger question... Transportation Rate ($/mile) Contract Rate Spot Rate If spot market was totally liquid and reliable, would it lead to the end of annual contracts? time 65 Delivery Drones 66 33

34 Trend: Delivery Drones What is it? An unmanned aircraft that can navigate autonomously, without direct human control or is guided remotely. Initially used in military operations in 2000 Commercial use now common in filming, disaster management, search & rescue, geographic mapping, precision agriculture, wildlife monitoring, etc. What is status today? Drone Deliveries Have Already Happened On Dec , Amazon Prime delivered an Amazon Fire TV and a bag of popcorn by drone to a man near Cambridge, UK. Flirtey and 7-Eleven delivered a chicken sandwich, donuts, candy, Slurpees and hot coffee via drone in July 2016 in Reno NV. Countries have varied restrictions December 2016 Connect Robotics delivered food for an old men in the mountains of Portugal. Commercial Drones Market size ~$550M in 2014 and forecast to $1B in 5 years Sales grew >200% last 2 years with > 2.5M in use in US Photo by By Eduardofamendes (Own work) [CC BY-SA 4.0 ( via Wikimedia Commons 67 Trend: Delivery Drones Direct Impact: Able to send small loads to remote locations quickly Expands delivery capabilities using open air without using existing infrastructure Essentially a new transportation mode for very fast replenishment of very small shipment size over a close distance. Potential Longer Term Indirect Impacts Amazon was awarded a patent for an "airborne fulfillment center" which essentially is blimp with a fleet of drones for delivery. Will complement (but not replace) existing last mile delivery techniques will find a niche with most delivery companies Provide ultra-fast replenishment for high end items Large Impact Small Impact 5 none - ever 1 2 large-soon large-later 3 small-soon Soon 5 years 4 small-later Later > 5 years 68 34
 Function-Specific Automation (Level 1) Combined-Function Automation (Level 2) Limited Self-Driving Automation (Level 3) Full Self-Driving")
35 Autonomous Trucks 69 Trend: Autonomous Trucks & Vehicles What is it? Trucks and other vehicles that can operate with minimal (or no) human interaction. Established Levels of Automation No Automation (Level 0) Function-Specific Automation (Level 1) Combined-Function Automation (Level 2) Limited Self-Driving Automation (Level 3) Full Self-Driving Automation (Level 4) What is status today? Autonomous Delivery Already Happened First paid autonomous delivery occurred in Colorado in October Otto delivered full TL of beer Major investments in technology Uber acquired Otto in 2016 for $680M Intel acquired Mobileye in 2017 for $15B Where can it be used? Linehaul Corridors Local delivery Intra-Yard Photo by Steve Jurvetson [CC BY 2.0 ( via Wikimedia Commons 70 35
 5 none - ever Large Impact 1 2 large-soon large-later Small Impact 3 4 small-soon small-later Soon 5 years Later > 5 years Potential Longer Term Indirect Impacts Reduction in number of")
36 71 Trend: Autonomous Trucks Direct Impact: Single day range of trucks could double (~1000 miles) Lower fuel costs due to lower speeds Ubiquity of truckload is combined with low cost of intermodal (truck-rail) 5 none - ever Large Impact 1 2 large-soon large-later Small Impact 3 4 small-soon small-later Soon 5 years Later > 5 years Potential Longer Term Indirect Impacts Reduction in number of distribution centers and thus lower overall inventory levels Concentrated corridor traffic with terminals for local driving for last mile Dissolution of TL carriers to independent driving entities Large job loss in long-haul trucking 72 36
?")
37 Mobile Computing 73 Trend: Mobile Computing What is it? Technology that allows transmission of data, voice and video via a computer or any other wireless enabled device without having to be connected to a fixed physical link. What is status today (2016)? Mobile data traffic has grown 18-fold over the past 5 years 8 billion mobile devices (325 million wearable devices) currently in use Average smartphone usage grew 38% in 2016 with the Middle East and Africa showing 65% CAGR in mobile data traffic growth (most anywhere!) Smartphones are used as phones less than 3% of the time Online shopping behavior differs by platform: laptops & tablets vs. smartphones 37
38 Trend: Mobile Computing Direct Impact: Able to access data and systems from anywhere Enables new paradigms of shopping and thus retail supply chains (omnichannel) Potential Longer Term Indirect Impacts Transformation of retail shopping industry and experience Complete shift to Cloud computing for enterprise and other applications Decentralize operations for many processes Large Impact Small Impact 5 none - ever 1 2 large-soon large-later 3 small-soon Soon 5 years 4 small-later Later > 5 years 75 What other trends or technologies??? 5 none - ever Large Impact 1 large-soon 2 large-later Small Impact 3 small-soon Soon 5 years 4 small-later Later > 5 years 76 38

39 Key Take-Aways Handling Variability Today nmanage a complete transportation portfolio nsegment out stable flow through supply chain nunderstand when not to bother Preparing for Uncertainty for Tomorrow nfocus on preparation rather than prediction ninvolve larger group on scenario planning 77 Wilson & Dexter disrupting the dominant design daily Yankee Golden Retriever Rescued Dogs (