2015 HDR, all rights reserved.
|
|
|
- Merryl Berry
- 5 years ago
- Views:
Transcription
1 2015 HDR, all rights reserved.


2 How do you Spell Capacity on a Railroad? - A Primer on Railroad Operations Design Kevin Keller, PE HDR Engineering, Inc HDR, all rights reserved.
3 Outline Introduction Basic Rail Capacity Concepts Analytical Models of Railway Capacity Parametric Models Simulation Models Optimization Models Other Considerations and Expansion Strategies 3
4 Suggested Definition of Rail Capacity The maximum number of trains that can be moved between two locations in a day without exceeding a predefined level of service.

5 Fields Related to Capacity Analytics Data mining Network optimization Queuing theory Regression modeling Risk modeling Simulation Utility models 5
6 Elements in Determining Rail Capacity Line Capacity Crew Capacity Yard Capacity Equipment Capacity Line Capacity: number of tracks; type and spacing of control system; number, spacing, and length of sidings; mix of train types; operating and maintenance plans Yard Capacity: total acreage; number of tracks; container storage slots Crew Capacity: available crew starts; yard crews; maintenance crews Equipment Capacity: locomotives; railcars; containers/trailers

7 Physical Track Layout o Number of tracks o Type of signals o Number and spacing of sidings Operating Plan o Schedules o Type of service Train makeup o Number and horsepower of locomotives o Train length and weight Geography o Mountains o Tunnels o Bridges Other Factors Determining Line Capacity
8 Railway Capacity Metrics Amount Moved Reliability Utilization Trains Railcars Gross Tons Revenue Tons Passengers TEUs (Per Year) (Per Day) (Per Hour) (Per Peak Hour) Distribution of Arrival Times Average Delay Standard Deviation of Delay On Time Performance Right Car Right Train Crew Expirations Velocity Terminal Dwell Blocking Time Signal Wake Train Miles/Track Mile Cycle Time Trainsets or Railcars On-Line Track Occupation Train Density 8
 Capacity: Breakdown conditions at maximum train density.")
9 Types of Capacity Practical (Effective) Capacity: Ability to move traffic at an acceptable level of service Economic Capacity: The level of traffic at which the costs of additional traffic outweighs the benefits Engineering Capacity: The maximum amount moved before the system ceases to function Ultimate (Maximum) Capacity: Breakdown conditions at maximum train density. The system has ceased to function and all signals are red 9
10 Transportation firms can never utilize a facility 100% of the time Maintenance Weather Maximum Versus Effective Capacity Peaking of traffic volumes Disruptions and recoverability Normal variability in operational conditions Industry practices call for standards to maintain fluidity of operations and avoid major issues at chokepoints o Useable (effective) capacity is 70% to 80% of the maximum (theoretical) capacity o Utilizing the capacity buffer between effective and maximum capacity results in deferred maintenance, reduced ability to react to variability with increasing recovery time, significant reduction in reliability


11 Increasing Demands on Rail Network Freight Growth Low Cost Transportation Intercity Passenger Trains Reliability Commuter Service Environment Cambridge Systematics. (2007). National Rail Freight Infrastructure Capacity and Investment Study. 11

12 Forecasted Growth of Freight Trains Per Day 2035 Based on US DOT Freight Analysis Framework Source: AAR National Rail Freight Infrastructure Capacity and Investment Study, September 2007.
 All of the above increase")
13 Problems of Capacity Shortages Inability to handle more traffic Decreasing level of service Diminished ability to recover from a disruption Limited windows for track maintenance Increase time in yards, terminals and stations Increase cycle times Increase number of trainsets, rolling stock Increase number of crews (hours of service limitations) All of the above increase costs 13
14 Capacity is an Expensive Resource Railway infrastructure is capital intensive and a long-term investment Capacity lags behind changing demands Capital Investment as a % of Revenue 14


15 Levels of Capacity Analysis Transportation Network o Railroad Network Subdivision or Line Yards & Terminals Stations & Platforms Interlockings & Junctions 15

16 Modeling Rail Capacity Rail Capacity Definition Stringline Diagrams Parametric Models Train Performance Calculators Train Dispatching Simulation

17 Unlike highways, there is no standard railroad capacity model The complex nature of railroad operations and limited research funding has prevented a universal capacity model from being developed Currently several different models are in use 17
18 Levels of Effort in Modeling Rail Capacity Initial Estimation Planning Models Simulation Back of the envelope methods Expert with basic knowledge of number of tracks, type of signals, and special conditions (e.g. mountainous terrain) Useful for quick assessment of a single corridor or facility Variety of methods, requires more data than back of the envelope but less than a full simulation Parametric (statistical based) models stem from 1975 FRA work and the CN model (Krueger, 1999) Paper simulations (now evolved to spreadsheets) are also used for capacity estimation Uses a commercial rail simulation product (RTC, RAILS, FastTrack) Requires precise network layout (tracks, sidings, interlockings, signals, etc.) Requires knowledge of operating plan: trains that will be run and schedules Initial setup is expensive
. An assessment of railway capacity.")
19 Level of Service to Measure Capacity Higher delays correspond to a lower level of service (LOS) Maximum theoretical train volumes are never reached due to deteriorated level of service Acceptable level of service establishes maximum train volume Abril, M., Barber, F., Ingolotti, L., & Salido, M. (2008). An assessment of railway capacity. Transportation Research Part E: Logistics and Transportation Review, 44(5),
20 Delay (mins) Different Traffic and Track Configurations will Change Delay-Volume Relationship Acceptable Delay Volume (Trains/D ay) 20

21 Track Configuration Number of tracks Siding length Siding spacing (distance & time) Crossover spacing o Single crossovers o Universal crossovers o Parallel crossovers Geometry o Grade o Curvature 21
22 Track Attributes Were used to Determine Capacity Type of Control System CTC=Blue, ABS=Green, Manual=Red Number of Tracks Two or More Tracks=Blue, Single Track=Tan Source: Oak Ridge National Labs rail network. Raw data not verified for accuracy.
23 Heterogeneous Operations and Capacity Simple headway and grid models only work when all trains operate at the same speed Actual trains have different o Operating speed o Acceleration and braking characteristics o Priority o Station stopping patterns Particularly apparent where passenger and freight operations share track infrastructure From a capacity perspective: 1 freight train 1 passenger train These differences decrease capacity and require more complicated capacity analysis tools 23
24 Parametric Models Parametric Models are developed from statistical analysis of collected operating or simulation data Key infrastructure and operating parameters are identified to predict a delay-volume curve Attributes include o Average speed o Speed ratio o Priority o Peaking o Siding spacing and uniformity o Percent double track o Signal spacing FRA and CN have well-known parametric models 24
25 Limitations of Parametric Models The Canadian National parametric model is the best known example o It was designed for single track corridors o Does not handle complex track configurations FRA has sponsored research into improving parametric models for more complex track layouts Parametric models are best used for high-level national or regional modeling to identify potential problem areas Detailed capacity analysis is done with simulation
26 Delay (Minutes) CN Parametric Model Example Average Speed 44.4 mph Speed Ratio Priority Peaking Siding Spacing 7.77 miles Uniformity 0.49 Signal Spacing 0.93 % Double Track Volume (Trains per Day) Krueger, H. Parametric Modeling in Rail Capacity Planning. Proceedings of the 1999 Winter Simulation Conference. Phoenix, Web. 21 May
27 Railway Simulation Tools Calculate train movements and make decisions under the same rules as railroad dispatchers Account for different equipment types, train consists, train handling characteristics, terrain and track conditions Common uses of Simulation Tools: o Develop operating plans o Diagnose bottlenecks and recommend schedule changes o Evaluate various capital improvement scenarios o Assess the impact of adding new trains to a network Many simulation models are available depending on the purpose and task of the study 27
28 Types of Simulation Tools Passenger timetable development (passenger) o OpenTrack o Viriato Specify timetable and identify conflicts o RailSYS o RailEval Non-timetable (freight) and resolve conflicts with dispatching logic o Rail Traffic Controller 28

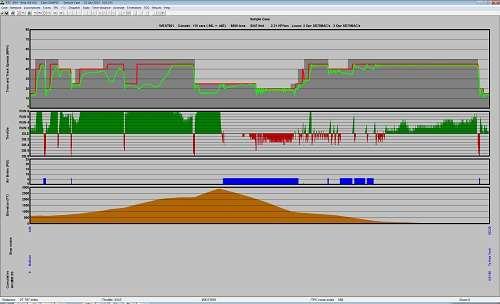
29 Train Dispatching Simulation Types of Outputs Stringline (time-distance plot) User configurable reports TPC profiles Track occupancy charts Animation of simulation

30 Stringlines are a Primary Analytical Tool Used Worldwide Green & Blue = Passenger, Red = Freight, Brown = Locals Software Products Allow: Selecting timeframes, corridors, and trains Building or adjusting schedules by adding and dragging strings

31 Types of Reports Individual train logs" o Scheduled & unscheduled delays In total By train type By location Statistical analyses o Distribution of trip times o Locomotive-miles o Distribution of delays Used to determine if plant is balanced Operating costs Timetables
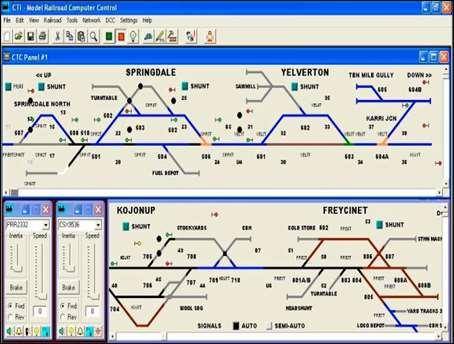
32 Source: Animation of Results


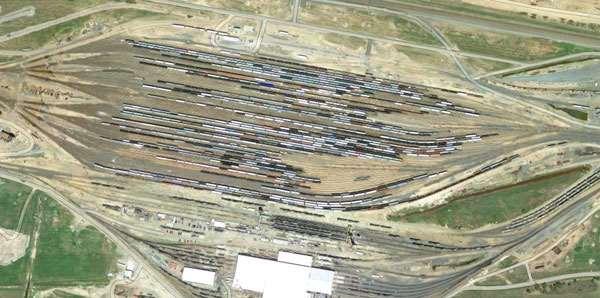
33 Animation of Results Yard with Industrial Leads Source: US DOT Rail Capacity Workshop, 2002.

34 Source: Track Occupancy Chart
35 The Iterative Planning Process Using Computer Modeling o Develop base case traffic Track configuration, signals & other physical attributes Operating plan o Develop alternative scenarios (changes to physical plant or operating plan) o Compare alternative scenario to base, or to other alternative
36 The Iterative Planning Process Using Computer Modeling - 2 o Inject track maintenance and operating failures at critical points, and determine if plant still works. If not, refine plant some more and re-run» First without perturbations» Then with perturbations o Select alternatives that meet operating objectives If none, refine alternatives & re-run Balanced plant is achieved when delays are evenly distributed
37 Limitations of Simulation Models Data and time intensive Must validate to actual Yard operations are modeled separately (hump operations, intermodal lifts, etc.) Resource constraints (crews, locomotives, etc..) are largely ignored Models do not look beyond study area to the rest of the network Even detailed simulation requires simplifying assumptions
38 Optimization Models Identify required system settings to achieve an optimal level of performance Can become computationally complex for large railway networks with multiple train types Example applications o Passenger timetable development o Station platform and track assignment o Rolling stock and crew cycles o Infrastructure investments for running time improvement on shared corridors 38


39 Strategies to Increase Capacity Operations options: o Increase average speed o Reduce traffic peaking o Reduce the variability in speed o Reduce number of meets & passes o Increase length & weight of trains o Improved acceleration and braking o Scheduling Infrastructure options: o Add or lengthen passing sidings o Additional tracks o Add staging and terminal tracks o Add station platforms o Improve junction design o Grade separations 39


40 Other Capacity Factors Mainline capacity consumed by o Local service to freight rail customers o Deadhead and repositioning moves o Passenger boarding delays o Locomotive and rolling stock failures o Track inspection o Track maintenance Difference between practical and engineering capacity 40

41 But at what cost? New passing siding o $8 million and up Second main track o $1 million per mile for rail, ties and ballast o $4-6 million per mile depending on embankment, drainage and signals o Bridges, grade separations and tunnels can quickly increase costs 41

42 Rail Capacity Research Needs Models that capture yard-mainline interaction Predicting the impact of higher speed passenger and freight trains on the same corridor Creating new theoretical & parametric models 42

43 Thank You!
44