OKI Congestion Management System Analysis. Data Collection Report Year 1
|
|
|
- Anis Miles
- 5 years ago
- Views:
Transcription

1 OKI Congestion Management System Analysis Data Collection Report Year 1 May 2002 Prepared by the Ohio-Kentucky-Indiana Regional Council of Governments
2
3 Acknowledgments Title OKI Congestion Management System Analysis: Data Collection Report Year 1 Abstract This interim report documents the methodology and results of data collection in Year 1 of an expected 3-year effort to collect observed travel-time information for the OKI region s Mobility Management Network. The Year 1 data collection covered the entire interstate system within OKI s metropolitan planning area of Boone, Butler, Campbell, Clermont, Hamilton, Kenton and Warren counties. Date May 2002 Agency Project Manager Ohio-Kentucky-Indiana Regional Council of Governments James Q. Duane, Executive Director Dory Montazemi, Deputy Executive Director Robert Koehler, P.E. Project Staff Andrew Reser, Principal Author Andrew Johns, A.I.C.P. The preparation of this document was financed cooperatively by the Federal Highway Administration, the Federal Transit Administration, the Commonwealth of Kentucky Transportation Cabinet, the Ohio Department of Transportation, and the units of local and county government in the OKI region. The opinions, findings, and conclusions expressed in this document are those of the OKI Regional Council of Governments and are not necessarily those of the U.S. Department of Transportation. This report does not constitute a standard, specification, or regulation.
4
5 Congestion Management System Analysis Data Collection Report Table of Contents 1. Introduction Definition of Congestion... 1 a. National Perspectives on Congestion Goals and Objectives Mobility Monitoring Network Performance Measures... 4 a. V/C ratio, speed and delay Data Collection and Monitoring... 7 a. Methodology... 7 b. Progress to date Regional Analysis... 8 a. Speed and Delay on Interstates List of Figures and Tables Figure 1: OKI Mobility Management Network... 5 Table 1: Mobility Management Network Corridors and Facilities... 9 Figure 2: Mobility Management Network by Data Collection Year Table 2: AM Delay per Vehicle Table 3: Mid-Day Delay per Vehicle Table 4: PM Delay per Vehicle Table 5: Total Daily Vehicle Delay Figure 3: 10 Most Congested Interstate Segments by Total Vehicle Delay Table 6: TIP/Plan Projects for 10 Most Congested Segments Table 7: Delay by Segment APPENDIX: Travel Time Data-Entry Spreadsheets
6
7 1. Introduction Congestion Management System Analysis OKI Regional Council of Governments May 2002 The Intermodal Surface Transportation Efficiency Act of 1991 required the integration of a Congestion Management System into the metropolitan transportation planning process. In 1998, ISTEA s successor, the Transportation Efficiency Act for the 21 st Century (TEA-21), emphasized the importance of CMS as a way to improve the efficiency of, and protect the public investment in the nation s transportation infrastructure. The CMS is a systematic process that provides information on transportation system performance and alternative strategies to alleviate congestion and enhance the mobility of persons and goods. A CMS includes methods to monitor and evaluate performance, identify alternative actions, assess and implement cost-effective actions, and evaluate the effectiveness of implemented actions. OKI defined the methods of CMS implementation in the 1995 report OKI Mobility Management Program (MMP): Manual of Practice. This report is an update to the 1995 MMP report. It provides results from a recent data collection effort involving the regions interstate highways and clarifies how OKI will keep CMS as an ongoing part of the planning and programming process. 2. Definition of Congestion Congestion is the level at which transportation system performance is no longer acceptable due to traffic interference. The level of acceptable system performance will vary by type of transportation facility, location within the region and time of day. The level of acceptable system performance depends upon transportation and development goals for the region and reflects public perception of traffic interference. National Perspectives on Congestion Congestion in the OKI region can be viewed in a national context to see how we stand compared to other major metropolitan areas in the United States. The Texas Transportation Institute (TTI) has been documenting the growth of congestion levels in 68 of the nation s urban areas since the 1980 s. Their mission has been to document mobility trends and highlight numerous issues associated with roadway congestion. 1
8 In their most recent report 1, TTI used data from federal, state and local agencies to develop estimates of mobility levels in the urban areas. TTI primarily used the Federal Highway Administration s Performance Monitoring System (HPMS) database as a source with additional information and guidance supplied by states and localities. The report contains several interesting mobility statistics through 1999 for the Cincinnati area: Cincinnati is the 24 th most congested city in the US. It takes 26% longer to make a trip during peak times rather than other times of the day. A Cincinnatian is delayed 32 hours a year. Since 1982, Cincinnati has experienced a 22% increase in travel time during peak periods. Since 1982, annual hours of delay have increased 700%. The annual cost in delay and fuel in 1999 due to congestion was $735 million dollars or $575 per person. The TTI study reflects the average condition of roadways in the entire urban area, not specific facilities and locations. Two other studies attempted to better pinpoint congestion problems within urban areas. The American Highway Users Alliance recently conducted a national analysis 2 of highway bottlenecks causing significant delays and backups at specific points in major metropolitan areas. By their methodology, bottlenecks in the OKI region occurred along Interstate 71, 75 and I-275. In 2000, the Ohio Department of Transportation s (ODOT) Division of Planning conducted its own analysis of the worst congested locations in Ohio 3. Three of the Top 10 were in the OKI region. They included: I-75 between Cincinnati-Dayton Road and I-74 (Rank 1). I-275 between State Route 747 and Mosteller Road (Rank 4) I-75 between State Route 264 and I-74 (Rank 10) In addition, two other freeway locations within the OKI region were mentioned: I-71 between Stewart and Kenwood I-275 between State Route 4 and State Route 747 While providing a good comparison of the region s congestion versus other urban areas throughout the country and Ohio, these three studies do not provide a 1 The 2001 Urban Mobility Report, Texas Transportation Institute, Texas A&M University, May, Available: 2 Unclogging America s Arteries: Prescriptions for Healthier Highways, American Highway Users Alliance, November Available: 3 Traffic Efficiency and Flow Study, Ohio Department of Transportation, Division of Planning, March Available: 2
9 comprehensive and systematic review of our region s transportation system. This effort will provide a level of analysis that allows for more informed decisionmaking in the transportation planning process. 3. Goals and Objectives Goals: Monitor and evaluate transportation system performance Develop strategies, including multimodal alternatives, to facilitate the mobility of people and goods within the region. Manage congestion, reducing its incidence in corridors where reduced travel time is deemed to be desirable. Reinforce the region s transportation goals and objectives as adopted by OKI in its 2030 Regional Transportation Plan. Objectives: Contribute to the process of transportation decision-making and policy-making by providing information on the performance of the transportation system. Evaluate demand management strategies providing alternatives to single-occupancy vehicle travel, including the following, and to promote such strategies where appropriate: o Improved transit service o Public rideshare programs o Congestion pricing o Telecommuting o High Occupancy Vehicle (HOV) lanes o Parking management o Alternative work schedules o Trip reduction program o Growth management Consider operational management strategies for existing or new roadway facilities, including the following, and to promote such strategies where appropriate: o Traffic signal improvements o Intersection/geometric improvements o Elimination of bottlenecks o Expansion of ARTIMIS which includes incident management Consider capital intensive improvements, including the following, and to promote such strategies where appropriate: o Lane additions o New SOV facilities o Transit capital improvements 3
10 4. Mobility Monitoring Network The 1995 report, OKI Regional Council of Governments Mobility Management Program Manual of Practice, outlines OKI s effort in carrying out mobility analysis. The focus of the Mobility Management Program is on the movement of people and goods over freeways, principal arterials, fixed guideway transit lines, and other transportation facilities. These segments serve as the backbone to the region s transportation network, and provide connectivity among the region s transportation facilities, intermodal facilities, and activity centers. OKI selected the facilities comprising the region s Mobility Management Network according to several key factors. The network must be extensive enough to allow for the identification of both existing and potential recurring congestion. Network continuity is important to ensure that the network structure is rational. Where the network crosses state boundaries, it is important to maintain consistency in the management of mobility. All elements of existing and potential significance to state or metropolitan area travel are included in the network. The OKI Mobility Management Network (Figure 1) is comprised of all facilities on the National Highway System (NHS) along with major roadways and all other routes determined to be essential to regional mobility and continuity. The network consists of 1,525 miles and carries 78% of regional traffic. 5. Performance Measures Performance measures are parameters that provide the basis for measuring the level of mobility, and identifying the extent, severity, and locations of congestion on the regional transportation system. This information can be used to track changes in mobility over time, identify subareas or corridors with mobility problems, and identify causes of potential hindrances to mobility. It will also provide information to decision-makers and the public as part of the transportation improvement project selection process. As transportation improvements and strategies are implemented over time, these measures serve to permit the evaluation of the effectiveness of mobility enhancement strategies for the movement of people and goods. A number of variables are available as potential measures of mobility. Among the measures available are: Level of service (LOS); Volume/capacity ratio (V/C); Speed; Delay; Distance traveled (VMT or PMT); 4
11 4 741 Figure 1 Regional Mobility Management Network BYP DEARBORN CO BUTLER CO. 126 HAMILTON CO Cross County Hwy WARREN CO. CLERMONT CO OHIO INDIANA KENTUCKY OHIO RIVER BOONE CO. KENTON CO AA HWY CAMPBELL CO NHS Roads Other Major Roads NORTH Scale in Miles OKI
12 Trip-based measure; Combination of speed and distance traveled (i.e., % PMT by speed range) An appropriate performance measure would be: Cleary understood; Sensitive to modes; Sensitive to time-of-day (e.g., spreading of peak period); Not too difficult or costly to collect; Able to be forecast into the future; Sensitive to the impact of congestion mitigation strategies (on people and/or goods). On the basis of these criteria, speed and delay were selected as the primary performance measures to be used for congestion monitoring. V/C ratio will be used as an initial screening in order to identify road segments where congestion has not historically been encountered. V/C ratio This performance measure is derived from OKI s Travel Demand Model. The model has been calibrated to observed traffic volumes. As part of the model validation performed in 2000, modeled traffic volumes matched well with traffic counts, with an overall 4.25 percent error. OKI staff, as part of the model validation, reviewed VMT and congestion statistics. Results compared favorably with local knowledge of the system and congested locations. For the calibration, OKI used 3815 traffic counts collected through 1997 by the Ohio Department of Transportation (ODOT), The Kentucky Transportation Cabinet, many county and local governments, transportation engineering consultants, and OKI. These traffic counts cover 61 percent of the links in OKI s modeling network. Roadway capacity is based on the FHWA s Highway Capacity Manual. Speed This performance measure utilizes travel time. The length of time it takes to get from point to point may be perceived by the traveling public to be the most significant factor in evaluating congestion. Travel time can be compared to a base year, and data can be collected by time of day to distinguish peak from offpeak hours. Delay This measure of congestion can include waiting time at signals, as well as delay caused by high traffic volume to capacity. Actual travel times are measured and compared to optimum travel times at free-flow speeds from the OKI Travel Demand Model. Model free-flow speeds are based on procedures in the FHWA s 6
13 Highway Capacity Manual with consideration for physical and operational characteristics of each roadway operating at low volume. Both delay per vehicle and total vehicle delay are used in this study. Total vehicle delay is calculated by multiplying the delay per vehicle times the volume of vehicles. Volume is based on recent traffic count information and the model. Delay due to incidents or construction activities is not considered. 6. Data collection and monitoring Methodology Speed and delay can be calculated using time, distance and volume data. Data collection for the MMN consists of travel time measurements taken between key intersections during three time periods; AM peak (7-9 a.m.), PM peak (4-6 p.m.) and mid-day (10 a.m. 3:30 p.m.) hours. Two travel time measurements per time period are taken on two different days for a total of 6 measurements. Key intersections or interchanges for each route are determined prior to the travel time measurements and entered into a spreadsheet. Travel time measurements are then taken on days that are representative of typical travel conditions. This excludes the summer high travel season, weekends, holidays, Fridays, and periods of adverse weather. In addition, facilities undergoing construction activities that limit capacity will be avoided. Drivers carry the spreadsheet list of key intersections and a dash-mounted digital voice recorder. At each key intersection, the intersection name is then entered into the voice recorder. The voice recorder automatically records the time. At the office, the time information is entered into the spreadsheet. The spreadsheet calculates travel time and speed information along each section (between intersections). The regional network is divided into 23 discrete corridors for speed and delay runs. A list of the corridors and the primary and associated facilities included in each corridor are shown in Table 1. Figure 2 shows the MMN by data collection year. The network is divided into thirds, to allow for data collection of the entire network every three years, coinciding with OKI adoption of a new regional transportation plan. Plan adoption is required every three years. Year 1 data collection includes all interstate facilities in the transportation planning area (excludes Dearborn County). Year 2 data collection covers eastern Hamilton County, Clermont County and Warren County. Data for Northern Kentucky, Butler County and western Hamilton County will be collected in Year 3. Progress to date Data collection on the region s interstates is now complete. This represents 221 miles or 15% of the MMN. Because of the interstates vital importance for the movement of both people and freight, travel times were collected for the entire regional interstate system. V/C ratios from the OKI Travel Demand Model will be 7
14 used in Years 2 and 3 to exclude or reduce the sampling of free-flowing portions of the facilities from more time-intensive travel time collection. 7. Regional Analysis Facilities are divided into logical segments corresponding to the intersection of other major MMN facilities and state line boundaries. Average speed, delay per vehicle and total vehicle delay have been calculated at the segment level for each facility. The reason for reporting the performance measures at the segment level is two-fold. First, the travel times were recorded in minutes only, resulting in significant rounding errors when reporting at the section level. Second, it is more easily understood in the context of reporting regional travel deficiencies. The more detailed section-level data is included as part of Appendix A. A schematic diagram of the geographic hierarchy of units contained in this report is provided below. Geographic Unit (Example) Corridor (Northern) Facility/Route (I-75) Direction (NB) Segment (from I-275 to SR-129) Section (from I-275 to Union Centre Blvd) Table 1 lists the MMN corridors with their primary and associated facilities. These corridors are displayed graphically in Figure 2. Facilities outlined in red were part of this Year 1 data collection effort. Travel-time data in Year 2 will be collected for the facilities outlined in green. Data for those facilities in yellow will be collected in Year 3. 8
15
16
17
18
19
20 Figure 2 Regional Mobility Management Network (by data collection year) BYP BYP DEARBORN CO BUTLER CO. HAMILTON CO WARREN CO CLERMONT CO INDIANA KENTUCKY 20 OHIO OHIO RIVER Year 1 Year 2 Year BOONE CO. KENTON CO CAMPBELL CO NORTH Scale in Miles OKI
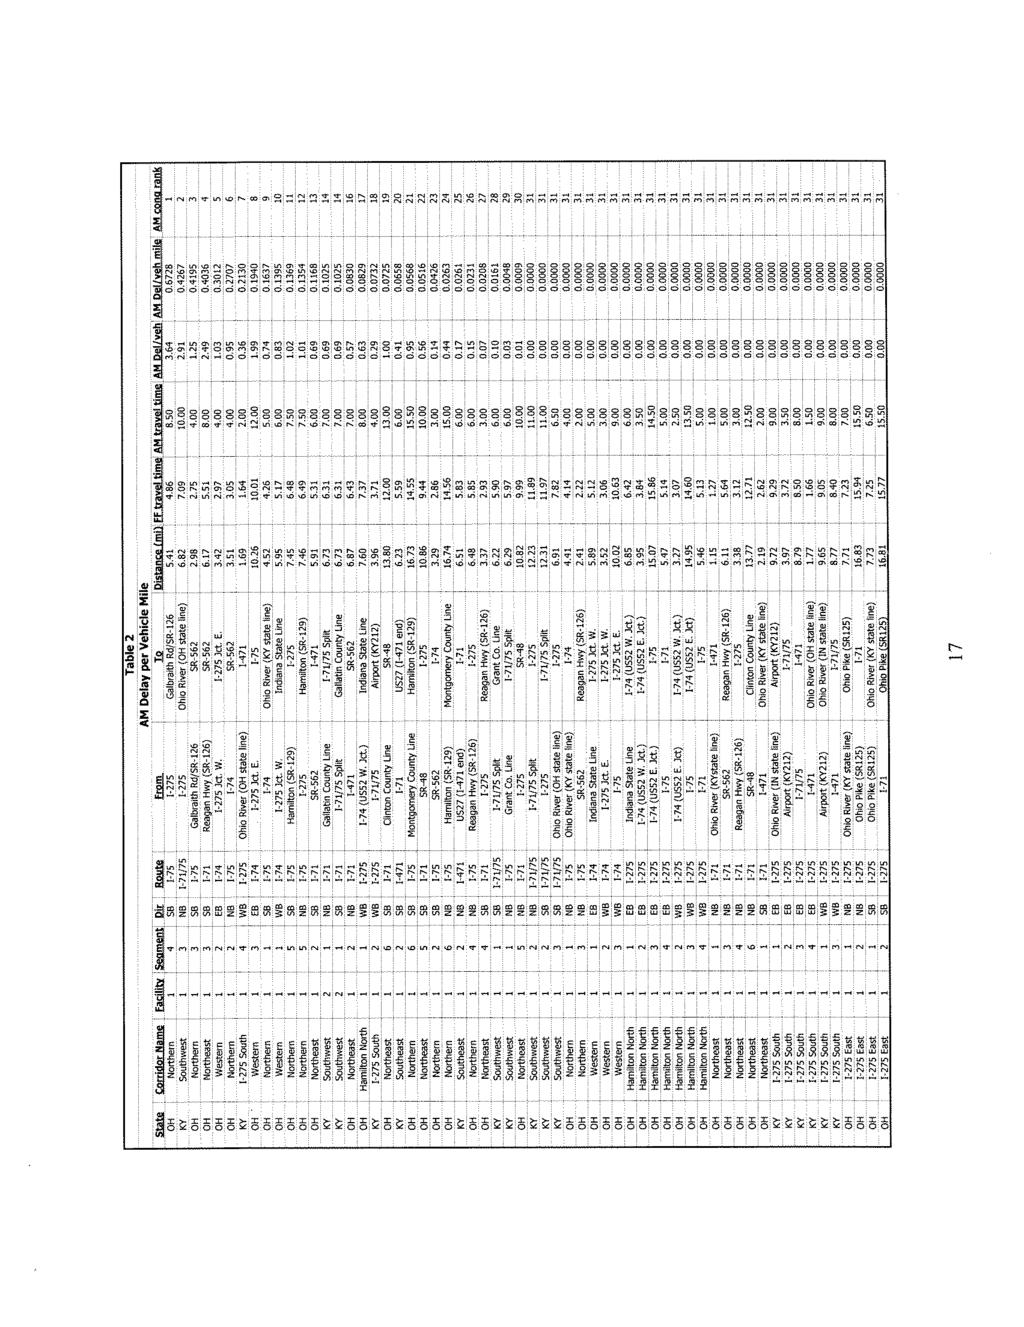
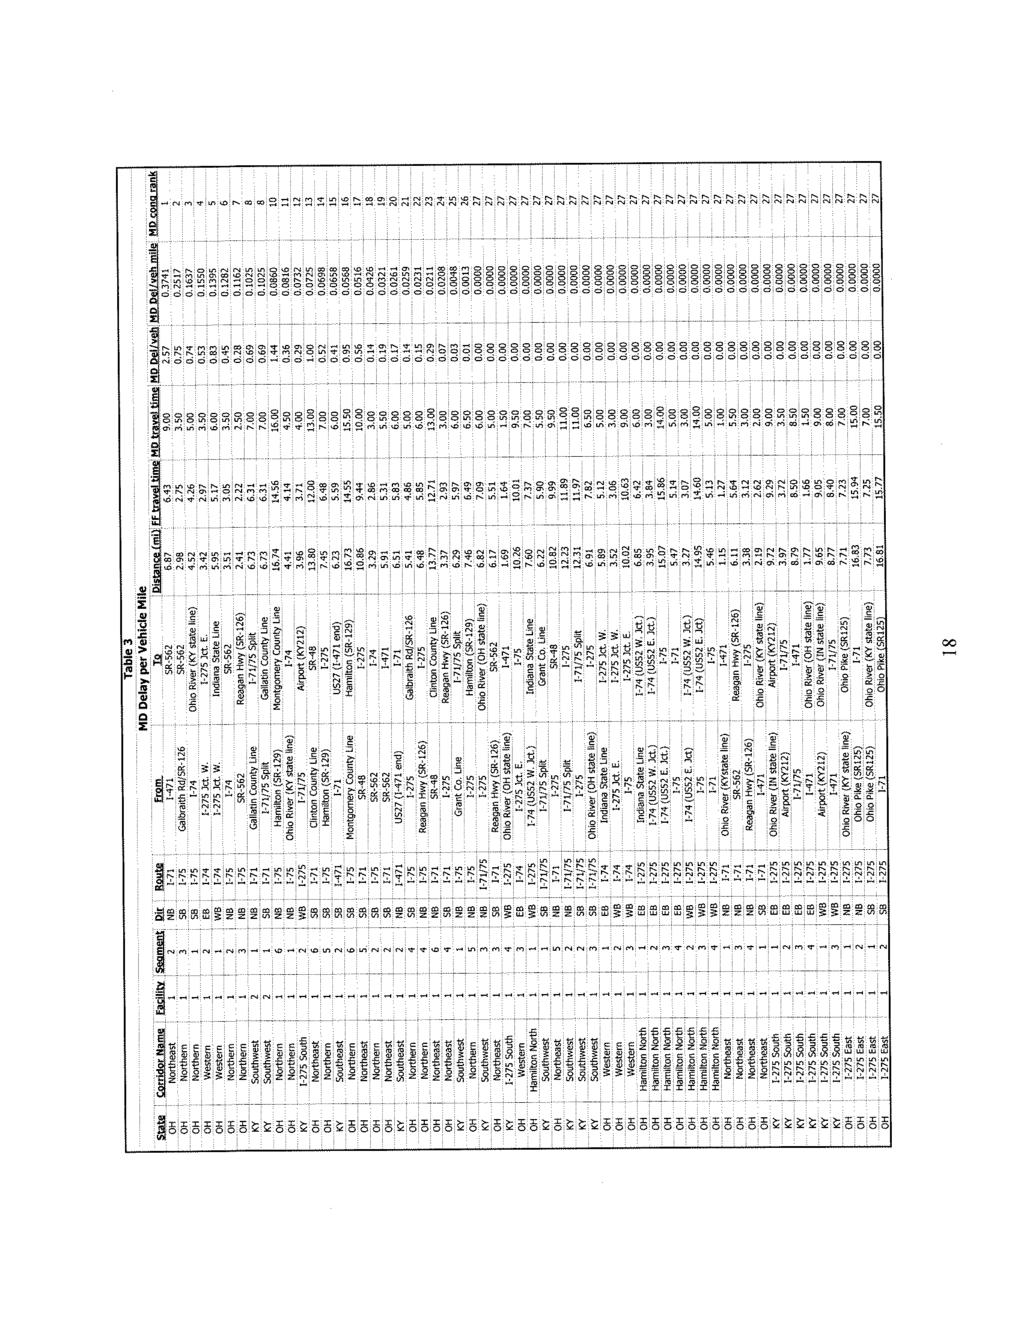
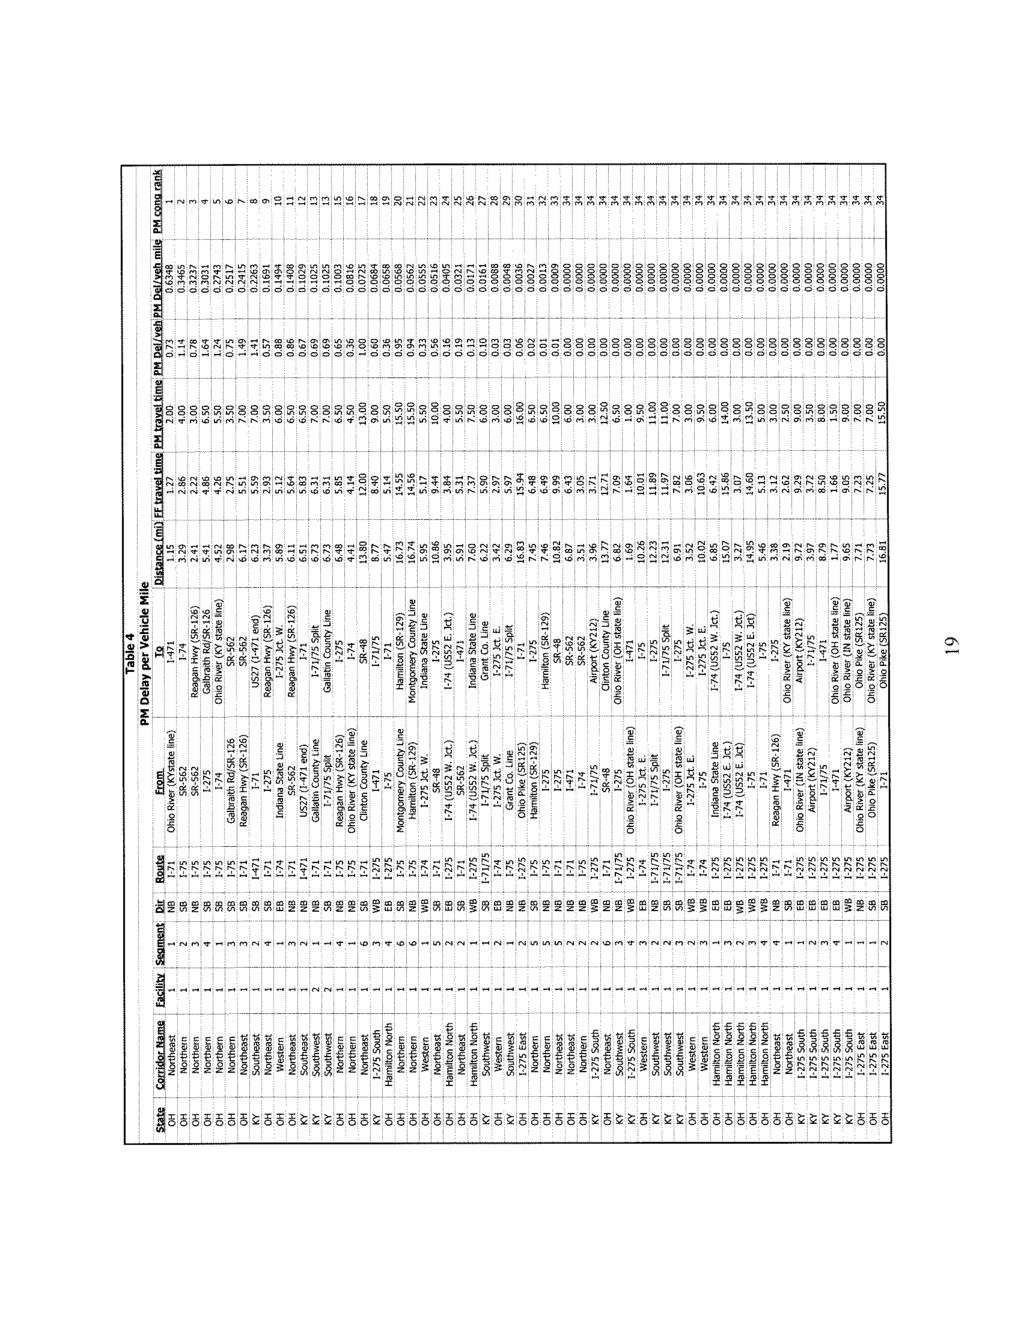
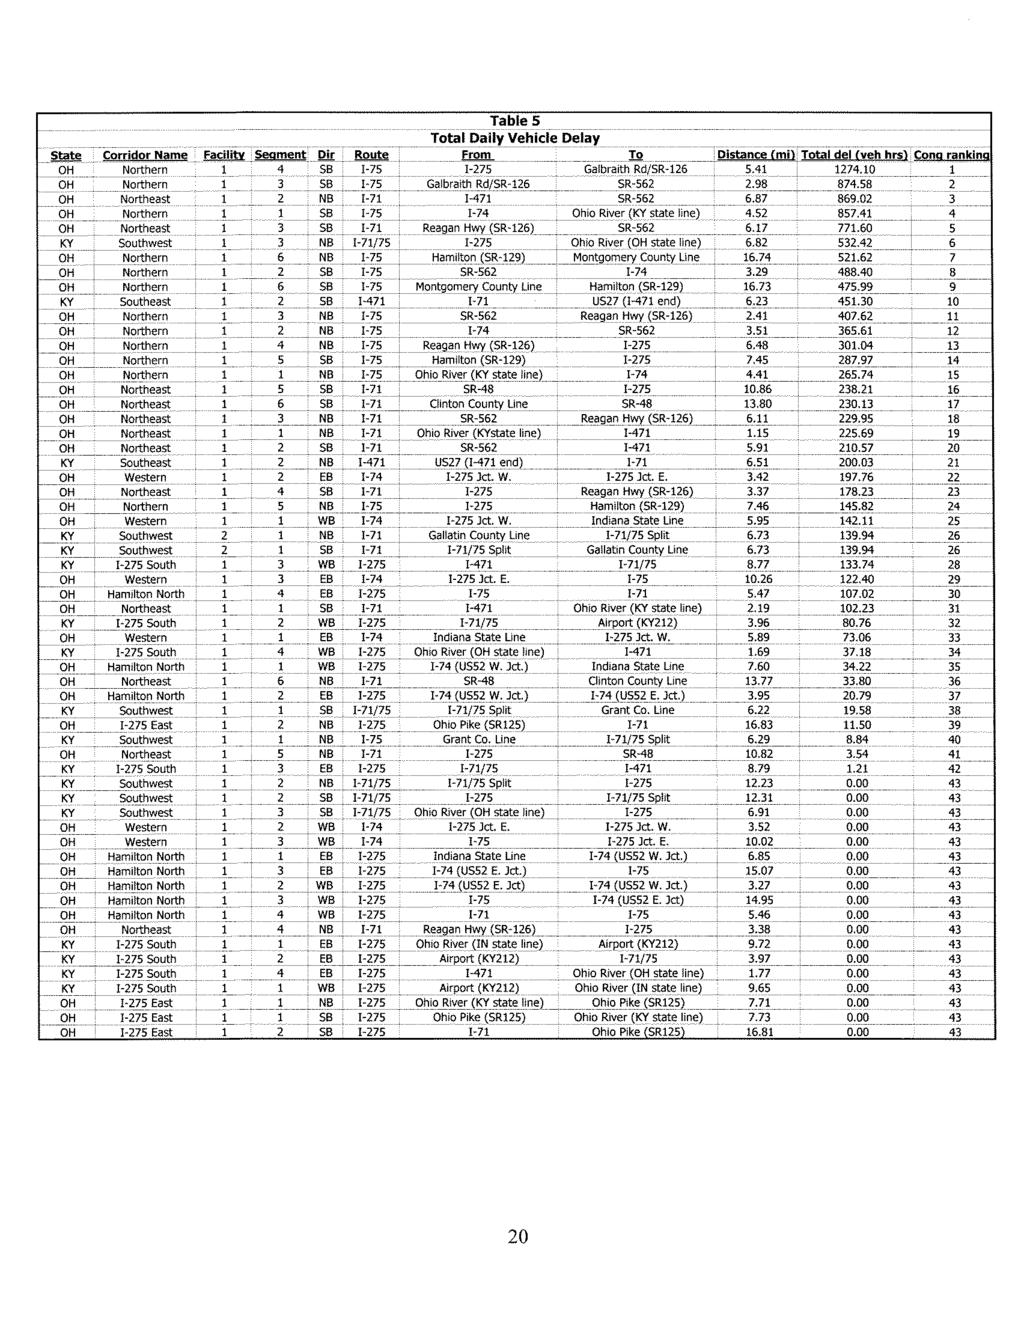
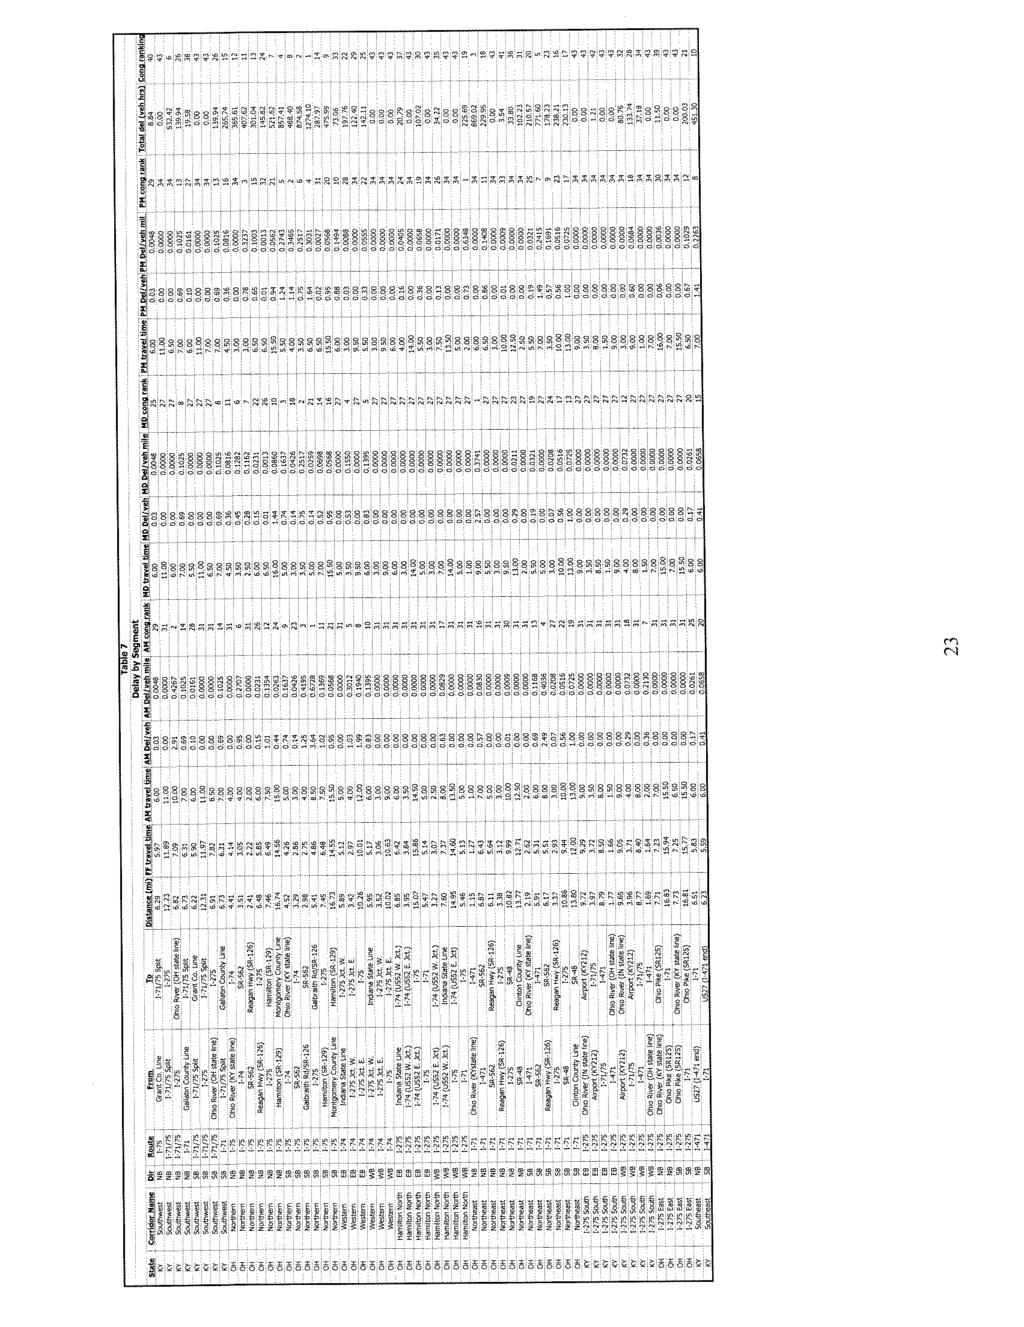
21 Speed and Delay on Interstates Tables 2, 3 and 4 show the AM, mid-day, and PM ranking by delay per vehicle per mile for all 58 directional segments included in the Year 1 data collection effort. The segments are ranked from most total vehicle delay (ranked #1) to least total vehicle delay. 17 segments had no vehicle delay due to congestion in any of the three time periods. Table 5 consolidates data from Tables 2, 3, and 4 and shows total vehicle delay due to congestion. I-75 southbound from I-275 to Galbraith Rd/SR-126 had 5968 hours of vehicle delay, ranking it as the most congested segment. Figure 3 compares total vehicle delay on the 10 most congested segments. Table 6 lists transportation projects and studies planned or underway along the 10 most congested segments. The projects listed in Table 6 are either committed projects and studies in OKI s Transportation Improvement Program or recommended as part of OKI s 2030 Regional Transportation Plan. The following section details the data definitions and sources used in this analysis: Distance units: miles source: OKI geographic information system, street centerline file Free-flow travel time units: minutes source: Calculated by the formula distance/(free-flow speed/60). Free-flow speed is from the OKI travel demand model and is calculated based on methodologies in the FHWA Highway Capacity Manual. In some cases freeflow travel time is greater than the observed travel time. This may be caused by the travel time being recorded in whole minutes or occasional inaccuracies in the link-level model assumptions used to calculate free-flow travel time. AM travel time units: minutes source: Observed weekday travel time, measured during the period of 6:30 a.m. to 9:00 a.m. Travel time was recorded in whole minutes. MD travel time units: minutes source: Observed weekday travel time, measured during the period of 10:00 a.m. to 3:00 p.m. Travel time was recorded in whole minutes. PM travel time units: minutes source: Observed weekday travel time, measured during the period of 4:00 p.m. to 6:00 p.m. Travel time was recorded in whole minutes. Delay per vehicle units: minutes source: Calculated by subtracting free-flow travel time from observed travel time. If free-flow travel time is greater than observed travel time, delay per vehicle is 0. (Assumes all vehicles are affected equally) 15
22 Delay per vehicle mile units: minutes source: Calculated by dividing delay per vehicle by the distance. AM/MD/or PM Congestion rank source: Sorted position of segments based on delay per vehicle mile. Total daily delay (Table 5) units: hours source: Calculated by multiplying the delay per vehicle of each time period by the estimated volume during that time period and summing across all three periods. For every facility evaluated, 2- way average annual daily traffic (AADT) was available for the majority of the links. The traffic volumes were divided by two in order to estimate directional AADT. The traffic volumes were not always collected in the same year. The collection year for traffic volumes ranged from 1996 to The most recent traffic volume available was always used. Where no traffic volumes were available, base year output from OKI s Travel Demand Model was used. Traffic volumes were multiplied by the proportion of travel by time period. The proportion of travel by time period is estimated from OKI s 1995 Travel Survey. The proportions of travel by time period are; 17% during AM Peak, 33% during Mid-day peak, and 30% during PM peak. Although it is felt that the data collected and presented in the tables and graphics are accurate and useful, users of the information should be aware of the shortcomings. The user should note how the traffic volume and travel time information was collected and should also be aware that the traffic volumes and travel time represent only typical weekday peak period travel. To get a statistically valid (i.e., high confidence interval) set of data, approximately 30 to 40 runs per peak hour per direction should have been performed. Because of time and budget constraints, this many travel time runs were not possible. Although the rankings only deal with AM, mid-day and PM hours during the weekday, many of our region s roadways experience congestion at other times of the day. Several roadways may have their greatest congestion during the weekends (near shopping and amusement centers) or during special events (ball games, concerts, and other events). 16
23
24
25
26
27 Figure I-75 SB, I-275 to Galbraith Rd/SR I-75 SB, Galbraith Rd/SR-126 to SR-562 I-71 NB, I-471 to SR-562 I-75 SB, I-74 to Ohio River (KY state line) I-71 SB, Reagan Hwy(SR-126) to SR-562 I-71/75 NB, I-275 to Ohio River (OH state line) I-75 NB, Hamilton(SR-129) to Montgomery County Line I-75 SB, SR-562 to I-74 I-471 SB, Ohio River (OH state line) to US27 (I-471 end) I-75 SB, Montgomery County Line to Hamilton(SR-129) Total Vehicle Hours of Delay 2002 Observed Conditions OKI 5/8/02
28
29
30
31
32
33
34
35
36
37
38
39
40
41
42
43
44
45
46
47
48
49
50
51