Appendix E. Congestion Management Process. Congestion Management Process
|
|
|
- Rodger Chambers
- 5 years ago
- Views:
Transcription
1 November 2017 Appendix E Congestion Management Process Maintenance of a Congestion Management Process (CMP) is a requirement for all Metropolitan Planning Organizations (MPOs) in Transportation Management Areas (TMAs) under federal law. Consistent with the guidance from the Final Rule on the CMP, the intent of the CMP is to address congestion management through a process that provides for safe and effective integrated management and operation of the multimodal transportation system. A vibrant congestion management process can serve a valuable role in addressing the region s transportation needs in light of the following: Funding levels limit the number of new large scale projects which can be planned and constructed. Transportation safety is becoming an increasingly important planning consideration. The primary agency responsible for these planning activities is the (GPATS). Typically, the Congestion Management Process Policy and Procedures Handbook needs to be updated every five years concurrent with or following the development of the GPATS Long-Range Transportation Plan, which is also updated on a five-year cycle. The current iteration of the CMP is being prepared in conjunction with the development of the Horizon2040 Long-Range Transportation Plan. This GPATS Congestion Management Process Policy and Procedures Handbook addresses the following requirements: Establishes the initial Congestion Management Process for GPATS Metropolitan Planning Area Boundary. Addresses changes in Federal Transportation Legislation resulting from the passage of MAP-21 (June 2012) and the FAST Act (December 2015) and the subsequent rulemaking available at the time when this Policy and Procedures Handbook was developed in mid In some cases, anticipated rulemaking regarding transportation performance measures has been incorporated to potentially reduce the need for interim updates outside of the five-year cycle. Congestion Management Process The Congestion Management Process (CMP) is a management system and process conducted by Metropolitan planning organizations (MPO), such as GPATS, to improve traffic operations and safety through the use of either strategies that reduce travel demand or the implementation of operational improvements. As a Transportation Management Area (TMA), GPATS is required by Federal law to implement a CMP for its entire planning area. The public will typically benefit from having a functional CMP in place because it can improve travel conditions through the use of low cost improvements or strategies. The improvements can be implemented in a relatively 1
2 November 2017 short time frame (within 5-10 years) compared to more traditional capacity improvements, such as adding additional travel lanes, which can take more than 10 years to implement and cost significantly more. Projects identified through the CMP may also be added to future updates of the Long-Range Transportation Plan should they require additional funding or a longer time frame to complete. The Federal Highway Administration (FHWA) defines a CMP as a systematic approach collaboratively developed and implemented throughout a metropolitan region, that provides for the safe and effective management and operation of new and existing transportation facilities through the use of demand reduction and operational management strategies. Causes of Congestion The process of congestion management begins by understanding the cause of the problem. Figure 1-1 illustrates the results of a national study presented by FHWA on the sources of congestion. Six major causes of congestion are identified: Bottlenecks points where the roadway narrows or regular traffic demands (typically at traffic signals) cause traffic to back up; these are the largest source of congestion and typically cause a roadway to operate below its adopted level of service standards. Traffic Incidents crashes, stalled vehicles, debris on the road; these incidents cause about one quarter of congestion problems. Work Zones for new road building and maintenance activities, such as filling potholes; caused by necessary activities, but the amount of congestion caused by these actions can be reduced through a variety of strategies. Bad Weather cannot be controlled, but travelers can be notified of the potential for increased congestion and signal systems can adapt to improve safety. Poor Traffic Signal Timing the faulty operation of traffic signals or green/red lights where the time allocation for a road does not match the volume on that road; poor signal timings are a source of congestion on major and minor streets. Special Events cause spikes in traffic volumes and changes in traffic patterns; these irregularities either cause or increase delay on days, times, or locations where there usually is none. 2


3 November 2017 As shown in Figure 1-1, bottlenecks are the largest cause of congestion nationally, followed by traffic incidents and bad weather. Adverse weather cannot be controlled, but policies and improvements can be implemented to control traffic incidents and bottlenecks. Due to the lack of comprehensive local studies on the causes of congestion, these national data are widely used in CMP updates. The data suggest that local causes are likely to be similar, with bottlenecks and traffic incidents typically being the top two causes of congestion. Figure 1: Causes of Congestion 3
4 November 2017 Federal Requirements Public Law , the Moving Ahead for Progress in the 21st Century Act (MAP-21), was signed into law on July 6, 2012 and provided federal transportation funding for fiscal years 2013 and MAP-21 was the first transportation legislation enacted since 2005 and provides updated policy and programmatic framework for investments to guide the growth and development of the country s vital transportation infrastructure. It was the intent of MAP-21 to create a streamlined, performance-based, multi-modal program to address the needs of the national transportation system as outlined in the National Goals listed below. Fundamental aspects of this legislation extended to future fiscal years through continuing legislation and through a new transportation bill. On December 4, 2015, Public Law , the Fixing America s Surface Transportation Act (FAST Act) was signed into law. The FAST Act funds transportation programs for fiscal years 2016 through 2020 and is the first longterm surface transportation authorization enacted in a decade that provides funding certainty for surface transportation. The FAST Act supports critical transportation projects to ease congestion and facilitate freight movement on major roads by establishing and funding new policies and programs. National Goals Safety to achieve a significant reduction in traffic fatalities and serious injuries on all public roads. Infrastructure condition to maintain the highway infrastructure asset system in a state of good repair. Congestion reduction to achieve a significant reduction in congestion on the National Highway System. System reliability to improve the efficiency of the surface transportation system. Freight movement and economic vitality to improve the National Highway Freight Network, strengthen the ability of rural communities to access national and international trade markets, and support regional economic development. Environmental sustainability to enhance the performance of the transportation system while protecting and enhancing the natural environment. Reduced project delivery delays to reduce project costs, promote jobs and the economy, and expedite the movement of people and goods by accelerating project completion through eliminating delays in the project development and delivery process, including reducing regulatory burdens and improving agencies work practices. Federal Regulations The Federal requirements for a Congestion Management Process in Transportation Management Areas are summarized in the supporting materials at the end of the CMP. This guidance is codified in the Code of Federal Regulations (CFR (Section ) Statewide Transportation Planning; Metropolitan Transportation Planning; Final Rule). 4


5 November 2017 Congestion Management Process: A Guidebook Federal Eight-Step Congestion Management Process In April 2011, the FHWA released the Congestion Management Process: A Guidebook document which provides additional detail and guidance to MPOs in the development and application of a congestion management process. This guidebook includes an eight-step process that summarizes the key parts of an ongoing congestion management process. These steps are summarized in Figure 1-2. Figure 2: Federal Eight Step Congestion Management Process 5


6 November 2017 Incorporating Travel-Time Reliability in the CMP: A Primer Travel-time reliability is defined as the consistency and dependability in travel times that are measured from day-to-day and/or across different times of the day. Travel-time reliability is significant to the CMP because it incorporates a systematic method to address the issue of traffic congestion caused by non-recurring events. Non-recurring events include: Traffic Incidents Road Work Zones Weather Special Events Non-recurring events account for a majority of total traffic congestion-related delay in the United States and not until recently were there cost-effective data collection opportunities. In addition to more inexpensive traveltime monitoring technologies, there are three factors that have contributed to a greater focus on travel-time reliability in MPOs. These factors include: Constraints on Expansion of the Transportation System New roadway construction and roadway expansion has largely ended in the United States due to high costs, the built-out nature of urbanized areas, and the community desire for multimodal streets. Expectations of the Traveling Public Surveys have shown that the traveling public often values traveltime reliability more than speed. Federal Surface Transportation Reauthorization Law When MAP-21 was signed into law, a process that involved performance measurement, target setting, and transportation investment reporting was established and seven national goals were set. Three years later, the FAST Act was signed into law and included the same national goals. One of the seven goals is: System reliability to improve the efficiency of the surface transportation system. The benefits of incorporating travel-time reliability into the CMP include a superior understanding of the regional transportation system that contains capacity expansion strategies. The inclusion of travel time reliability will take the CMP a step further by also featuring a heavier concentration of operation strategies, such as signal retiming or traveler information as appropriate by the area and type of transportation corridor. Figure 1-3 provides a snapshot of potential capacity and operations related strategies. 6

7 November 2017 Figure 3: Typical Capacity and Operations Related Strategies 7
8 November 2017 CMP Policy and Procedures Handbook Overview The CMP is an important part of GPATS planning efforts. This handbook outlines the policies and procedures that will ensure that federal and state requirements are addressed. Specific performance evaluation information on the CMP roadway network will be included in this document as well as in the LRTP. This handbook is outlined to follow the eight-step CMP, based on federal guidelines. The main purpose of this handbook is to (1) Develop CMP Goals and Objectives; (2) Define the Regional CMP Network; (3) Develop Multimodal Performance Measures; (4) Identify the potential sources of data to monitor system performance; (5) Identify policies and procedures for the update of the CMP. The report chapters found in this handbook are described in more detail below. Chapter 1- Introduction The purpose of the CMP (based on federal requirements), an introduction to the causes of congestion, and an overview of the handbook are provided. Chapter 2 - CMP Overview The eight-step CMP is described and a general overview of the process is provided as well as the update schedule for the CMP. Chapter 3 - Goals and Objectives The remainder of the chapters in this handbook discuss specific steps from the eight-step CMP. The Goals and Objectives of the CMP are documented in this chapter. Chapter 4 - Network Identification A description of the area of application and transportation network used for the CMP process is provided. Chapter 5 - Development of Performance Measures A brief summary is provided of congestion related measures that can be used to monitor the effectiveness of the CMP. Chapter 6 - System Performance Monitoring Plan This chapter describes how to evaluate and monitor the system, identify congested corridors and select corridors for evaluation, evaluate corridors and potential strategies (described in Chapter 7), and prioritize and program improvements. Chapter 7 - Congested Corridor Selection and CMP Strategies This chapter describes how congested corridors are typically identified and strategies that can be used to reduce congestion and different strategies that can be used to improve identified congested corridors. Chapter 8 - Monitoring and Strategy Effectiveness This chapter discusses future updates and monitoring efforts to help leverage the CMP as an effective tool for the region. 8

9 November 2017 CMP Overview GPATS Eight-Step Congestion Management Process This section documents the revised Congestion Management Process for GPATS that will be used to address the Federal requirements and unique local needs and opportunities of the communities in the region. This process closely matches the Federal Eight-Step Process and includes additional detail in specific sections where appropriate. Figure 2-1 demonstrates the Eight-Step process that will be used by GPATS. As noted, the first three steps will typically be updated concurrent with each update of the Long-Range Transportation Plan which takes place every five years. Steps 4 to 8 will potentially be updated on a more frequent basis. The remainder of this section details the eight steps and how they will be implemented. Figure 4: GPATS Approach to the Federal Eight Step Process [AW1] 9
10 November 2017 CMP in the Metropolitan Planning Process The CMP is a working tool that needs to be effectively integrated into the MPO s project prioritization process, Transportation Improvement Plan (TIP), and Long-Range Transportation Plan (LRTP). The objectives- driven, performance-based CMP starts with the monitoring and evaluation of current conditions to identify where congestion exists. Based on the identified goals and objectives and the established performance measures of the CMP, this evaluation leads to the identification of potential mitigation strategies, implementation of appropriate strategies, and the development of a monitoring plan. The outputs of the CMP, such as identified congested corridors/locations and their recommended mitigation measures, then proceed through the CMP process where they are evaluated and projects or programs are selected for implementation. The projects or programs that are identified through the CMP are moved into project development and programmed into the TIP for funding and implementation. The implemented projects are then monitored to evaluate the strategy effectiveness on a system-wide basis. For GPATS, CMP projects are primarily funded using federal and state funds with local matching revenues. GPATS can periodically update their most important strategies for implementation and associated funding considerations through the TIP and LRTP update process. Public Involvement Process Public involvement for the development of the Horizon2040 Long-Range Transportation Plan was a comprehensive process focusing on all areas of the plan development, including congestion managment. Public engagement activities included a variety of in-person and online events, reaching a wide swath of people over the study area. Participants were asked to offer input on the vision and recommendations for the LRTP. Congestion mitigation played an important role in this conversation, providing the public with an opportunity to learn about the various types of strategies available for addressing this major issue. As recent federal regulations warrant involvement of the public during all key stages of transportation projects, it is important to involve the public in all key stages of transportation improvement projects within and beyond the CMP. Otherwise, lack of public support and awareness may adversely impact the success of any potential transportation project. The strategies for congestion mitigation, both in the LRTP and the CMP, are being presented to the Policy Committee, Study Team, and citizens of the GPATS region through a public review period. During the development of the Horizon2040 Long-Range Transportation Plan, meetings were held with the GPATS Policy Committee, GPATS Study Team, members of the public, and key stakeholders. Public outreach was conducted through centralized public workshop events, sub-regional workshops, online surveys, and a statistically valid phone and online survey. The CMP should be regualarly reassessed and evaluated as regional conditions evolve. A key contribution of the GPATS Study Team will be to identify, track, and evaluate potential congestion- or safety-related issues on the CMP roadway network. 10
11 November 2017 CMP Actions/Recommendations A list of recommendations and actions is presented to enhance the CMP and become more efficient in the overall MPO planning process. The actions/recommendations presented below will be reviewed and considered by GPATS staff and the GPATS Study Team for implementation as necessary. Update the CMP Policy and Procedures Handbook (CMP Steps 1-3) on a five-year cycle consistent with the update cycle of the LRTP. Timing of the completion of CMP updates in advance of finalizing LRTP updates would benefit integration of CMP strategies into the LRTP. Continue to refine the CMP to track effectiveness of the implemented strategies, to the extent possible, and to evaluate trends and conditions for the multi-modal transportation system in the CMP study area. Future updates to the CMP will focus on steps 4 through 8 of the CMP process: o o o o Step 4: Collect Data/Monitor System Performance Step 5: Analyze Congestion Problems & Needs Step 6: Identify and Assess Strategies Step 7: Implement Selected Strategies o Step 8: Monitoring and Strategy Effectiveness (combined with Step 4) Enhance coordination with agencies participating in the CMP by framing desirable strategy types and defining roles in implementation. This is essential, as most congestion and mobility strategies will ultimately be funded and managed at the state level. Projects from the CMP process may identify projects for inclusion in the LRTP either through the fiveyear update cycle or through plan amendments. Identify and implement data collection recommendations on collecting key congestion data, as well as closing any data gaps identified in this CMP. Perform outreach and education efforts to inform interested parties and stakeholders. These may include: o o Maintain a CMP page on the GPATS website. Develop a brochure and/or newsletter on the CMP and its benefits. Continue monitoring changes to federal CMP regulations and modify/update CMP to reflect new requirements. 11
12 November 2017 CMP Goals A series of CMP goals were developed to guide the process of monitoring congestion and improving the mobility of persons and goods for the area served by GPATS. These were compiled by referencing the guiding statements developed as part of the Horizon2040 Long-Range Transportation Plan. The goals are presented below and will be used as a tool for selecting strategies and performance measures for strategy monitoring and evaluation. Elements in italics are provided for reference only and are not part of the CMP. Goal 1 Culture & Environment: Enhance the region s quality of life by preserving and promoting its valued places and natural assets Protect and enhance the natural and social environment by using context sensitve transportation strategies. Minimize direct and indirect environmental impacts of the transportation system. Promote consistency between transportation improvements, land use decisions, and economic development patterns Goal 2 Economic Vitality: Support regional economic vitality by making it easier to move people and freight within and through the region. Highlight transportation recommendations that enable global competiveness, productivity, and efficiency. Increase the accessibility and mobility of people and freight within the region and to other areas. Leverage gateways and aesthetics to create an atmosphere that fosters economic investment. Goal 3 Growth & Development: Make traveling more efficient by coordinating transportation investments with land use decisions. Prepare for continued population growth by coording transportation strategies with land use initiatives to foster vibrant and livable communities. Connect people to jobs and educational opportunities through coordinated transportation and land use investment decisions. Promote mixed-use developments supportive of bicycle, pedestrian, and transit activity in town centers and along priority corridors. Goal 4 Mobility & Accessibility: Provide a balanced transportation system that makes it easier to bike, walk, and take transit. Provide desirable and user-friendly transportation options for all user groups regardless of socioeconomic status or physical ability. Support a fully integrated multimodal network that advances the concept of complete streets. Expand and maintain a network of bicycle, pedestrain, and transit facilities that connects homes, activity centers, and complementary amenities. 12
13 November 2017 Goal 5 Safety & Security: Promote a safe and secure transportation system by reducing crashes, making travel reliable and predictable, and improving emergency response. Improve the safety of the transportation system for all user groups regardless of socioeconomic status or physical ability. Increase the reliability, predictability, and efficiency of the transportation experience through system improvements and enhanced communication. Improve safety and security by mitigating potential conflicts and delays at high-crash locations and rail crossing sites. Goal 6 System Preservation: Extend the life of the transportation system and promote fiscal responsibility by emphasizing maintenance and operational efficiency. Increase the lifespan of existing infrastructure and ensure the optimal use of transportation facilities. Identity and prioritize infrastructure preservation and rehabilitation projects such as pavement management and signal system upgrades. Increase the use of innovative transportation technology to enhance the efficiency of the existing transportation system and to be better prepared for emerging vehicle technologies. 13
14 November 2017 Network Identification Introduction This chapter of the CMP component presents an overview of the geographic area of application and the transportation network for the GPATS CMP. Area of Application The CMP area of application includes the transportation system that needs to be evaluated and monitored and where congestion management policies and procedures need to be applied. The geographic area of application for this CMP update consists of the major regional roadways in the five-county GPATS region. Transportation Network Consistent with federal guidelines, the GPATS CMP covers a multimodal transportation network. In addition to evaluating congestion on the roadway network, the GPATS CMP evaluates transit, bicycle/pedestrian/trail, and freight movement networks within its designated area of application. The CMP roadway network is described below. Consistent with federal guidelines, the GPATS CMP covers a multimodal transportation network. In addition to evaluating congestion on the roadway network, the GPATS CMP evaluates transit, bicycle/pedestrian/trail, and freight movement networks within its designated area of application. The CMP roadway network is described below. Roadway Network The GPATS CMP roadway network includes two groups of roadways: CMP Network - Key Regional Roadways (National Highway System (NHS) Routes): GPATS will be required to frequently report performance statistics on the NHS routes. As a result, these routes were separated into the first tier of CMP network roadways to facilitate the update of these statistics. Non-CMP Network - Other Regional/Major Roadways: These represent other major regional roadways, including regional roadways forecasted to be potentially congested in the Horizon2040 Long-Range Transportation Plan. The map in Figure 5 illustrates the GPATS CMP Network. This represents the study area and network for the GPATS CMP. Chapter 7 provides further information on congested corridors and strategies. 14
15 Figure 5: GPATS CMP Network 15
16 Development of Performance Measures Introduction MAP-21 and the FAST Act place an emphasis on performance-based planning. In order to carry forward the guidance of these pieces of legislation, FHWA is in the process of developing a series of performance measures which will be implemented at the state and metropolitan levels. As these performance measures are identified, they will be incorporated into the LRTP and TIP development process. The GPATS CMP has attempted to identify a series of potential performance measures that can help serve as a guide until formal performance measures are introduced. These performance measures are used as tools to measure and monitor the effectiveness of the transportation system in the CMP. They assist in identifying and tracking as areas progress in monitoring congestion. However, these measures are dependent upon the transportation network and the availability of data. They typically are used to measure the extent and severity of congestion and for the evaluation of the effectiveness of the selected strategies. As the new federal and state performance measures are introduced, the CMP performance measures will be adjusted to be consistent with that information. Chapter 9 of the Horizon2040 LRTP discusses the federal and state performance measurement process in greater detail. As identified by FHWA, a set of good performance measures: Includes quantifiable data that are simple to present and interpret and have professional credibility, Describes existing conditions and can be used to identify problems and to predict changes, Can be calculated easily and with existing field data, uses techniques available for estimating the measure, and achieves consistent results, and Applies to multiple modes and is meaningful at varying scales and settings. CMP Performance Measures The CMP performance measures were selected to address the existing conditions for the multimodal network the region. The measures are organized into the following major categories: Safety Performance Measures Roadway Capacity Performance Measures Reliable Travel Time Performance Measures Goods Movement Performance Measures Public Transit Performance Measures TDM Performance Measures Some of these performance measures were identified based on numerous monitoring activities currently conducted and/or planned by various local and state agencies responsible for providing or supporting transportation facilities and services in the region. Detailed descriptions of each of these 16
17 measures, together with an explanation of how the required data are or will be collected, are presented in the remainder of this chapter. Safety Performance Measures (5-Year Rolling Average) Traffic Fatalities Fatality Rate Severe Injuries Roadway Capacity Performance Measures Over Capacity Centerline Roadway Miles on CMP Network Reliable Travel Time Performance Measures Percent of Person-Miles Traveled on the Interstate That Are Reliable Severe Injury Rate Non-Motorized Safety Volume /Capacity Ratio Percent of Person-Miles Traveled on the Non-Interstate NHS That Are Reliable Goods Movement Performance Measures Truck Travel Time Reliability (TTTR) Index Vehicle Miles Traveled (VMT) At or Over Capacity on Designated Truck Routes (All Vehicles) Public Transit Performance Measures Percent of Congested Roadway Centerline Miles with Transit Service Transit Passenger Trips per Revenue Hour Transit Average Peak Service Frequency (National Transit Database) Transit Annual Ridership TDM Performance Measures Percent of Commuters Using Carpools or Vanpools CMAQ Rule Total Emission Reductions (Specific to CMAQ Funded Projects) Non-CMP System Preservation Performance Measures Percent of Pavements of the Interstate System in Good condition Percent of Pavements of the non-interstate NHS in Good condition Percent of Pavements of the Interstate System in Poor condition Percent of Pavements of the non-interstate NHS in Poor condition Percent of NHS Bridges Classified as in Good Condition Percent of NHS Bridges Classified as in Poor Condition Percentage of Transit Vehicles met or exceeded Useful Life Benchmark Percentage of Transit Infrastructure assets in a State of Good Repair Percentage of Transit Assets with Condition Rating Below 3.0 on FTA TERM Scale 17
18 Performance Measure Descriptions This section explains each of the CMP performance measures listed above in more detail. A section at the end of each category of performance measures discusses sources of and identifies those suggested performance measures where data is not currently available. Safety Performance Measures (5-Year Rolling Average) Crashes at intersections and roadway segments are used as an indicator of congestion. Considered a measure of nonrecurring congestion, this measure uses data that are widely available through the many local and state agencies that track them on an ongoing basis throughout the CMP application area. All data is collected and summarized in the form of a 5-year rolling average. Chapter 9 of the Horizon2040 LRTP discusses these targets in more detail. Number of Traffic Fatalities Summary of the number of fatalities from motor vehicle crashes. This is measured by the number of fatalities and not the number of fatality crashes. Fatality Rate Summary of the number of fatalities from motor vehicle crashes normalized by exposure in the form of vehicle miles of travel (100,000). This is measured by the number of fatalities and not the number of fatality crashes. Severe Injuries Summary of the number of incapacitating injuries from motor vehicle crashes. This is measured by the number of persons receiving incapacitating injuries and not the number of incapacitating injury crashes. Severe Injury Rate Summary of the number of incapacitating injuries from motor vehicle crashes normalized by exposure in the form of vehicle miles of travel (100,000). This is measured by the number of persons receiving incapacitating injuries and not the number of incapacitating injury crashes. Non-Motorized Safety (Fatalities + Serious Injuries) Summary of the number of fatalities and incapacitating injuries from motor vehicle crashes that involve pedestrians or bicyclists. This is measured by the sum of the number of fatalities and incapacitating injuries and not the number of fatality or incapacitating injury crashes. Data Collection/Availability Crash data is collected through various law enforcement agencies. All of the safety target information is maintained by SCDOT and provided to the MPO for reporting purposes. Updates to this information will be provided on an annual basis. Roadway Capacity Performance Measures Over Capacity Centerline Roadway Miles on CMP Network 18
19 Summarizes the centerline roadway miles operating with a volume to capacity ratio greater than 1.0 to help quantify the level of congestion within the region. This measure can be broken down to reflect interstates and other routes. Volume/Capacity Ratio The volume-to-capacity (V/C) ratio is used as the major tool in measuring roadway conditions and is a measure of the amount of traffic on a given roadway in relation to the amount of traffic the roadway was designed to handle. For this measure, the different parts of the transportation system are grouped (National Highway System (NHS) Interstate, National Highway System Non-Interstate, Non-NHS CMP Network) and the sum of volumes is compared to the sum of capacities. Data Collection/Availability Evaluation of roadway capacity and travel volumes will be provided from the base year of the regional travel demand model. Reliable Travel Time Performance Measures Percent of the Interstate System Providing Reliable Travel Times Percent of the Interstate System providing reliable travel times as reported in Person-Miles. Percent of the Non-Interstate NHS Providing Reliable Travel Times Percent of the Non-Interstate National Highway System providing reliable travel times as reported in Person- Miles. This will typically only be measured on principal arterial roadways due to the availability of data and a limited number of minor arterial facilities. Data Collection/Availability Travel time data would come from the National Performance Management Research Data Set (NPMRDS) or an FHWA approved equivalent data set. State DOTs, in agreement with MPOs, are required to define reporting segments consistently for all measures and submit them to FHWA. In general, reporting segments in urbanized areas would have a maximum length of ½ mile, while the maximum length in non-urbanized areas would be 10 miles, unless an individual travel time segment is longer. These data are not being gathered and reported as a part of the current CMP. This measure will be required to be reported by June 15, Additional guidance can be found in the following FHWA resource document: Goods Movement Performance Measures Truck Travel Time Reliability (TTTR) Index Percent of the NHS providing reliable truck travel times. The Travel Time Index is the ratio of the peak-period travel time to the free-flow travel time. This measure is computed for the AM peak period (6 am to 9 am) and PM peak period (4 pm to 7 pm) on weekdays. Averages across urban areas, road sections, and time periods are weighted by VMT using volume estimates derived from FHWA's HPMS. 19
20 Data Collection/Availability Truck Travel Time Reliability Data will be reported as data becomes available, using the FHWA Highway Performance Monitoring System (HPMS) database. Vehicle Miles Traveled (VMT) Exceeding Capacity on Designated Truck Routes Measures the total vehicle miles of travel exceeding capacity on designated truck routes. The VMT for a roadway segment is calculated by multiplying the AADT of all vehicles on that segment by the length of the segment in miles. Data Collection/Availability Evaluation of roadway capacity and travel volumes will be provided from the base year of the regional travel demand model. Public Transit Performance Measures Percent of Congested Roadway Centerline Miles with Transit Service Summarizes the proportion of congested roadway centerline miles with regularly scheduled transit service (fixed-route local bus service). Data Collection/Availability Transit providers annual report National Transit Database (NTD). Passenger Trips per Revenue Hour Summarizes the system wide number of passengers boarding a transit vehicle during one revenue service hour. Data Collection/Availability Transit providers annual report National Transit Database (NTD). Average Service Frequency The average service frequency for all fixed-route transit services bus routes operated on the CMP roadway network is measured. This measure identifies average frequencies by transit system, along with the region-wide average. Data Collection/Availability Transit providers annual report National Transit Database (NTD). Annual Ridership Annual ridership summarizes the total number of unlinked passenger trips from all transit routes that operate in the CMP application area. Passengers are counted each time they board vehicles, no matter how many vehicles they use to travel from their origin to their destination. Data Collection/Availability Transit providers annual report National Transit Database (NTD). 20
21 TDM Performance Measures Percent of Commuters Using Carpools or Vanpools Summarizes the percent of persons reporting using carpools and vanpools in the region. A carpool is defined as a group of two or more people who commute to work or other destinations together in a private vehicle, while a vanpool is typically a prearranged group of 5 to 15 people who share their commute to work. Data Collection/Availability American Community Survey (ACS) US Census Bureau CMAQ Rule Total Emission Reductions Summarized for all projects financed with funds from the 23 U.S.C. 149 CMAQ program apportioned to State DOTs in areas designated as nonattainment or maintenance for ozone (O 3), carbon monoxide (CO), or particulate matter (PM 10 and PM 2.5). This is a project specific measure and is not calculated on a systemwide basis. Data Collection/Availability This measure will require a technical evaluation for each CMAQ funded project. Relationship of Performance Measures to Guiding Statements The CMP builds on the goals identified in Chapter 1 and each performance measure identified in the previous section is linked directly back to the guiding statements that aided in the development of the Horizon2040 LRTP. 21
22 Safety Performance Measures Number of Fatalities Fatality Rate Serious Injuries Serious Injury Rate Non-Motorized Safety (Fatalities + Serious Injuries) Roadway Capacity Performance Measures Over capacity roadway miles on CMP Network j j j j Volume /Capacity Ratio j j j j Reliable Travel Time Performance Measures Percent of Person-Miles Traveled on the Interstate That Are Reliable Percent of Person-Miles Traveled on the Non- Interstate NHS That Are Reliable j j j j j j j j j 22
23 Goods Movement Performance Measures Truck Travel Time Reliability (TTTR) Index n n n n Vehicle Miles Traveled at or Over Capacity on Designated Truck Routes n n n n Number of Unprogrammed Freight Hotspot Locations Unprogrammed n n n n Public Transit Performance Measures Percent of Congested Roadway Centerline Miles with Transit Service a a a Transit Passenger Trips per a a a a Revenue Hour Transit Average Peak Service Frequency (National Transit Database) a a a a Transit Annual Ridership a a a a TDM Performance Measures Percent of Commuters Using b b b Carpools or Vanpools 23
24 CMAQ Rule Performance Measure Total Emission Reductions (Specific to CMAQ Funded Projects) C C C C System Preservation Performance Measures Percent of pavements of the Interstate System in Good Condition Percent of pavements of the non-interstate NHS in Good condition Percent of pavements of the Interstate System in Poor condition Percent of pavements of the non-interstate NHS in Poor condition Percent of NHS Bridges Classified as in Good Condition Percent of NHS Bridges Classified as in Poor Condition Percentage of transit vehicles met or exceeded Useful Life Benchmark Percentage of transit infrastructure assets in a State of Good Repair a a a a a a a a a a Percentage of transit assets with condition rating below 3.0 on FTA TERM Scale a a a a a 24
25 Overview of Monitoring Plan FHWA identifies congestion monitoring as just one of the several aspects of transportation system performance that leads to more effective investment decisions for transportation improvements. Safety, physical condition, environmental quality, economic development, quality of life, and customer satisfaction are among the aspects of performance that also require monitoring. The Final Rule on Metropolitan Transportation Planning identifies the requirement for a coordinated program for data collection and system performance monitoring to assess the extent of congestion, to contribute in determining the causes of congestion, and evaluate the efficiency and effectiveness of implemented actions. In addition, it also indicates that to the extent possible, this data collection program should be coordinated with existing data sources and coordinated with operations managers in the metropolitan area. As a result, the goal of the GPATS CMP system monitoring plan is to develop an ongoing system of monitoring and reporting that relies primarily on data already collected or planned to be collected in the region. The components of the monitoring plan include roadways, public transit, bicycle/pedestrian/trail, TDM, and goods movement where: Roadways are monitored through annual LOS analysis using traffic counts and other related data constantly collected throughout the region. Crashes are monitored to identify potential non-recurring congestion. Transit performance is monitored continuously through various operating and capital plans (as available). Bicycle/pedestrian/trail facility data are monitored and updated in various databases. Significant goods movement corridors are evaluated to address mobility needs of the goods movement providers. 25
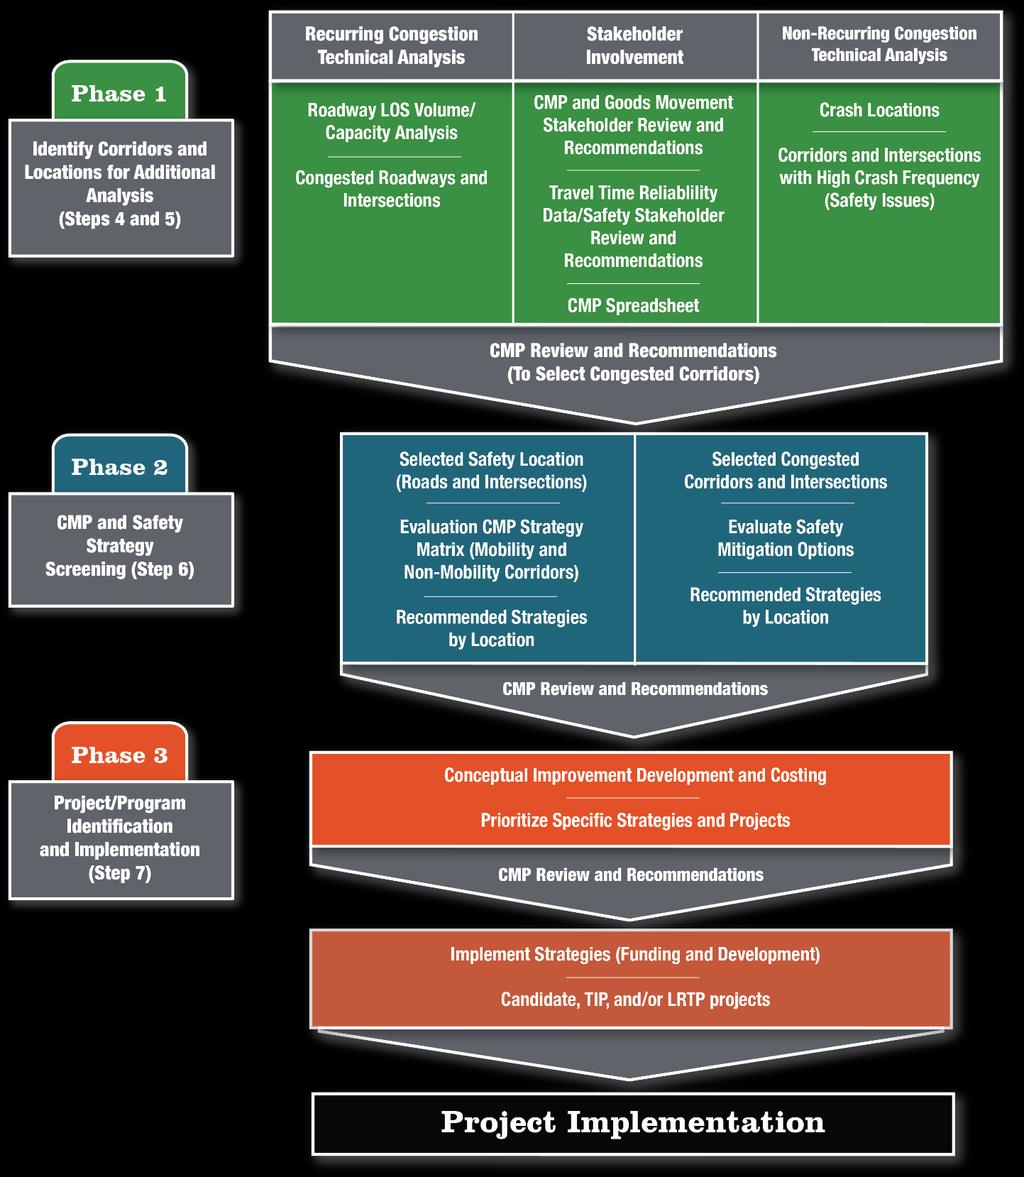
26 Congested Corridor Selection and CMP Strategies Implementation This section summarizes the implementation and management of the CMP strategies. This includes the process for selecting corridors and projects for implementation in the future as well as identifying schedules, responsibilities, costs, and possible funding sources for each strategy. Congested Corridor Selection and Project Selection Process The purpose of the CMP is to identify actual projects. The CMP process involves selecting congested corridors that will undergo detailed evaluation for identifying potential projects/programs that can be potentially implemented on the corridors. The process follows three phases (an overview illustration is provided in Figure 7-1): Congested Corridor Network Identification (Phase 1) Routine monitoring efforts are used to review the level of service on the roadway network to identify recurring congestion. Roadways that are congested today are considered for review through the CMP screening process. Corridors are identified as being not congested, approaching congestion or minimally congested, or extremely congested, as summarized below). Not Congested: Corridors that are not anticipated to operate below their adopted level of service standards in either the existing conditions or after committed improvements in the STIP are implemented. Approaching Congestion or Minimally Congested: Corridors that are approaching congestion or are minimally congested based on one of the following three criteria (projects on these corridors may have the greatest impact): o o Approaching Congestion Corridors that are not congested but have segments that have traffic volumes that consume more than 80% of the roadway s capacity but do not exceed the physical capacity of the roadway with either the existing conditions or following the completion of committed STIP projects. Congested Today Existing corridors with traffic volumes that exceed the physical capacity of the roadway. Extremely Congested: Roadways in the Existing + Committed (E+C) network that have forecast volumes that are greater than the physical capacity (typically occurs when using detailed analysis and the volume-to-capacity ratio is 1.08 or greater) of the roadway and are considered severely congested. Crash data management systems also are used to identify corridors or intersections with a high frequency of crashes that result in non-recurring congestion. Safety improvements not only reduce the potential harm to persons in our communities but also can reduce congestion. Generally, non-congested corridors do not need to be addressed by the CMP; however, the other two categories typically will require one or more congestion-relieving strategies (project, mobility improving program, etc.). 26
27 Extremely congested corridors typically will require either capacity improvements or a shift to other mobility strategies that rely significantly on public transportation or reductions in travel demand. In some cases, extremely congested corridors may respond favorably to the installation of operational improvements; these would be considered on a case-by-case basis where appropriate. The corridors approaching congested or minimally congested typically represent the corridors that will be most responsive to CMP improvement strategies. After the congested network and corridors have been identified, a specific corridor can be selected for detailed analysis and project identification and implementation. The Study Team[AW2] reviews the selection of corridors. Once corridors are selected and evaluated, they will not need to be reevaluated until the next LRTP update cycle. Corridors typically are selected based on the following: 1. Corridors without committed projects in the STIP that are forecasted to be approaching congestion, minimally congested, or extremely congested by the horizon year of the LRTP. 2. The corridor(s) that would receive the greatest mobility or operational benefit from the CMP process. CMP and Safety Strategy Screening (Phase 2) Once congested corridors are selected for review, they are screened to identify mitigation strategies appropriate to reduce congestion or improve safety to reduce crashes. The CMP Strategy Matrix is used to address recurring congestion, and the Safety Mitigation Strategy Matrix (both found in the CMP Supporting Materials) is used to address nonrecurring congestion. The matrix includes strategies in five tiers as identified in the CMP Strategy Toolbox. The CMP Strategy Matrix typically is used in a workshop setting to quickly review a corridor, and the Safety Mitigation is applied based on a review of crash data. Project Identification and Implementation (Phase 3) The congestion or safety mitigation strategies that are identified as having the greatest potential benefit are then evaluated in greater detail based on committee or technical recommendations. During this phase, additional analysis of potential projects is undertaken to identify the specific improvement, barriers to implementation, and costs. Programs such as demand-reducing programs or policy changes are evaluated to identify recommended action items. This may result in a refocusing of existing resources, such as existing rideshare programs or local maintenance crews where possible, programming improvements in the local agency capital improvement programs, or working with SCDOT to identify candidate projects for advancement in future LRTPs. 27
28 Figure 6: Corridor/Strategy Selection Process 28

29 Congestion Management Strategies This section of the CMP identifies and evaluates the strategies intended for mitigating existing and future congestion in the regional CMP roadway network. A Toolbox of Strategies is presented to help policy makers and planners effectively use these congestion reduction strategies. A full range of potential strategies has been identified for GPATS in its multimodal CMP network. These strategies can be grouped into the following broad categories as presented in Figure 7-2. Figure7: Congestion Management Strategies 29


30 Figure 8: Demand and Operational Management Strategies (Detail) 30

31 Toolbox of Strategies The CMP uses a strategy toolbox with multiple tiers of strategies to support the congestion strategy or strategies for congested corridors. Following an approach used by other MPOs and promoted by FHWA, the toolbox of congestion mitigation strategies is arranged so that the measures at the top take precedence over those at the bottom. The toolbox is presented below. Figure 9: Congestion Management Toolbox The top-down approach promotes the growing sentiment in today s transportation planning arena and follows FHWA s clear direction to consider all available solutions before recommending additional roadway capacity. The GPATS CMP toolbox of strategies is presented in detail in the remainder of this section. 31

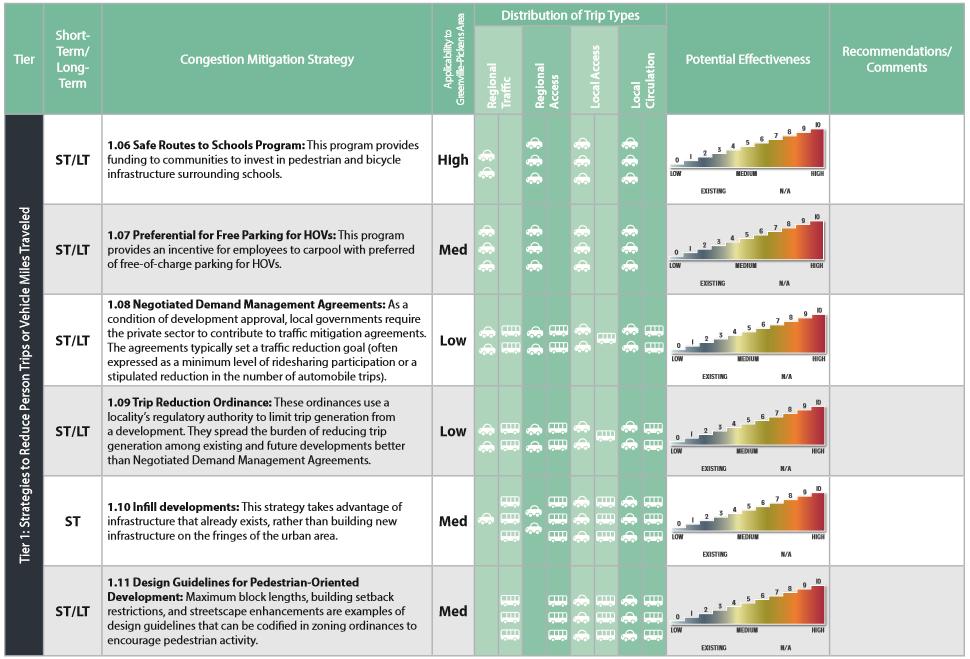
32 Transportation Demand Management Strategies These strategies are used to reduce the use of single occupant motor vehicles, as the overall objective of TDM is to reduce the miles traveled by automobile. The following TDM strategies, not in any particular order, are available for consideration in the toolbox to potentially reduce travel in peak hours. Strategies include: Alternative Work Hours: There are three main variations: staggered hours, flex-time, and compressed work weeks. Staggered hours require employees in different work groups to start at different times to spread out their arrival/departure times. Flex-time allows employees to arrive and leave outside of the traditional commute period. Compressed work weeks involve reducing the number of days per week worked while increasing the number of hours worked per day. Telecommuting: Telecommuting policies allow employees to work at home or at a regional telecommute center instead of going into the office, all the time or only one or more days per week. Guaranteed Ride Home Programs: These programs provide a safety net to those people who carpool or use transit to work so that they can get to their destination if unexpected work demands or an emergency arises. Alternative Mode Marketing and Education: Providing education on alternative modes of transportation can be an effective way of increasing demand for alternative modes. This strategy can include mapping websites that compute directions and travel times for multiple modes of travel. Safe Routes to Schools Program: This federally-funded program provides 100 percent funding to communities to invest in pedestrian and bicycle infrastructure surrounding schools. Preferential or Free Parking for HOVs: This program provides an incentive for employees to carpool with preferred free-of-charge parking for HOVs. 32

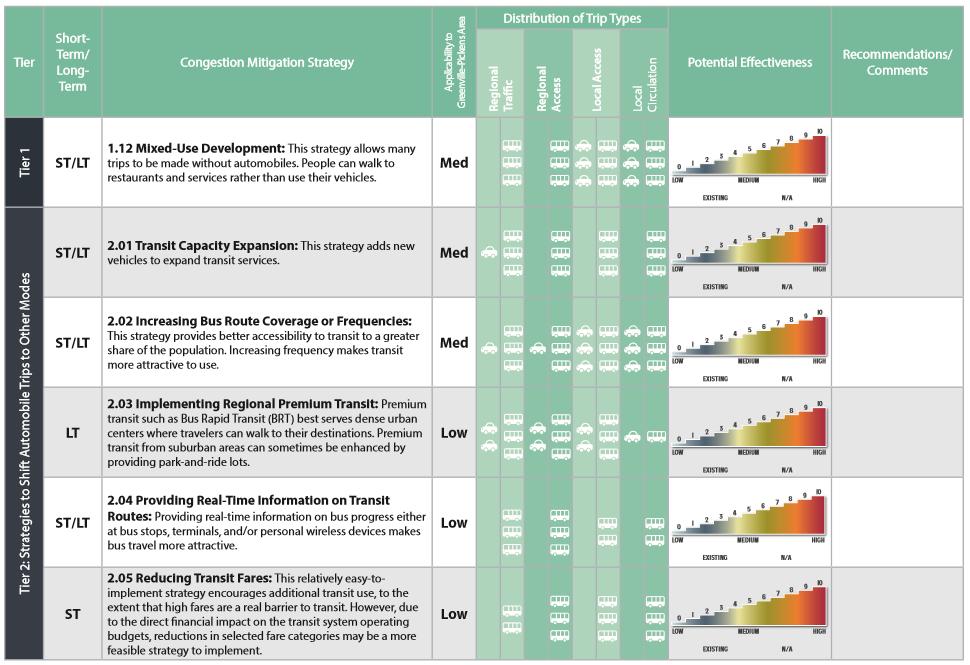
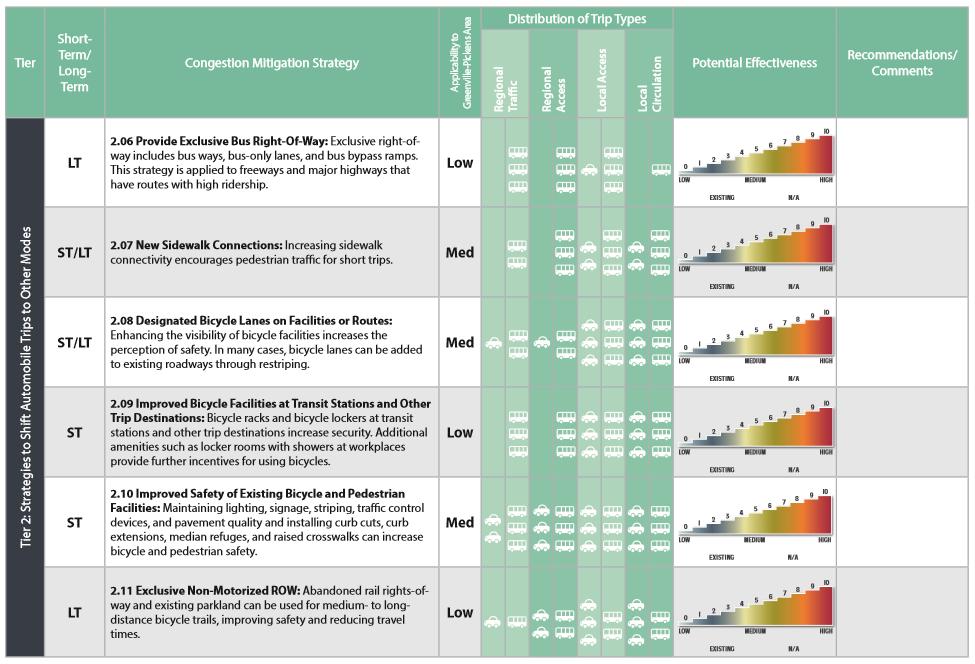
33 Land Use/Growth Management Strategies The strategies in this category include policies and regulations that would decrease the total number of auto trips and trip lengths while promoting transit and non-motorized transportation options. These strategies include the following: Negotiated Demand Management Agreements: As a condition of development approval, local governments require the private sector to contribute to traffic mitigation agreements. The agreements typically set a traffic reduction goal (often expressed as a minimum level of ridesharing participation or a stipulated reduction in the number of automobile trips). Trip Reduction Ordinance: These ordinances use a locality s regulatory authority to limit trip generation from a development. They spread the burden of reducing trip generation among existing and future developments better than Negotiated Demand Management Agreements. Infill Developments: This strategy takes advantage of infrastructure that already exists, rather than building new infrastructure on the fringes of the urban area. Transit Oriented Developments: This strategy clusters housing units and/or businesses near transit stations in walkable communities. By providing convenient access to alternative modes, auto dependence can be reduced. Design Guidelines for Pedestrian-Oriented Development: Maximum block lengths, building setback restrictions, and streetscape enhancements are examples of design guidelines that can be codified in zoning ordinances to encourage pedestrian activity. Mixed-Use Development: This strategy allows many trips to be made without automobiles. People can walk to restaurants and services rather than use their vehicles. Public Transit Strategies Two types of strategies, capital improvements and operating improvements, are used to enhance the attractiveness of public transit services to shift auto trips to transit. Transit capital improvements generally modernize the transit systems and improve their efficiency; operating improvements make transit more accessible and attractive. The following strategies are included in the toolbox for consideration: Transit Capacity Expansion: This strategy adds new vehicles to expand transit services. Increasing Bus Route Coverage or Frequencies: This strategy provides better accessibility to transit to a greater share of the population. Increasing frequency makes transit more attractive to use. Implementing Regional Premium Transit: Premium transit such as Bus Rapid Transit (BRT) or Light Rail Transit (LRT) best serves dense urban centers where travelers can walk to their destinations. Premium regional transit from suburban areas can sometimes be enhanced by providing park-and-ride lots. 33
34 Providing Real-Time Information on Transit Routes: Providing real-time information on bus progress either at bus stops, terminals, and/or personal wireless devices makes bus travel more attractive. Reducing Transit Fares: This relatively easy-to-enact strategy encourages additional transit use, to the extent that high fares are a real barrier to transit. However, due to the direct financial impact on the transit system operating budgets, reductions in selected fare categories may be a more feasible strategy to implement. Provide Exclusive Bus Right-Of-Way: Exclusive right-of-way includes bus ways, bus-only lanes, and bus bypass ramps. This strategy is applied to freeways and major highways that have routes with high ridership. Non-Motorized Transportation Strategies Non-motorized strategies include bicycle, pedestrian, and trail facility improvements that encourage nonmotorized modes of transportation instead of single-occupant vehicle trips. The following strategies are included: New Sidewalk Connections: Increasing sidewalk connectivity encourages pedestrian traffic for short trips. Designated Bicycle Facilities on Local Streets: Enhancing the visibility of bicycle facilities increases the perception of safety. In many cases, bicycle lanes can be added to existing roadways through restriping. Improved Bicycle Facilities at Transit Stations and Other Trip Destinations: Bicycle racks and bicycle lockers at transit stations and other trip destinations increase security. Additional amenities such as locker rooms with showers at workplaces provide further incentives for using bicycles. Improved Safety of Existing Bicycle and Pedestrian Facilities: Maintaining lighting, signage, striping, traffic control devices, pavement quality and installing curb cuts, curb extensions, median refuges, and raised crosswalks can increase bicycle and pedestrian safety. Exclusive Non-Motorized ROW: Abandoned rail rights-of-way and existing parkland can be used for medium- to long-distance bicycle trails, improving safety and reducing travel times. Complete Streets: Routinely designing and operating the entire right-of-way can enable safe access for all users including pedestrians, bicyclists, motorists, and transit. Elements that may be found on a complete street include sidewalks, bike facilities, special bus lanes, comfortable and accessible transit stops, frequent crossing opportunities, median islands, accessible pedestrian signals, curb extensions, support for changing mobility technologies, and more. 34

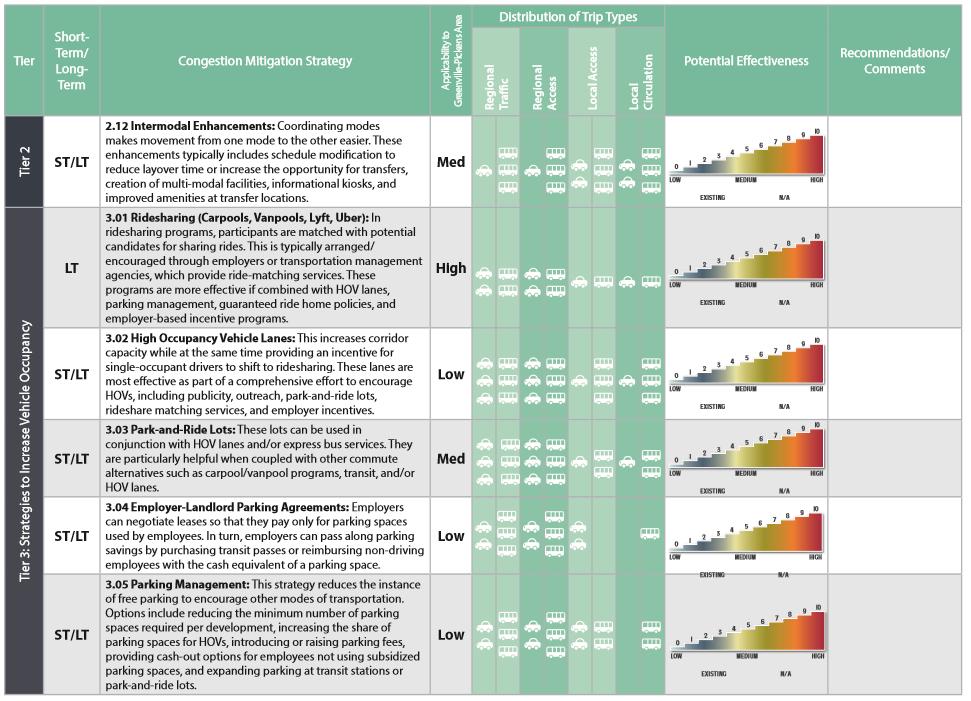
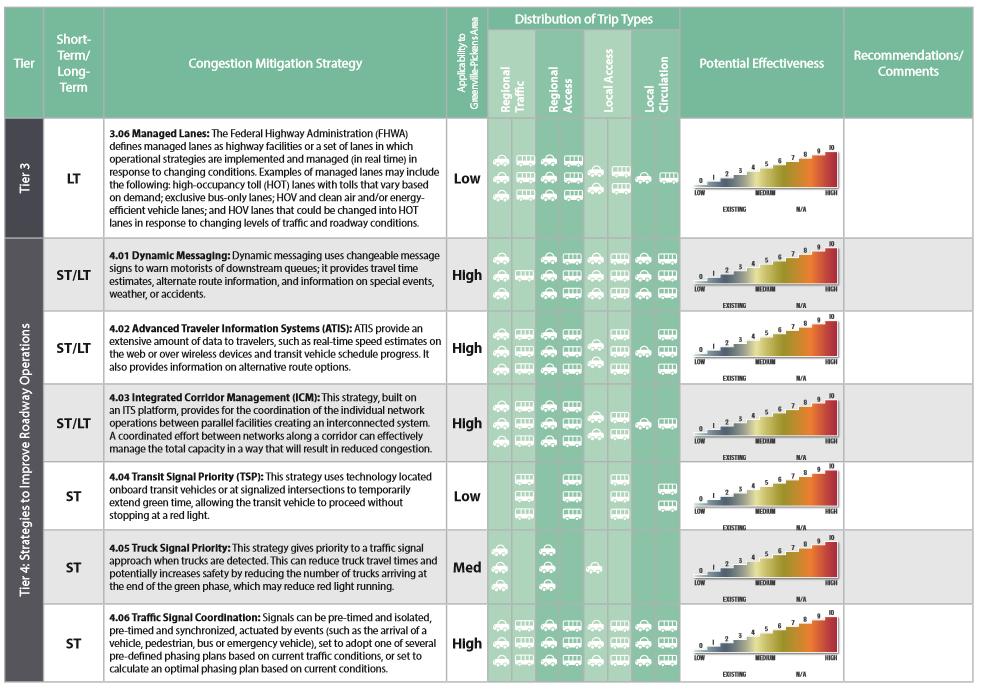
35 Transportation Demand Management Strategies The following TDM strategies are recommended to encourage HOV use: Ridesharing (Carpools & Vanpools): In ridesharing programs, participants are matched with potential candidates for sharing rides. This typically is arranged/encouraged through employers or transportation management agencies that provide ride-matching services. These programs are more effective if combined with HOV lanes, parking management, guaranteed ride home policies, and employer-based incentive programs. High Occupancy Vehicle Lanes: This increases corridor capacity while, at the same time, providing an incentive for single-occupant drivers to shift to ridesharing. These lanes are most effective as part of a comprehensive effort to encourage HOVs, including publicity, outreach, park-and-ride lots, rideshare matching services, and employer incentives. Park-and-Ride Lots: These lots can be used in conjunction with HOV lanes and/or express bus services. They are particularly helpful when coupled with other commute alternatives such as carpool/vanpool programs, transit, and/or HOV lanes. Employer-Landlord Parking Agreements: Employers can negotiate leases so that they pay for parking spaces used only by employees. In turn, employers can pass along parking savings by purchasing transit passes or reimbursing non-driving employees with the cash equivalent of a parking space. Parking Management: This strategy reduces the instance of free parking to encourage other modes of transportation. Options include reducing the minimum number of parking spaces required per development, increasing the share of parking spaces for HOVs, introducing or raising parking fees, providing cash-out options for employees not using subsidized parking spaces, and expanding parking at transit stations or park-and-ride lots. Managed Lanes: FHWA defines managed lanes as highway facilities or a set of lanes in which operational strategies are implemented and managed (in real time) in response to changing conditions. Examples of managed lanes may include high-occupancy toll (HOT) lanes with tolls that vary based on demand, exclusive bus-only lanes, HOV and clean air and/or energy-efficient vehicle lanes, and HOV lanes that could be changed into HOT lanes in response to changing levels of traffic and roadway conditions. 35

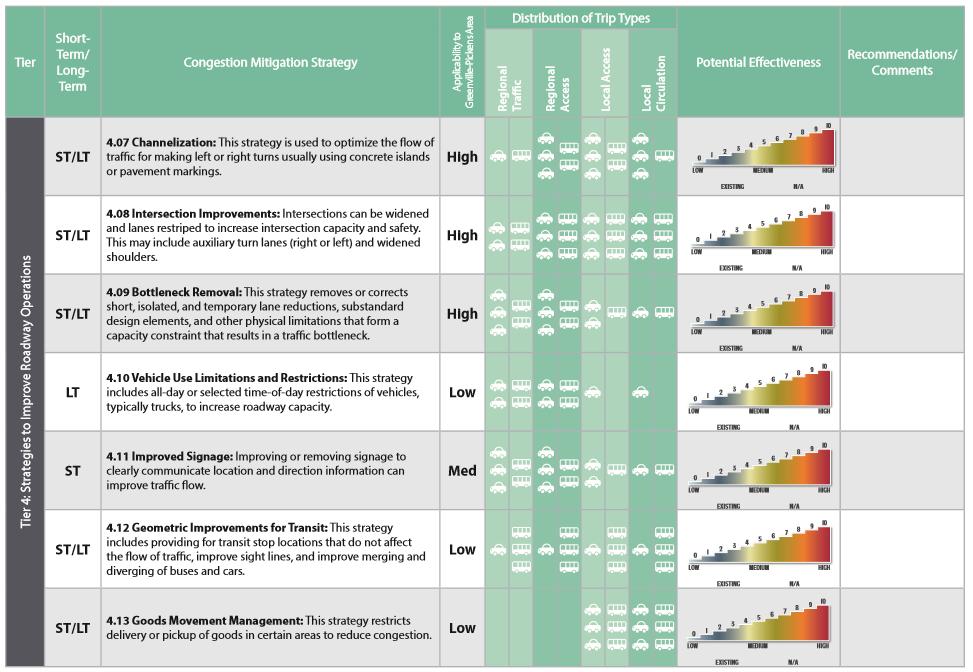
36 Intelligent Transportation Systems (ITS) Strategies The strategies in ITS use new and emerging technologies to mitigate congestion while improving safety and environmental impacts. Typically, these systems are made up of many components, including sensors, electronic signs, cameras, controls, and communication technologies. ITS strategies are sets of components working together to provide information and allow greater control of the operation of the transportation system. The following strategies are included in the toolbox. Dynamic Messaging: Dynamic messaging uses changeable message signs to warn motorists of downstream queues; it provides travel time estimates, alternate route information, and information on special events, weather, or accidents. Advanced Traveler Information Systems (ATIS): ATIS provide an extensive amount of data to travelers, such as real-time speed estimates on the Web or over wireless devices and transit vehicle schedule progress. It also provides information on alternative route options. Integrated Corridor Management (ICM): This strategy, built on an ITS platform, provides for the coordination of the individual network operations between parallel facilities creating an interconnected system. A coordinated effort between networks along a corridor can effectively manage the total capacity in a way that will result in reduced congestion. Transit Signal Priority (TSP): This strategy uses technology located onboard transit vehicles or at signalized intersections to temporarily extend green time, allowing the transit vehicle to proceed without stopping at a red light. Transportation Systems Management Strategies Transportation Systems Management (TSM) strategies identify operational improvements to enhance the capacity of the existing system. These strategies typically are used together with ITS technologies to better manage and operate existing transportation facilities. The following strategies are included in the toolbox. Traffic Signal Coordination: Signals can be pre-timed and isolated, pre-timed and synchronized, actuated by events (such as the arrival of a vehicle, pedestrian, bus, or emergency vehicle), set to adopt one of several pre- defined phasing plans based on current traffic conditions, or set to calculate an optimal phasing plan based on current conditions. Channelization: This strategy is used to optimize the flow of traffic for making left or right turns usually using concrete islands or pavement markings. Intersection Improvements: Intersections can be widened and lanes restriped to increase intersection capacity and safety. This may include auxiliary turn lanes (right or left) and widened shoulders. 36
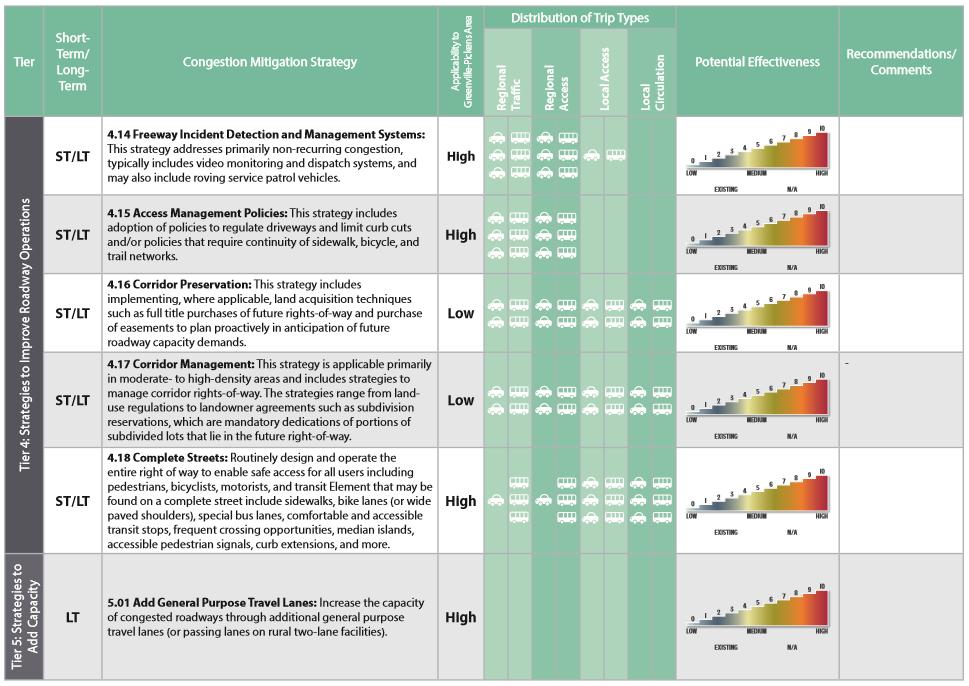
37 Bottleneck Removal: This strategy removes or corrects short, isolated, and temporary lane reductions, substandard design elements, and other physical limitations that form a capacity constraint that results in a traffic bottleneck. Vehicle Use Limitations and Restrictions: This strategy includes all-day or selected time-of-day restrictions of vehicles, typically trucks, to increase roadway capacity. Improved Signage: Improving or removing signage to clearly communicate location and direction information can improve traffic flow. Geometric Improvements for Transit: This strategy includes providing for transit stop locations that do not affect the flow of traffic, improve sight lines, and improve merging and diverging of buses and cars. Intermodal Enhancements: Coordinating modes makes movement from one mode to the other easier. These enhancements typically include schedule modification to reduce layover time or increase the opportunity for transfers, creation of multimodal facilities, informational kiosks, and improved amenities at transfer locations. Goods Movement Management: This strategy restricts delivery or pickup of goods in certain areas to reduce congestion. Incident Management Strategies Freeway Incident Detection and Management Systems: This strategy addresses primarily non-recurring congestion, typically includes video monitoring and dispatch systems, and may also include roving service patrol vehicles. Access Management Strategies Access Management Policies: This strategy includes adoption of policies to regulate driveways and limit curb cuts and/or policies that require continuity of pedestrian, bicycle, and trail facilities. Corridor Preservation/Management Strategies Corridor Preservation: This strategy includes, where applicable, land acquisition techniques such as full title purchases of future rights-of-way and purchase of easements to plan proactively in anticipation of future roadway capacity demands. Corridor Management: This strategy is applicable primarily in moderate- to high-density areas and includes strategies to manage corridor rights-of-way. The strategies range from land-use regulations to landowner agreements such as subdivision reservations, which are mandatory dedications of portions of subdivided lots that lie in the future right-of-way. 37

38 Strategies to add capacity are the costliest and least desirable strategies and should be considered last resort methods for reducing congestion. As the strategy of cities trying to build themselves out of congestion has not provided the intended results, capacity-adding strategies should be applied after determining the demand and operational management strategies identified earlier are not feasible solutions. The key strategy is to increase the capacity of congested roadways through additional general purpose travel lanes. Increase the capacity of congested roadways through additional general purpose travel lanes. Increase the capacity of the system through new roadway facilities. CMP Safety Mitigation The GPATS CMP process includes safety issues in the identification of congested corridors by making use of crash data produced by SCDOT. This system produces reports by crash type or cause which can be used to identify safety issues on the major roadway network for both congested and non-congested roadways. Reducing the number of crashes that occur on major roadways can reduce nonrecurring congestion. While the delay incurred resulting from crashes cannot be determined easily, it is a significant contribution of delay on major roadways. Congestion Mitigation Matrix The CMP Strategy Matrix is used to address recurring congestion. The matrix, included in the Supporting Materials, shows strategies in five tiers as identified in the CMP Strategy Toolbox[AW3]. The CMP Strategy Matrix typically is used in a workshop setting with agency stakeholders to quickly screen through the strategies in order to identify appropriate strategies that may provide a benefit within the corridor. Following the screening of a corridor using the matrix, strategies which were identified as having a high level of potential benefit or medium level of potential benefit are considered for additional analysis where appropriate. The CMP Strategy Matrix identifies the general level of applicability by mode given the different trip types as follows: Regional Trips: Long distance trips and/or pass-through trips through the county. Typically, these trips are auto dependent unless served by premium transit modes. Regional Access Trips: Moderate distance trips that have at least one trip end (origin or destination) within the corridor. Typically, these trips are auto dependent. Local Access Trips: These are shorter trips with at least one trip end within the corridor. Typically, the bicycle mode can compete favorably with the auto modes of travel relative to travel time. Local Circulation Trips: These are very short trips where both trip ends likely occur within proximity to the corridor. Typically, walking and bicycling have travel times comparable to auto usage. Public transportation is typically not viable in the absence of frequent local circulator transit service since walking times are of relatively short duration. 38
39 Prioritization and Future Effectiveness GPATS Congested Corridor Prioritization As part of the CMP, ten corridors were identified that measured at a level where volume overtook capacity by a significant amount. Each corridor was then compared against the toolbox of strategies in Chapter 7 to determine the best mitigation measures for that facility. The identified corridors can be found in Figure 8-1. The identified strategies for each corridor as well as a comparison of the identified congested corridors with TIP funded projects can be found in Table 8-1 on the following pages. It should be noted that not every project is funded, or has even been identified as a potential project. In these cases, GPATS should look into other ways of funding for those projects in dire need of mitigation. Monitoring and Future Effectiveness The FHWA guidelines call for CMPs to include provisions to monitor the performance of strategies selected to address congestion. Regulations require a process for periodic assessment of the efficiency and effectiveness of implemented strategies, in terms of the area s established performance measures. This step of the process helps determine whether operational or policy adjustments are needed to make the current strategies work better and provides information about how various strategies work in order to implement future approaches within the CMP study area. Data collection and performance monitoring are ongoing with the various periodic assessments of roadway, transit, bicycle/pedestrian/trail, freight network performance in the region. However, this CMP also identifies the need for a process that supports the routine tracking of the effectiveness of the applied congestion mitigation strategies and the multimodal transportation system as a whole. In future updates to the CMP, GPATS should continue to track the performance of the ten corridors with identified congestion concerns. Using the most updated travel demand model information, GPATS should also continue to reassess potential areas of congestion to determine whether additional corridors should be added to this list. State and federal performance measures are primarily focused around the National Highway System (NHS) network, shown in Figure 8-2. Coordination should be maintained between the LRTP, TIP, and the CMP to ensure these measures are being documented. At this time, the performance measurement process is in its early stages. Subsequent updates to the LRTP, TIP and CMP will serve as opportunities to document trends in the region s performance. Understanding these trends will allow for a more effective identification of future recommendations to help direct resources to where they are most needed. 39

40 Figure 10: Identified Congested Corridors 40
41 Identified Appendix E: Congestion Management Process Identified in Financially Congestion Prioritization Financial Constraint Roadway Prioritization Project Strategies Constrained Plan Rank Rank Corridor Limits Horizon Year ID Type Project Scope Type of Strategy Strategy Project Cost (millions) Project Cost Anticipated YOE Costs High Potential High Occupancy Vehicle Lanes High Potential Managed Lanes High Potential Advanced Traveler Information Systems (ATIS) 1 N/A N I-85 From: I-85 Exit #36A/51C High Potential Freeway Incident Detection and Management Policies N/A N/A N/A N/A To: I-85 Exit #54 High Potential Add General Purpose Travel Lanes Medium Potential Ridesharing (Carpools & Vanpools) Medium Potential Park-and-Ride Lots Medium Potential Dynamic Messaging N/A N/A N/A 2 8 HWY 357 Widen to four lanes due High Potential Intersection Improvements From: Sunnyside Dr Widening to 2040 congestion, High Potential Add General Purpose Travel Lanes To: Holly Springs Rd intersection Medium Potential Corridor Preservation $27.03 $27,026,688 $46,011,000 High Potential Integrated Corridor Management (ICM) High Potential Intersection Improvements High Potential Access Management Policies High Potential Complete Streets 3 7 Woodruff Road From: Verdae Blvd High Potential Add General Purpose Travel Lanes Widening 7 Lanes To: SC HWY 14 Medium Potential Implementing Premium Transit $5.37 $5,369,355 $6,604,000 Medium Potential Providing Real-Time Information on Transit Routes Medium Potential Traffic Signal Coordination Medium Potential Geometric Improvements for Transit Medium Potential Corridor Preservation High Potential High Occupancy Vehicle Lanes High Potential Managed Lanes High Potential Advanced Traveler Information Systems (ATIS) High Potential Freeway Incident Detection and Management Policies 4 N/A S I-85 From: I-85 Exit #51A High Potential Add General Purpose Travel Lanes N/A N/A N/A N/A To: I-85 Exit #56 Medium Potential Implementing Premium Transit N/A N/A N/A Medium Potential Ridesharing (Carpools & Vanpools) Medium Potential Park-and-Ride Lots Medium Potential Dynamic Messaging Medium Potential Intersection Improvements High Potential High Occupancy Vehicle Lanes High Potential Managed Lanes High Potential Advanced Traveler Information Systems (ATIS) High Potential Freeway Incident Detection and Management Policies 5 16 N I-385 From: I-385 Exit #35 High Potential Add General Purpose Travel Lanes Unfunded 128 General Improvement Pavement Rehabilitation To: I-385 Exit #39 Medium Potential Implementing Premium Transit $11.46 $11,458,723 $23,293,000 Medium Potential Ridesharing (Carpools & Vanpools) Medium Potential Park-and-Ride Lots Medium Potential Dynamic Messaging Medium Potential Intersection Improvements High Potential High Occupancy Vehicle Lanes High Potential Managed Lanes High Potential Advanced Traveler Information Systems (ATIS) High Potential Freeway Incident Detection and Management Policies 6 16 S I-385 From: I-385 Exit #37 High Potential Add General Purpose Travel Lanes Unfunded 128 General Improvement Pavement Rehabilitation To: I-385 Exit #31 Medium Potential Implementing Premium Transit $11.46 $11,458,723 $23,293,000 Medium Potential Ridesharing (Carpools & Vanpools) Medium Potential Park-and-Ride Lots Medium Potential Dynamic Messaging Medium Potential Intersection Improvements 41
42 Unidentified Appendix E: Congestion Management Process 7 N/A 8 29 Haywood Rd/Howell Rd 9 N/A I-85 Verdae Blvd/Roper Mountain Rd Fairview Rd From: I-85 Exit #40 To: I-85 Exit #46 From: Edwards Rd To: Woods Lake Rd From Salters Rd To: Riley Smith Dr From I-385 Exit #27 To: SC HWY 418 High Potential High Occupancy Vehicle Lanes High Potential Managed Lanes High Potential Advanced Traveler Information Systems (ATIS) High Potential Freeway Incident Detection and Management Policies N/A N/A N/A N/A High Potential Add General Purpose Travel Lanes Medium Potential Implementing Premium Transit Medium Potential Ridesharing (Carpools & Vanpools) Medium Potential Park-and-Ride Lots Medium Potential Dynamic Messaging Medium Potential Intersection Improvements N/A N/A N/A High Potential Channelization High Potential Intersection Improvements High Potential Access Management Policies High Potential Complete Streets High Potential Add General Purpose Travel Lanes Unfunded 89 Access Management Access Management Medium Potential Implementing Premium Transit Medium Potential Providing Real-Time Information on Transit Routes Medium Potential New or Enhanced Sidewalk Medium Potential Designated Bicycle Lanes on Facilities or Routes Medium Potential Ridesharing (Carpools & Vanpools) Medium Potential Dynamic Messaging Medium Potential Integrated Corridor Management (ICM) $2.97 $2,968,088 $6,034,000 High Potential Intersection Improvements High Potential Add General Purpose Travel Lanes N/A N/A N/A N/A Medium Potential New or Enhanced Sidewalk Medium Potential Designated Bicycle Lanes on Facilities or Routes Medium Potential Traffic Signal Coordination Medium Potential Channelization Medium Potential Access Management Policies Medium Potential Corridor Preservation Medium Potential Complete Streets N/A N/A N/A High Potential Intersection Improvements High Potential Add General Purpose Travel Lanes Unfunded 17 General Improvement Improved 2 lane Medium Potential Channelization Medium Potential Access Management Policies Medium Potential Complete Streets $2.66 $2,659,408 $5,406,000 42
43 Figure 11: National Highway System Network 43
44 Supporting Materials Federal CMP Regulations The following section summarizes the Federal requirements for a Congestion Management Process in Transportation Management Areas. This guidance is codified in the Code of Federal Regulations (CFR (Section ) Statewide Transportation Planning; Metropolitan Transportation Planning; Final Rule). While the entire GPATS MPO area is not required to prepare a CMP[AW4], the federal regulations provide useful guidance as to the types of information that are most helpful for this process. The transportation planning process in a TMA shall address congestion management through a process that provides for safe and effective integrated management and operation of the multimodal transportation system. Cooperatively developed and implemented Travel reduction strategies Operational management strategies a) The CMP should result in multimodal system performance measures and strategies that can be reflected in the metropolitan transportation plan and the TIP. b) Acceptable levels of service may vary from area to area. In addition, consideration should be given to the following strategies: Manage demand Reduce single occupant vehicle travel Improve transportation system management and operations Improve efficient service integration within and across the following modes: i. Highway ii. Transit iii. Passenger and freight rail operations iv. Non-motorized transport Where general purpose lanes are determined to be appropriate, must give explicit consideration to features that facilitate future demand management strategies. c) The CMP shall be developed, established, and implemented in coordination with Transportation Systems Management (TSM) and operations activities. The CMP shall include: Methods to monitor and evaluate the performance of the multimodal transportation system i. Identify the underlying causes of congestion ii. Identify and evaluate alternative strategies iii. Provide information supporting the implementation of actions iv. Evaluate the effectiveness of implemented actions Definitions of congestion management objectives and appropriate performance measures to assess the extent of congestion and support the evaluation of the effectiveness of strategies. Performance measures should be tailored to the specific 44
45 Appendix E: Congestion Management Process needs of an area and established cooperatively by the State, MPOs, and operators of major modes of transportation, including providers of public transportation. Establishment of a coordinated program for data collection and system performance monitoring to define the extent and duration of congestion. To the extent possible, this program should be coordinated with existing sources, including providers of public transportation. Identification and evaluation of the anticipated performance and expected benefits of congestion management strategies that will contribute to the more effective use and improved safety of the existing and future transportation system. Examples of strategies to consider include: i. Demand management measures, including growth management and congestion pricing ii. Traffic operational improvements iii. Public Transit improvements iv. Information Technology Services (ITS) technologies v. Where necessary, additional system capacity Identification of an implementation schedule, implementation responsibilities, and possible funding sources for each strategy. Implementation of process for periodic assessment of the effectiveness of implemented strategies. Results of this assessment shall be provided to decision makers and the public to provide guidance on the selection of effective strategies for future implementation. d) TMAs designated as nonattainment for ozone or carbon monoxide may not program Federal funds for any project that will result in a significant increase in the carrying capacity of Single Occupant Vehicles (SOVs), with the exception of safety improvements or the elimination of bottlenecks (within the limits of the appropriate projects that can be implemented). e) In TMAs designated nonattainment for ozone or carbon monoxide, the CMP shall provide an appropriate analysis of reasonable (including multimodal) travel demand reduction and operational management strategies for a corridor in which a project with a significant increase in SOV capacity is proposed to move forward with Federal funds. f) State laws, rules, and regulations pertaining to congestion management systems or programs may constitute the congestion management process, if FHWA and FTA find that these are consistent with the intent of this process. g) Congestion management plan. A MPO serving a TMA may develop a plan that includes projects and strategies that will be considered in the TIP of such MPO. Such plan shall: Develop regional goals to reduce miles traveled during peak commuting hours and improve transportation connections between areas with high job concentration and areas with high concentrations of low-income households; Identify existing public transportation services, employer based commuter programs, and other existing transportation services that support access to jobs in the region; and Identify proposed projects and programs to reduce congestion and increase job access opportunities. 45
46 In developing the CMP, an MPO shall consult with employers, private and nonprofit providers of public transportation, transportation management organizations, and organizations that provide job access reverse commute projects or job-related services to low-income individuals. 46
![[AW5]](/docs-images/86/94711150/images/47-2.jpg)
47 [AW5]
48
49
50
51 51
52 52
53 53
54 54
![[AW6] 55](/docs-images/86/94711150/images/55-2.jpg)
55 [AW6] 55
![[AW7] 56](/docs-images/86/94711150/images/56-2.jpg)
56 [AW7] 56