Linking Planning to Programming
|
|
|
- Neil Carpenter
- 5 years ago
- Views:
Transcription


1 AASHTO SCOP Corridor Profile Studies Linking Planning to Programming Dave Perkins, Kimley-Horn P2P Link


 Prioritization of Needs and")


2 Corridor Performance-Based Needs Assessment Primary Measure Pavement Bridge Mobility Safety Freight Performance Area Indices To Define Corridor Health and Identify Need Corridor Performance Segment Maps Statewide Performance and Needs (by others) Prioritization of Needs and Solution Sets Secondary Measures Additional Performance Measures To Diagnose Needs Corridor Performance Segment Maps Package Solution Sets Project Life Cycle and Risk Analysis Drill Down Analysis Additional data sets as required to evaluate nature of need Itemized Performance- Based Needs Formulate Potential Causes and Solutions P2P Link and Recommended Program
3 Performance Areas (related to MAP-21 and ADOT Annual Performance Report) Pavement Bridge Mobility Safety Freight
4 Performance Area Secondary Measures Primary Measure Measure Indicator Performance Area Index Indicator Indicator Measure Measure Indicator Indicator Indicator Measure Indicator Indicator Indicator


5 Corridor and System Health Primary Measure used to evaluate relative health and indexed to make comparative analysis to healthy conditions Secondary Measures provide diagnostic information to help identify causes and potential solutions


6 Secondary Measures Primary Measure Directional Pavement Serviceability Directional PSR Pavement Performance Area Pavement Index Pavement Serviceability Pavement Failure % of pavement below thresholds for IRI or Cracking Pavement Distress Pavement Hot Spots PSR or PDI at critical threshold
7 Primary Measure: uses combination of PSR (International Roughness Index) and PDI (Cracking) Data Source: current ADOT pavement database Calculation of Pavement Index: combination of both directions of travel and weighted by # of lanes Pavement Index Score: Good/Fair/Poor based on ADOT performance thresholds for PSR and PDI Secondary Measures: breaks PSR into each direction and help identify hot spots Pavement Performance Area Pavement Directional PSR % Area Segment Index EB WB Failure % % % % % % % % % % % % % % Wtd Avg % Good > 3.75 > 3.75 < 5% Fair % - 20% Poor < 3.2 < 3.2 > 20%
8
9 Bridge Performance Area Secondary Measures Primary Measure Bridge Sufficiency Sufficiency Rating Deck Rating Superstructure Rating Bridge Index Functionally Obsolete Bridges % Deck on Functionally Obsolete Bridges Substructure Rating Structural Evaluation Rating Bridge Hot Spots Structurally Deficient Bridges (map locations)
10 Primary Measure: uses 4 measures to assess health of each bridge Data Source: current ADOT bridge database Calculation of Bridge Index: calculated for each segment; weighted by deck area Bridge Index Score: Good/Fair/Poor based on established ADOT performance thresholds Secondary Measures: will provide supplemental information and identify hot spots Bridge Performance Area % Bridges Bridge Bridge Functionally Segment Index Sufficiency Obsolete % % % % % % % % % % % % % % Wtd Avg % Good > 6.5 > 80 < 15% Fair % - 45% Poor < 5.0 < 50 > 45%
11
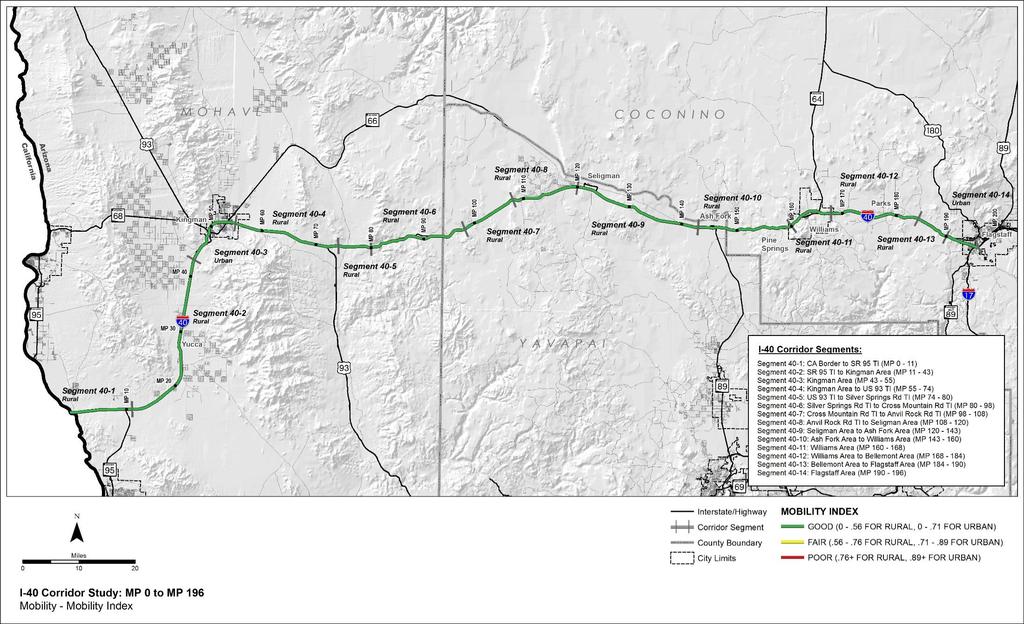
12 Mobility Performance Area Secondary Measures Primary Measure Peak Congestion Design Hour Volume Current V/C Mobility Index Current V/C Future V/C Future Traffic Travel Time Reliability Travel Time Index (car) Future V/C Travel Time Index (truck) % ADT Growth Non-Recurring Congestion Vertical Grades Multimodal Opportunities Transit Model Non-SOV Opportunities
13 Primary Measure: Considers both current and future traffic volumes compared to capacity Data Sources: HPMS (current) AZTDM2 (future) Calculation of Mobility Index: Average of Current and Future Volume to Capacity Ratio Resulting Mobility Index Score: Good/Fair/Poor based on Highway Capacity Manual, using Urban/Rural values for Level of Service Secondary Measures: Peak Congestion Future Traffic Volume Travel Time Reliability (cars & trucks) Multimodal Opportunities Future Daily V/C Existing Peak Hour V/C Mobility Performance Area Closure Extent (instances/ milepost/year/ mile) Directional TTI (all vehicles) Directional PTI (all vehicles) % Non- Single Occupancy Vehicle (SOV) Opportuniti es Mobility Segment Index EB WB EB WB EB WB EB WB % % % % % % % % % % % % % % Wtd Avg % Good < 0.71 (0.56) < 0.26 < 1.15 < 1.3 > 17% Fair 0.71 (0.56) (0.76) % - 17% Poor > 0.89 (0.76) > 1.53 > 1.33 > 1.5 < 11%
14
15
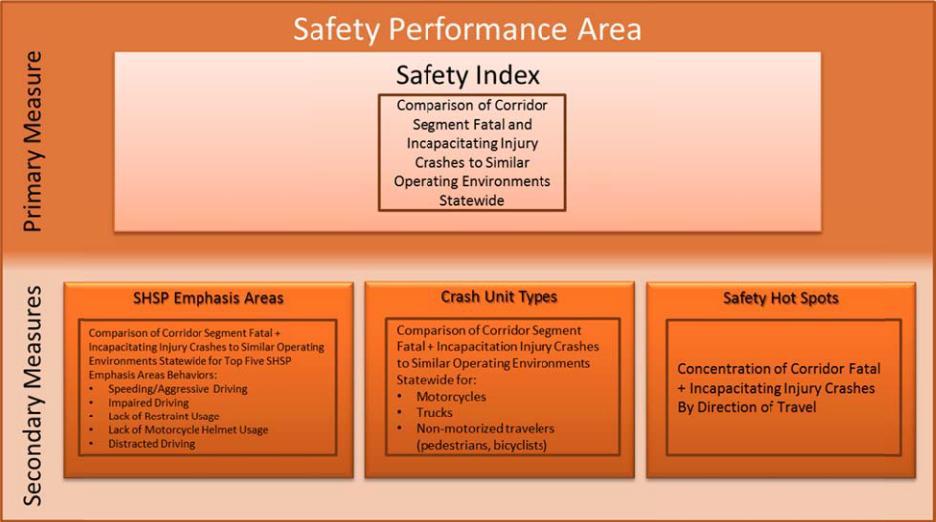
16 Primary Measure: Fatal crashes economic cost of $5.8M/crash Serious injury crashes economic cost of $400K/crash Data Source: Most current 5 full calendar years of ADOT statewide crash database Calculation of Safety Index: Calculated frequency and rate indices for each segment and for similar statewide segments; Combined equally weighted frequency and rate; Normalized against statewide average for segment type Resulting Safety Index Score: Above Average/ Average/Below Average based on comparison to statewide average for segment type Secondary Measures: May help identify hot spot issues or how to improve safety in emphasis areas Safety Performance Area % of Fatal + Incapacitating Injury Crashes Involving SHSP Top 5 Emphasis Areas Behaviors % of Fatal + Incapacitating Injury Crashes Involving Trucks Segment Safety Index % 10.0% % 24.0% % 11.0% % 8.0% % 25.0% % 18.0% % 10.0% % 15.0% % 12.0% % 16.0% % 13.0% % 0.0% % 25.0% % 25.0% Wtd Avg % 14.6% Good > 1.2 < 52 (45)% < 6 (12)% 52 (45)% (12)% - 14 Fair (53)% (16)% Poor < 0.8 > 61 (53)% > 14 (16) %
17
18
19 Primary Measure: focuses on two aspects of travel time reliability Truck travel time index (TTTI) ratio of peak period to free-flow travel time [reflects typical peak period delay due to congestion] Truck planning time index (TPTI) ratio of total time needed for 95% on-time arrival to free-flow travel time [reflects extra buffer time needed] Data Sources: HERE truck travel time data derived from GPS in trucks Data Update Schedule: Updates available monthly through FHWA program Calculation of Freight Index: TTTI / TPTI Resulting Freight Index Score: Good/Fair/Poor based on ADOT Annual Performance Report thresholds Secondary Measures: May help identify hot spot issues or freight restrictions Freight Performance Area Directional TTI (trucks only) Directional PTI (trucks only) Closure Duration (hours/ milepost closed/year/ mile) Freight Segment Index EB WB EB WB Wtd Avg Good > 0.77 < 1.15 < 1.3 < Fair Poor < 0.67 > 1.33 > 1.5 >18.55
20
21

22 100% 13% 6% 0% 0% 90% 28% 80% 70% 41% 60% 50% 40% 89% 100% 37% 100% Poor (%) Fair (%) Good (%) 30% 20% 46% 35% 10% 0% 5% Pavement Index Bridge Index Mobility Index Safety Index Freight Index
23 Finalize performance index and secondary measures to define baseline performance in Working Paper 2 Establish performance objectives to define needs and recommend solution sets Perform a Life Cycle Cost and Risk Assessment to identify the most strategic recommendations for each corridor Prioritize the recommendations using the P2P process and provide a prioritized ranking for consideration during the Long Range Plan update