Summary of Technical Memoranda 6a, 6b, and 7 for the Stakeholder Advisory Group. July 25, 2007
|
|
|
- Colleen Erika Fleming
- 5 years ago
- Views:
Transcription


1 1 Summary of Technical Memoranda 6a, 6b, and 7 for the Stakeholder Advisory Group July 25, 2007
2 2 Presentation Overview 1. Review of the Multi-County Goods Movement Action Plan (MCGMAP) study area and objectives 2. Discussion of initial findings (including Technical Memorandum 7) 3. Summary of Technical Memoranda 6a and 6b 4. Conclusions and next steps

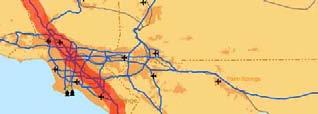
3 MCGMAP Study Area 3
4 4 Overview of Action Plan Objectives > Use systems approach to goods movement > Achieve simultaneous infrastructure and air quality improvement > Build plan using market segment approach > Improve mobility; reduce congestion > Develop win-win solutions > Find a funding balance of both public and private sources > Build consensus


5 5
6 6 Building an Action Plan 8. Multi-County Goods Movement Action Plan 5. Community, Environmental, & Economic Impacts 4. Assess Growth in Freight Demand 3. Compile and Collect Goods Movement Data 2. Outreach Assistance 6. Strategies for Improving Goods Movement 1. Project Management / Administration 7. Mitigating the Effect of Goods Movement
7 Findings 7
8 Issues Community Concerns about Environmental and Health Impacts Port and Airport Facility Efficiency, Capacity and Throughput Highway Congestion, Delay and Maintenance Truck Access and Turnaround Times at Goods Movement Facilities Mainline Rail Capacity Rail Intermodal Capacity Constraints Grade Crossings Truck Safety Changes in Regional Shipping and Transloading Shifting of Land Uses and Development Patterns System-wide Goods Movement Data and Information Security Availability of Funding A Disparate Goods Movement System and Community 8
9 Environmental Mandate Reduce environmental impacts of goods movement and protect public health Core Mandates Mobility Mandate Assure the safe and efficient movement of all modes of travel Economic Mandate Maintain economic vitality of the region and role of goods movement as employer Funding Mandate Fair share of public funds and assure that the private sector pays its fair share 9
10 1 Four Groups of Actions ACCELERATE Regional Environmental Mitigation 1) Project specific mitigation 2) Broader regional strategies INVEST STRATEGICALLY in Infrastructure 1) Target market segments 2) Reduce reliance on trucking PROMOTE FAIR-SHARE Public/Private Financing 1) Federal/state 2) Private sector contribution CAPITALIZE on Operational Efficiencies Marine terminal operations, truck turn times, intermodal operations, highway operations
11 Acceleration of Regional Environmental Mitigation > Tech Memo 7 presents a list of potential mitigation measures > The Action Plan anticipates the endorsement of Agency Environmental plans 11
12 Community Concerns about Environmental and Health Impacts MITIGATION STRATEGIES (Examples) PROJECT MITIGATION Project specific impacts Land use policy, codes BROADER REGIONAL STRATEGIES On-dock rail, mainline rail capacity, fleet replacement, Maximize PierPass,, etc. Alternative technologies, operational changes, new and innovative approaches 12
13 Agency Environmental Plans Plan Cal/EPA-BTH GMAP CARB Emissions Reduction Plan MCGMAP SCAQMD AQMP Ports CAAP Focus Statewide GM Statewide Ports & GM Emissions Study Area GM South Coast Air Basin Emissions San Pedro Bay Ports Emissions 13
14 Strategic Investment 14
15 15 Implementation Plan Implementation of of actions to to follow.. Strategic means to to address Market Segmented Approach Truck Issues Environmental Mitigation Fair Share Funding


16 16 Modal Market Segments Modal Market Segments Only Truck At least one truck trip Only Rail * All percentages estimated based on 2005 data.
17 17 Strategic means to to address Truck Issues Hwy Operations & Capacity General purp. hwy network Innovative Strategies 1) Inland staging areas (inland port); 2) Separated corridor (truck lanes, rail, maglev, other shuttle technologies); 3) Clean fuels & efficient vehicles (LNG trucks, maglev, LNG locomotives); 4) Warehouse clustering around inland port. Maximize On-Dock Rail Minimize local truck drayage

 State and Federal contributions; 2) User fees; 3) Port assessed or")
18 18 Strategic means to to address Fair-Share Funding Minimal Opportunity for Fair-Share Contributions Traditional funding sources already strained Moderate Opportunity for Fair-Share Contributions Target regional truck markets Maximum Opportunity for Fair-Share Contributions Target intermodal rail market to increase: 1) State and Federal contributions; 2) User fees; 3) Port assessed or container fees
19 Funding Options > Traditional grant & loan programs > New Federal funding opportunities (2009 reauthorization) > State General Obligation bonds Prop. 1B > $2 billion for goods movement infrastructure > $1 billion for trade-related related emissions reductions > Other categories 19
20 Technical Memorandum 6a: Evaluation of Initial Goods Movement Strategies 20
21 Role of Scenarios in Evaluation Impact of of Port Growth Projects evaluated assumed implemented under Scenario 4 1. High Growth - Current Investment Levels Scenarios 2. Low Growth Current Investment Levels 3. Mod Growth Current Investment Levels 4. High Growth Full Investment Levels Are Are Trade Policies Effective as as a Singular Congestion Management Strategy? 21
22 Role of Scenarios in Evaluations > Committed funding plans of the MCGMAP project partners represent the current investment levels specified under Scenarios 1, 2, and 3 > The full investment levels would require additional investment beyond the existing committed funding plans > Therefore, projects and strategies evaluated are assumed to be implemented under Scenario 4 22
23 Economic Impacts of Scenarios > Value and Share of Trade, Los Angeles Customs District, ($billions) 2005: $293.9 billion 2030: $794.5 billion Breakbulk Ship $ % Air Cargo $ % Land Based $ % Breakbulk Ship $ % Air Cargo $ % Land Based $ % Containerized Ship $ % Containerized Ship $ % Source: Los Angeles Customs District & Economics & Politics, Inc. 23
24 Economic Impacts of Scenarios (Jobs) > Scenario 1: Total 2030 employment impact of trade through the ports would be 1,601,476 jobs. > Scenario 2: Total 2030 employment impact of trade through the ports would be 1,013,101 jobs (-36.7% impact). > Scenario 3: Total 2030 employment impact of trade through the ports would be 1,303,490 jobs (-18.6% impact). > Scenario 4: Identical to Scenario 1. 24
25 System Performance of Scenarios > Scenario 1: Described in TM4b. > Scenarios 2 and 3: Analytical results would not be accurate based on travel demand model limitations. > It is clear there is a link between port container traffic and truck traffic within, into, and out of the region. > From a technical standpoint, there is no direct linkage (currently) between travel demand model generated regional truck traffic and SPB Port trade volume forecasts. > Scenario 4: Presented in TM6b (later in this presentation). 25
26 TM6a Summary > A list of 249 projects and strategies were initially identified (discussed at 8/7/06 SAG Meeting) > A broad, comprehensive list of projects and strategies was developed > The list includes innovative and non-traditional as well as traditional strategies > Qualitative evaluation performed > 15 categories of projects and strategies > 26 evaluation criteria > Resulting in eight projects and strategies for detailed evaluation 26
27 Technical Memorandum 6b: Evaluation of Detailed Goods Movement Strategies > Detailed evaluation of eight projects and strategies > Evaluation performed to answer specific questions > Regional travel demand model and land use databases used for technical evaluation 27
28 Projects & Strategies Evaluated 1. Expansion of On-Dock Rail at Ports: All detailed evaluations assume this project and strategy is in place. 2. Additional Intermodal Facilities / Freight Yards: All detailed evaluations assume this project and strategy is in place. 3. Implement Alternative Technologies to Additional Intermodal Terminals: The effects of alternative technologies (e.g. non-truck systems) to link the Ports to inland intermodal terminals. 4. Construction of Exclusive Truck Lanes: The effects of dedicated freight guideways (e.g. exclusive truck lane systems) along major regional goods movement corridors. This also includes the potential toll revenue generation. 28
29 Projects & Strategies Evaluated (Continued) 5. Allow Use of LCVs on Dedicated Facilities: The effects (in terms of potential toll revenue generation) of LCVs on dedicated facilities (e.g. truck lanes or a dedicated freight guideway system). 6. Additional Freeway Lanes/Capacity: The effects of adding general purpose mainline capacity along regional highways. This includes HOV systems. 7. Additional Freeway Operational/Safety Improvements: The effects of operational / safety (e.g. auxiliary lanes, truck climbing lanes) along regional highways. 8. Increase Port/Rail Yard Freight Capacity: All detailed evaluations assume this project and strategy is in place. 29
30 30 Dedicated Truck Lanes Cost effective investment? User Fees Key Questions What share of costs offset by user fee financing? Policies & Obstacles What policies enhance truck lane feasibility? Other Alternatives Are truck lanes a preferable alternative? Route Options What are effects of truck lanes on sub-regions?
31 31 Travel Demand Model Evaluation > Answers the questions: Dedicated Truck Lanes Cost effective investment? Other Alternatives Are truck lanes a preferable alternative? Route Options What are effects of truck lanes on sub-regions?
32 Project Bundles for Evaluation 1. Operational and safety improvements: Strategic freeway widening, bottleneck relief, auxiliary lanes, interchange improvements on freeways carrying heavy flows of truck traffic. 2. Dedicated truck lanes: I-710 > SR-60 > I Dedicated truck lanes: I-710 > I-10 > I Dedicated truck lanes: I-710 > SR-91 > I Dedicated truck lanes: I-710 > I-10 (WB) / SR-60 (EB) > I Dedicated truck lanes: I-710 > SR-91 > SR-57 > SR-60 > I-15 32
33 Project Bundles for Evaluation 7. Dedicated truck lanes: I-710 > SR-91 > I-605 > I- 10 > I Dedicated truck lanes: I-5 (I-710 to Kern County) 9. Dedicated truck lanes: I-5 (U.S./Mexico Border to Kern County) 10.Mixed-flow toll expressways: I-710 > SR-60 > I Alternative technologies: (e.g. Shuttle Trains, Maglev) between POLA/POLB and inland destinations 12.Dedicated truck lanes: I-15 (U.S./Mexico Border to Victorville) 33


34 Three Primary Routes of Truck Lane Bundles SPB Ports to Victorville 34
35 Travel Demand Model Evaluation 2 I-710 to SR-60 to I ,248 11,872 75, ,627 54,563 3 I-710 to I-10 to I ,740 11,195 70, ,168 55,506 4 I-710 to SR-91 to I ,329 10,542 71, ,455 56,745 I-710 to I-10 (WB) / 5 SR-60 (EB) to I ,080 10,328 78, ,397 47,248 I-710 to SR-91 to SR to SR-60 to I ,447 9,688 67, ,006 49,729 I-710 to SR-91 to I to I-10 to I ,935 10,328 68, ,079 56,415 I-5 (I-710 to Kern 8 County) ,752 12,328 90, ,735 62,541 I-5 (U.S./Mexico Border to Kern ,425 10,679 88, ,202 56,099 9 County) I-15 (U.S./Mexico 12 Border to Victorville) ,918 8,594 61, ,443 37,921 SPB Ports to ictor- ville I-5 outes I-15 oute Bundle Description Distance (Miles) Avg. Veh. (ADT, One Direction, Spot Location) Avg. Trucks (ADT, One Direction, Spot Location) Sum of Avg. Veh. & Trucks Entire Route Vehicles (Daily, Both Directions, by Segment) Trucks (Daily, Both Directions, by Segment) * Note: The I-5 and I-15 route information does not include San Diego County data. 35
36 Land Use Evaluation > Schools and Residential Land Uses by Bundle within the SCAG Region SPB Ports to Victor- ville I-5 Routes I-15 Route Bundle Description Schools Residential (Acres) 2 I-710 to SR-60 to I ,933 3 I-710 to I-10 to I ,329 4 I-710 to SR-91 to I ,684 5 I-710 to I-10 (WB) / SR-60 (EB) to I ,702 6 I-710 to SR-91 to SR-57 to SR-60 to I ,533 7 I-710 to SR-91 to I-605 to I-10 to I ,177 8 I-5 (I-710 to Kern County) 31 4,979 9 I-5 (U.S./Mexico Border to Kern County) 78 12, I-15 (U.S./Mexico Border to Victorville) 23 5,500 * Note: The I-5 and I-15 route information does not include San Diego County data. 36
37 37 Land Use Evaluation > Warehouse/Distribution Land Uses by Bundle within the SCAG Region SPB Ports to Victor- ville I-5 Routes I-15 Route Bundle Description Warehouse (Acres) 2 I-710 to SR-60 to I-15 6,290 3 I-710 to I-10 to I-15 3,135 4 I-710 to SR-91 to I-15 4,716 5 I-710 to I-10 (WB) / SR-60 (EB) to I-15 6,767 6 I-710 to SR-91 to SR-57 to SR-60 to I-15 5,057 7 I-710 to SR-91 to I-605 to I-10 to I-15 2,691 8 I-5 (I-710 to Kern County) I-5 (U.S./Mexico Border to Kern County) 3, I-15 (U.S./Mexico Border to Victorville) 3,151 * Note: The I-5 and I-15 route information does not include San Diego County data.
38 38 Advanced Technology Corridor SPB Ports and Victorville Operational Assumptions Advanced Technology Corridor Equiv of Hobart Yard at Victorville 1.35 mil annual lifts 5,400 trucks per day Fixed Guideway System Connects distinct origin & destination Along Bundle 2 alignment (parallel to SR-60) Clean, Advanced Tech Mode


39 39 Impact of Advanced Technology > Reduction in Hours of Delay for Vehicles and Trucks, (Year 2030 Baseline vs. all Bundles)
40 Impact of Advanced Technology Change in ADT Routes Baseline vs Operational vs Advanced Technology Corridor Decrease in truck volumes due to Alternative Technology Little change in truck volumes further from the Ports due to Alternative Technology Staging at Ports (5,400) (4,581) (6,446) (3,065) (278) (940) (536) (1,354) (659) (532) (91) 101 (55) 23 (5,400) Staging at V-VilleV Ville 40
41 41 Summary of Advanced Technology > Overall, substantially less reduction in hours of delay (autos and trucks) for the region > Operational assumptions require 1) fixed origin & destination and 2) an equivalent of the existing Hobart Yard at Victorville > Result is a removal of approximately 5,400 truck trips per day between a fixed O & D > Greatest reduction in truck volumes would occur closest to the Ports > The Ports are a singular origin/destination > Further from the Ports, more O & D pairs overlap > Difficult to isolate market segments and fixed O & D

42 42 Impact of Operational and Safety Improvements Change in ADT Routes Baseline vs Operational & Safety vs Bundle 2 Increase in vehicle volumes due to Operational and Safety improvements Little change in truck volumes due to Operational and Safety improvements
43 43 Operational and Safety Improvements > Trucks: Operational and safety improvements do not affect forecast volumes > Therefore it can be stated that operational and safety improvements would not affect a change in truck travel patterns or volumes along a specific route. > Autos: Operational and safety improvements have the greatest effect on forecast volumes along I-710; with virtually no change to vehicle volumes along other identified segments. > Reflects high volume of trucks along I-710 and the associated benefit of adding additional capacity for vehicles. > However, overall it shows that operational and safety improvements (including mixed-flow lanes) tend to accommodate rather than induce volumes along a specific route. > Similarly, operational and safety improvements would result in a modest increase in hours of delay.
44 44 Potential Toll Revenue Evaluation > Answers the questions: User Fees What share of costs offset by user fee financing? Policies & Obstacles What policies enhance truck lane feasibility?
45 45 Evaluation of Potential Toll Revenue Generation > Percent Trucks Using Toll Lanes for Each Bundle - Year 2030 > Focus on SPB Ports to Victorville routes > Greatest potential truck market for tolling located near the Ports along I-710 > Truck market for tolling directly linked to proximity of warehouse/distribution centers and modal market segmentation > Challenges to implementation exist Bundle Description Toll Market Share for Specific Segments 2 I-710 to SR-60 to I-15 I % to 65% (1) ; SR 60 40%; I-15 18%-28% (2) 3 I-710 to I-10 to I-15 I % to 77% (1) ; I-10 50%; I-15 14%-30% (2) 4 I-710 to SR-91 to I-15 I % to 35%; SR 91 27%-30%; I-15 16%-43% (2) I-710 to I-10 (WB) / SR-60 5 (EB) to I-15 I % to 50% (1) ; SR 60/I-10 30%; I-15 14%-30% (2) I-710 to SR-91 to SR-57 to 6 SR-60 to I-15 I % to 33%; SR 91 30%; SR 60 25%-43%; I-15 16%-43% (2) I-710 to SR-91 to I-605 to I-10 7 to I-15 I %; I %; I-10 28%-35%; I-15 14%-28% (2) (1) Highest share towards northern end of I-710. (2) Lowest share towards northern end of I-15.
46 Evaluation of Potential Toll Revenue Generation > Potential Toll Revenue Generation Year 2030 for a Truck Lane System that Includes an East-West Connection between I-710 and I-15 Toll Rate ($LHDT / $MHDT / Annual Revenue ($millions) $HHDT) Bundle 2 Bundle 3 Bundle 4 Bundle 5 Bundle 6 Bundle 7.10/.20/ /.30/ /.40/ /.50/ /.60/ > Greatest toll revenue generation potential: Dedicated truck lanes on I- 710, SR-60 (EB) / I-10 (WB), and I-15 > Also, dedicated truck lanes on I-710, SR-60, and I-15 > Also, dedicated truck lanes on I-710, I-10, and I-15 > Least toll revenue generation potential: Dedicated truck lanes on I-710, SR-91, SR-57, SR-60, and I-15 > Also, dedicated truck lanes on I-710, SR-91, and I-15 46
47 47 Long-Haul LCV Evaluation > 2030 SCAG Region LCV Volume & VMT from Long-Haul Truck Market Annual Standard Annual LCV Truckloads Annual LCV VMT* Truckloads Triple Short Double Long Triple Short Double Long SCAG Region 22,713,618 15,142,423 11,356,821 1,120,539, ,404,754 Bundle 2 Corridor 2,271,362 1,514,255 1,135, ,396, ,297,914 Note: * Assume Average trip length of 74 miles within the SCAG region and 98 miles for the Corridor. > 2030 Long-Haul LCV revenue estimates: > $64 million if only the Triple Short > $116 million if only the Double Long
48 48 Intra-Regional LCV Evaluation > Port Container LCV Market Daily Truck Trips (2030) > VMT and Revenue Estimates for Container Truck LCVs Total Daily Port Truck Trips* Potential LCV Convertible Trips From Ports 63,051 20,528 To Ports 60,277 11,699 Total 123,328 32,227 Daily Miles Traveled on LCV Facility (VMT) General Location of Staging Area Victorville Colton/I-15 Standard Trucks 88, ,962 Double LCV 44, ,981 Annual Toll Revenue ($ Millions) Market Share 33% 19% 26% Covina 87,892 43, * Source: SCAG Port Truck Trip Model Hobart/East LA 180,757 90, ,231, ,
49 49 Challenges Long-Haul LCV > Not legal in CA > Local ordinances barring LCVs from local streets > Existing infrastructure not designed for LCVs > New staging areas required to assemble/break-down LCVs Inter-Regional LCV > Container LCVs do not exist > New facilities necessary for assembly of Double Container chassis
50 Understanding the Regional Truck Market Annual Truck Trips Daily Truck Trips Share of SCAG Region Market Total SCAG ,000, ,333 Port Generated 39,594, ,981 24% SPB Ports to Victorville Corridor 16,500,000 55,000 10% Long-Haul LCV Market (Total) 22,700,000 75,667 14% Long-Haul LCV Market (SPB to Victorville Corridor) 2,271,362 7,571 1% Port Truck LCV Market 9,668,100 32,227 6% Port Truck LCV Market (Excluding Victorville) 9,397,500 31,325 6% Adjusted Combined LCV Market 11,668,862 38,896 7% Conclusions Based on LCV Toll Revenue Generation > Total potential annual revenue is estimated at $308 million > $115.7 million - long-haul market > $192 million from the port container market > Allowing conventional trucks to run on LCV lanes would increase revenue > $371 Million with 25% of traditional truck toll revenue > $436 Million with 50% of traditional truck toll revenue > $499 Million with 75% of traditional truck tolls revenue 50
51 51 Ability To Pay For Itself What portion can be be user financed? Cost Assumptions Truck Lane Corridor $9-23 Billion $ B -- Ports to Victorville $23 B Mx border to Kern Co. O&M Costs - $6-14Million annual 1.4X Bond Coverage; 5.75% Int.
52 Ability To Pay For Itself $12.00 Other Toll Revenue Bonds $10.00 $ % $Billion $ % 40% Low -- 49% High -- 66% $4.00 $2.00 $0.00 Truck Toll LCV Toll LCV/Truck Toll * 40 Year amortization increases coverage by 13%. 52
53 TM6b Summary > Answered five key questions: > The answers to these questions used to develop the Four Groups of Actions. > TM6b is not an endorsement of truck lanes, LCVs or tolling: > The analysis provides useful information to increase fair-share funding contributions from the users of the regional goods movement system who benefit the most. 53
54 Conclusion > The Draft Action Plan will be prepared and presented > Today s s presentation is not the Action Plan > The Draft Action Plan will include a list of projects and strategies > Today s s presentation is not the list of projects and strategies > The analyses presented today will be used to identify detailed elements of the Four Groups of Actions 54
55 5 Four Groups of Actions ACCELERATE Regional Environmental Mitigation 1) Project specific mitigation 2) Broader regional strategies INVEST STRATEGICALLY in Infrastructure 1) Target market segments 2) Reduce reliance on trucking PROMOTE FAIR-SHARE Public/Private Financing 1) Federal/state 2) Private sector contribution CAPITALIZE on Operational Efficiencies Marine terminal operations, truck turn times, intermodal operations, highway operations
56 56 Next Steps > Release Draft Action Plan August > Final Stakeholder Advisory Group Meeting - September > Conduct county workshops September/October > Begin Environmental Justice (EJ) Grant analysis and outreach process October > Seek Board approval of Action Plan November
57 Questions & Answers More Information: 57