FREIGHT P T OLICY RANSPORTATION INSITUTE. Freight Commodity Flows: Selected Washington State Highways
|
|
|
- Egbert Sutton
- 5 years ago
- Views:
Transcription


1 FREIGHT P T OLICY RANSPORTATION INSITUTE Freight Commodity Flows: Selected Washington State Highways
2 Freight Commodity Flows: Selected Washington State Highways FPTI Research Report Number 17 April 2014 by Jeremy Sage and Ken Casavant Freight Policy Transportation Institute, PO Box Washington State University Pullman, WA Washington State Transportation Center (TRAC) Washington State University 101 Sloan Hall, PO Box Pullman, Washington Washington State Department of Transportation Technical Monitor Barbara Ivanov Director, Freight Systems Division/Olympia Prepared for Washington State Transportation Commission Washington State Department of Transportation Olympia, Washington
3 DISCLAIMER The contents of this report reflect the views of the authors, who are responsible for the facts and the accuracy of the data presented herein. The contents do not necessarily reflect the official views or policies of the Washington State Department of Transportation. This report does not constitute a standard, specification, or regulation. ACKNOWLEDGMENTS This study was funded by a grant from the Washington State Department of Transportation. iii P a ge
4 VOLUME I: Snoqualmie Pass TABLE OF CONTENTS Section 1: Background...1 Objectives...1 Section 2: Freight Truck Movements on Washington s Snoqualmie Pass...2 Section 3: Characteristic Profile of Eastbound Trucks on I Section 4: Characteristic Profile of Westbound Trucks on I Section 5: Reroute Characteristics of East and Westbound Truck Movement...16 Section 6: Conclusion...18 Appendix I.A...20 Appendix I.B...25 Volume II: Wenatchee Region Section 1: Background...28 Objectives...28 Section 2: Freight Truck Movements in the Wenatchee Region (SR-28)...28 Section 3: Characteristic Profile of Eastbound Trucks in the Wenatchee Region (SR-28)...31 Section 4: Characteristic Profile of Westbound Trucks in the Wenatchee Region (SR-28)...35 Section 5: Freight Truck Movements in the Wenatchee Region (US-97/2)...38 Section 6: Characteristic Profile of Northbound Trucks in the Wenatchee Region (US-97)...40 Section 7: Characteristic Profile of Westbound Trucks in the Wenatchee Region (US-2)...44 Section 8: Freight Truck Movements in the Wenatchee Region (Brewster)...47 Section 9: Characteristic Profile of Wenatchee Region (Brewster) Trucks...49 Section 10: Roadway Usage and Major Bottlenecks...53 Section 11: Conclusion...55 Appendix II.A...58 Appendix II.B...63 iv P a ge
5 LIST OF FIGURES Volume I: Snoqualmie Pass Figure I.2.1: Seasonal survey totals...2 Figure I.2.2: I-90 commodity survey totals by volume and associated value...4 Figure I.2.3: East and Westbound cargo averages...5 Figure I.2.4: Annualized volume and value of cargo crossing Snoqualmie Pass...5 Figure I.3.1: Eastbound-origin State/Province...6 Figure I.3.2: Eastbound-origin city...6 Figure I.3.3: Eastbound-destination State/Province...7 Figure I.3.4: Eastbound-destination city...7 Figure I.3.5 Eastbound-origin facility types...8 Figure I.3.6: Eastbound-Seattle and Tacoma port origination detail...9 Figure I.3.7: Eastbound-major commodities generated by the Ports of Seattle and Tacoma...9 Figure I.3.8: Eastbound-destination facility types...10 Figure I.4.1: Westbound-origin State/Province...11 Figure I.4.2: Westbound-origin city...11 Figure I.4.3: Westbound-destination State/Province...12 Figure I.4.4: Westbound-destination city...12 Figure I.4.5 Westbound-origin facility types...13 Figure I.4.6: Westbound-destination facility types...14 Figure I.4.7: Westbound-Seattle and Tacoma port destination detail...14 Figure I.4.8a: Westbound-major commodity groups destined for the Ports of Seattle and Tacoma...15 Figure I.4.8b: Westbound-major commodities destined for the Ports of Seattle and Tacoma...15 Figure I.5.1: Timing of reroute decisions by drivers...17 Figure I.5.2: Direct costs accrued to trucks/firms for closures of 1-, 3-, and 5-hours...18 v P a ge
6 Volume II: Wenatchee Region Figure II.2.1: Seasonal survey totals...29 Figure II.2.2: Wenatchee Region (SR-28) industry survey totals by volume and associated value...30 Figure II.2.3: Cargo averages (SR-28)...31 Figure II.2.4: Annualized volume and value of cargo in the Wenatchee Region (SR-28)...31 Figure II.3.1: Origin State/Province...32 Figure II.3.2: Origin city...32 Figure II.3.3: Destination State/Province...33 Figure II.3.4: Destination city...33 Figure II.3.5 Origin facility types...34 Figure II.3.6: Destination facility types...34 Figure II.4.1: Origin State/Province...35 Figure II.4.2: Origin city...35 Figure II.4.3: Destination State/Province...36 Figure II.4.4: Destination city...36 Figure II.4.5 Origin facility types...37 Figure II.4.6: Destination facility types...37 Figure II.5.1: Seasonal survey totals...38 Figure II.5.2: Wenatchee Region (US-97/2) industry survey totals by volume and associated value...39 Figure II.5.3: North and Westbound cargo averages...40 Figure II.5.4: Annualized volume and value of cargo crossing Snoqualmie Pass...40 Figure II.6.1: Origin State/Province...41 Figure II.6.2: Origin city...41 Figure II.6.3: Destination State/Province...42 Figure II.6.4: Destination city...42 Figure II.6.5 Origin facility types...43 vi Pa g e
7 Figure II.6.6: Destination facility types...43 Figure II.7.1: Origin State/Province...44 Figure II.7.2: Origin city...44 Figure II.7.3: Destination State/Province...45 Figure II.7.4: Destination city...45 Figure II.7.5 Origin facility types...46 Figure II.7.6: Destination facility types...46 Figure II.8.1: Seasonal survey totals...47 Figure II.8.2: Wenatchee Region (Brewster) industry survey totals by volume and associated value...48 Figure II.8.3: Cargo averages...49 Figure II.8.4: Annualized volume and value of cargo in the Wenatchee Region (Brewster)...49 Figure II.9.1: Origin State/Province...50 Figure II.9.2: Origin city...50 Figure II.9.3: Destination State/Province...51 Figure II.9.4: Destination city...51 Figure II.9.5 Origin facility types...52 Figure II.9.6: Destination facility types...52 Figure II.10.1 Segment occurrences of major highways and streets...54 Figure II.10.2 Major bottlenecks...55 vii P a g e

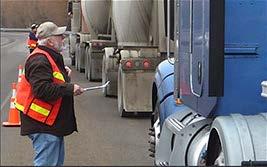
8 EXECUTIVE SUMMARY Project Overview The search for understanding of commodity flows throughout the nation and the state of Washington is a continual process. This understanding is critical at many levels of the transportation industry and to those firms and entities that provide that transportation, or regulate and invest in the needed infrastructure. These data, usually desired at the sub national level, are essential to adequate planning by state, regional and local levels as attempts continue to improve the efficiency, effectiveness and sustainability of the transportation system. State and national travel models require those data, often on a seasonal, commodity/industrial, directional, or modal basis. Determining the importance of a commodity flow on a corridor level leads to improved bases for the prioritization of investments in infrastructure as well as increasing the ability to determine quantitative impacts of congestion, regulation and bottlenecks on a transportation system or supply chain. Seasonal surveys were collected from seven locations shown below; two on Snoqualmie Pass, and five in the greater Wenatchee region. Northbound US-97 at Blewitt Pass and Westbound US-2 Intersection of US-97 and SR-17 at Brewster East- and Westbound I-90 at Cle Elum East- and Westbound SR-28 near Rock Island viii P a ge
9 Specific survey instruments were developed for each region of consideration in an effort to address regional data needs. Specifically, the Snoqualmie survey instruments were developed to aid the region in answering the following series of questions: How much freight is crossing the Snoqualmie Pass both in tonnage and value of freight? What types of products are crossing the Pass, on a daily, seasonal, and yearly basis? What routes does freight take when Snoqualmie Pass is closed? How important is Snoqualmie Pass to the Ports? Which Ports benefit most from Snoqualmie Pass? Is Snoqualmie Pass used primarily for importing or exporting freight? How much does closing the Pass cost the state of Washington s economy? How much does it cost freight companies when the Pass is closed? Similarly, the Wenatchee area survey instruments were designed to again collect information on the volume and commodity movements in the region and with an added interest in the identified bottlenecks for freight throughout the region. Through the compilation and analysis of the results, it becomes readily apparent that many drivers are not pleased with the implementation and effectiveness of the growing trend in round-a-bouts in place of lighted intersections. ix P a ge
10 VOLUME I: SNOQUAMLIE PASS Section 1: Background The search for understanding of commodity flows throughout the nation and the state of Washington is a continual process. This understanding is critical at many levels of the transportation industry and to those firms and entities that provide that transportation, or regulate and invest in the needed infrastructure. These data, usually desired at the sub national level, are essential to adequate planning by state, regional and local levels as attempts continue to improve the efficiency, effectiveness and sustainability of the transportation system. State and national travel models require those data, often on a seasonal, commodity/industrial, directional, or modal basis. Determining the importance of a commodity flow on a corridor level leads to improved bases for the prioritization of investments in infrastructure as well as increasing the ability to determine quantitative impacts of congestion, regulation and bottlenecks on a transportation system or supply chain. The information on the destination of the products carried, their origin, their volume/value, etc. can be useful, even critical, in prioritizing the I-90 corridor over Snoqualmie Pass for future private and public infrastructure investments. Potential needs for corridor enhancement have been placed at around $500 million, but the benefits of such improvements suffer from the lack of precise, enriched data on the actual commodity flows. Such data can be used to prioritize infrastructure investments and policy alternatives dealing with the overall impact of problems in the corridor. Objectives The overall goal of this research project is to collect the necessary data to quantify and characterize the movement of commodities through specified freight corridors, or through and around relevant entities/cities/counties, using the intercept methodology (Appendix I.A), when trucks are stopped during the movement itself, as developed in previous studies by the Freight Policy Transportation Institute (FPTI) 1. Specifically, the survey design and implementation sought to enable WSDOT and contributing agencies to answer the following questions: How much freight is crossing the Snoqualmie Pass both in tonnage and value of freight? What types of products are crossing the Pass, on a daily, seasonal, and yearly basis? What routes does freight take when Snoqualmie Pass is closed? How important is Snoqualmie Pass to the Ports? P age
11 Which Ports benefit most from Snoqualmie Pass? Is Snoqualmie Pass used primarily for importing or exporting freight? How much does closing the Pass cost the state of Washington s economy? How much does it cost freight companies when the Pass is closed? Discussions regarding each of the above questions are addressed in the sections that follow. Section 2: Freight Truck Movements on Washington s Snoqualmie Pass The efficient movement of goods over Washington s major East-West corridor, Snoqualmie Pass, is vital to the economic vitality of the state and the region. Figure I.2.1 summarizes the survey total for each season and direction, along with the recorded average volumes for the week of the survey (where applicable). As can be seen in the table, each survey session garnered sufficient responses to readily obtain a confidence level of 95% (C.I. 5%). Using the Seasonal weight factor calculations (Appendix A), the average annual daily truck traffic (AADTT) is calculated as 3,114 for eastbound trucks (1,110 empty, and 2,004 loaded), and 2,351 for westbound trucks (400 empty, and 1951 loaded). These figures, multiplied by 312 (assumed 6 days of operation per week), are used to calculate annual volumes and associated values. Figure I.2.1: Seasonal survey totals. Number of Empty Trucks Surveyed Number of Trucks With Cargo Surveyed Seasonal Weight Factor Truck Total Volume a Weighted Value Percent of Trucks Surveyed Confidence Level 95% +/- 5% Eastbound Fall , % Winter , % Spring , % Summer , % Westbound Fall , % Winter , % Spring , % Summer , % a Truck total volumes represent the average of the recorded truck (Summation of Single-, Double-, and Triple- Units) volumes for the week of the survey. Due to instrument error, counts for the winter session are not available. The recorded values represent February 2012 recordings. Truck counts are only used to gauge statistical significance, thus this error does not reduce the integrity of the surveys. 2 P age
12 Figure I.2.2 captures the aggregated industry groups transporting goods across the pass, as measured by all surveys collected westbound at the Port of Entry (POE) near Cle Elum, and the eastbound weigh station opposite the POE. Using commodity values ($/ton) generated from the nationally based Commodity Flow Survey (CFS), the value of the surveyed cargo being transported has been estimated. Where available, the values are generated from Washington specific averages of the corresponding industry codes. National averages are used in place of those with insufficient records to generate a state average (Indicated by (*) in Figure I.2.2). The figure relates only the number of occurrences each commodity is found in the surveyed drivers from all eight (four eastbound, and four westbound) survey events. Cargo weight and total tonnage represent the combined cargo weight of all respondents under the associated commodity category, while average cargo weight is a simple average taken based on the number of observations in the category. 3 P age
13 Figure I.2.2: I-90 commodity survey totals by volume and associated value. SCTG Description Number of Occurrences Total Cargo Weight Average Cargo Weight Total Tonnage Total Value ($) 01 Live animals and live fish 6 209,000 34, $ 179, Cereal grains ,561 36, $ 68, Other agricultural products ,890,050 41,587 6,945 $ 5,276, Animal feed and animal products* 169 8,111,233 47,995 4,056 $ 6,045, Meat, fish, seafood 125 4,323,799 34,590 2,162 $ 7,768, Milled grain and bakery products 34 1,536,810 45, $ 1,400, Other prepared foodstuffs, fats, oils ,396,285 41,140 12,198 $ 15,731, Alcoholic beverages 50 1,903,624 38, $ 2,020, Monumental or building stone 3 128,000 42, $ 41, Natural sands 7 423,900 60, $ 5, Gravel and crushed stone 25 1,250,720 50, $ 9, Nonmetallic minerals* ,480 49, $ 32, Metallic ores and concentrates 3 179,700 59, $ 382, Crude Petroleum* 4 142,830 35, $ 47, Gasoline and aviation turbine fuel 30 1,890,499 63, $ 948, Fuel oils 20 1,060,800 53, $ 426, Basic chemicals ,288 39, $ 310, Pharmaceutical products 2 37,000 18, $ 2,465, Fertilizers 5 184,000 36, $ 31, Chemical products and preparations 9 304,028 33, $ 820, Plastics and rubber 66 2,189,178 33,169 1,095 $ 5,070, Logs and other wood in the rough 8 449,000 56, $ 24, Wood products 162 6,376,350 39,360 3,188 $ 1,137, Pulp, and paper products 119 4,146,167 34,842 2,073 $ 1,693, Articles of textiles or leather 45 1,172,066 26, $ 15,646, Nonmetallic mineral products 62 2,129,022 34,339 1,065 $ 244, Primary/semi-finished base metal 121 4,776,741 39,477 2,388 $ 4,378, Articles of base metal 3 93,000 31, $ 186, Machinery 79 2,219,995 28,101 1,110 $ 9,940,499 Electronic, electrical equipment, 35 components and office equipment 70 1,708,496 24, $ 35,138, Motorized and other vehicles, parts 170 4,458,856 26,229 2,229 $ 20,521, Precision instruments and apparatus 8 147,869 18, $ 18,520,258 Furniture, mattresses, lamps, lighting 39 fittings, and illuminated signs 114 2,683,895 23,543 1,342 $ 13,183, Miscellaneous manufactured products 93 2,866,250 30,820 1,433 $ 4,494, Waste and scrap 75 3,105,762 41,410 1,553 $ 844, Mixed freight ,020,759 32,141 6,010 $ 23,578,985 Total $ 198,619,662 4 P age
14 As can be readily expected, distinct differences exist between east and westbound commodity movement. At the broadest perspective, this difference is manifest in the average weight and value of the cargo. Figure I.2.3 reveals these differences. Westbound trucks, largely originating in Eastern Washington, averaged slightly over 19 tons per truck. The value of these same trucks averaged roughly $3,500 per ton. Eastbound trucks weighed less, just shy of 17 tons per tuck, and are valued higher on average, over $5,000 per ton, than their westbound counterparts. Annualizing the volume and value of cargo crossing the Snoqualmie pass generates in excess of an estimated 10 million tons crossing in either direction and $106 Billion combined in goods moved (Figure I.2.4). Figure I.2.3: East and Westbound cargo averages a. Average Cargo Weight (Tons) Average Cargo Value ($/ton) Westbound 19.4 $ 3, Eastbound 17.0 $ 5, a Only those records for which a cargo weight was specified by the respondent, and an identifiable cargo value could be determined are included here. Figure I.2.4: Annualized volume and value of cargo crossing Snoqualmie Pass. Direction of Trip Number of Empty Trucks Number of Trucks with Cargo Total Cargo Weight (Million Tons) Total Cargo Value (Million Dollars) Eastbound 346, , $ 53, Westbound 124, , $ 53, P age
15 Section 3: Characteristic Profile of Eastbound Trucks on I-90 Brief summaries of the eastbound trucks, empty and loaded, are displayed in the following tables. Major characteristics of consideration include the origin and destination (O-D) states/provinces and cities, as well as their associated O-D facilities. The overwhelming majority of trucks surveyed, loaded and empty, originated within Washington (Figure I.3.1). Few other states or provinces recorded a significant number of observations. The Canadian province of British Columbia (BC) generated more observations that all other US states combined, absent Washington. This observation begins to suggest an important relationship between the U.S.-Canadian border and I-90. Breaking the origins of trips down further, Figure I.3.2 provides indication of the cities from which trucks begin their hauls. The top five origin cities are presented, with Seattle being the primary generator both for loaded and empty trucks. Approximately 65% of eastbound trucks are carrying cargo from more than 130 different cities, while the empty trucks originate from just over 100 cities. Figure I.3.1: Eastbound-origin State/Province. Origin State/Province WA % % % BC % % % CA 6 0.5% 3 0.4% 9 0.5% OR 6 0.5% 6 0.9% % Other 7 0.6% 7 1.0% % Total % % % Figure I.3.2: Eastbound-origin city. Origin City Seattle % % % Kent % 61 10% % Tacoma 115 9% % % Sumner 97 8% 36 6% 133 7% Auburn 95 8% 36 6% 131 7% Other % % % Total % % % As should be expected, destination states are more widely dispersed than are the coinciding origins, though still largely dominated by intrastate travel (Figure I.3.3). Unlike the origins for both loaded and empty trucks, whose Washington based originations both exceeded 90%, a difference arises between 6 Page
16 loaded and empty when considering their destination. Just fewer than 60% of loaded trucks terminated in Washington, while 87% of empty trucks did so within the state. Additionally, loaded trucks were destined for 53 states or provinces (or some combination thereof), while empty trucks were terminating in fewer than half that number, 21. Loaded, eastbound trucks are destined for more than 300 cities after crossing Snoqualmie Pass. Spokane ranks as the most frequent destination, with 15%. Of the top destination cities, only one out-ofstate city, Hermiston, OR, cracks into the Top-5 for loaded tucks (Figure I.3.4). For those trucks eastbound without cargo, the attraction to Spokane significantly drops off, with only 3% of the destinations. Replacing it as the top destination city is a combination of Yakima and Ellensburg with 13% each. Not shown in Figure I.3.4, but garnering significant attraction by empty eastbound trucks are Pasco (33), Othello (30), and Grandview (29). One Hundred and twenty different cities serve as the destination of eastbound trucks. Figure I.3.3: Eastbound-destination State/Province. Destination State/Province WA % % % ID % % % OR % % % MT % 3 0.4% % UT % 2 0.3% % Other % % % Total % % % Figure I.3.4: Eastbound-destination city. Destination City Spokane % 22 3% % Yakima 99 8% 89 13% % Moses Lake 55 4% 32 5% 87 5% Wenatchee 47 4% 49 7% 96 5% Hermiston 48 4% 22 3% 70 4% Ellensburg 41 3% 88 13% 129 7% Other % % % Total % % % 7 P age
17 Concentrating now on the facility types that generate eastbound flows on I-90, Figure I.3.5 displays the ten option types that were provided for the respondents. Loaded trucks were most likely (52%) to have originated from a Warehouse or Distribution Center. Perhaps surprisingly was the low percentage of trips associated with the major River and Ocean Ports of western Washington. Despite the low count for port generated cargo, nearly twice as many empty observations (122) were recorded originating at the ports. Similar to loaded trips, the empty trips were also led by Warehouse and Distribution Centers. While Seattle generates more eastbound (import) trips with cargo originating from the ports, as compared to Tacoma, it produces substantially fewer empty truckloads than that of Tacoma (Figure I.3.6). By truck count, the Port of Seattle generates more than 12,000 more truck trips over Snoqualmie Pass, than does its Tacoma counterpart. By value, the Port of Seattle generates just over $1.3 billion in goods moving over the pass annually, while the Port of Tacoma comes in at nearly $548 million of those trucks carrying cargo eastward from either port, no significant commodity trend is apparent. The cargo however, does contain a handful of several SCTG commodities identified in Table 3.7. Most trucks leaving the ports with cargo have destination cities within Washington; 30 of 42 from Seattle, and 9 of 17 from Tacoma. Additionally, Tacoma annually produces approximately 10,000 more empty loads heading east. Figure I.3.5 Eastbound-origin facility types. Facility Origin Trucking Yard % % % Railroad Yard 35 3% 4 1% 39 2% River or Ocean Port 64 5% % % Airport 9 1% 4 1% 13 1% Industrial Factory/Sawmill 89 7% 14 2% 103 5% Agriculture Processing Facility 48 4% 22 3% 70 4% Warehouse/Distribution % % % Farm or Forest 13 1% 10 1% 23 1% Retail Store or Gas Station 20 2% 30 4% 50 3% Job/Construction Site 20 2% 7 1% 27 1% Other % 91 13% % Total % % % 8 P age
18 Figure I.3.6: Eastbound-Seattle and Tacoma port origination detail. Number of Empty Trucks Number of Trucks with Cargo Total Cargo Weight (Tons) Total Cargo Value (Million Dollars) Surveyed Seattle $ 2.62 Tacoma $ 1.10 Annualized Seattle 23,902 21, ,966 $ 1, Tacoma 34,073 8, ,360 $ Figure I.3.7: Eastbound-major commodities generated by the Ports of Seattle and Tacoma. SCTG Code Description Number of Trucks Surveyed Annualized Number of Trucks Seattle 3 Other agricultural products 3 1,501 5 Meat, fish, seafood, and their preparations 3 1,501 7 Other prepared foodstuffs and fats and oils 4 2, Gasoline and aviation turbine fuel 4 2, Fuel oils 3 1, Mixed freight 7 3,501 Tacoma 26 Wood products 2 1, Motorized and other vehicles (including parts) 5 2, Mixed freight 2 1,000 Similar to their origins, destination facilities (Figure I.3.8) for respondent trips were largely attributable to Warehouse or Distribution Centers for both loaded (45%) and empty (36%). Agriculturally related empty trucks making return trips, likely back to eastern Washington, additionally make up a substantial number of observations. 9 P age
19 Figure I.3.8: Eastbound-destination facility types. Facility Destination Trucking Yard % % % Railroad Yard 7 1% 2 0% 9 0% River or Ocean Port 2 0% 8 1% 10 1% Airport 5 0% 0 0% 5 0% Industrial Factory/Sawmill 55 5% 29 4% 84 5% Agriculture Processing Facility 40 3% % 155 8% Warehouse/Distribution % % % Farm or Forest 18 1% 20 3% 38 2% Retail Store or Gas Station % 13 2% % Job/Construction Site 29 2% 8 1% 37 2% Other % 94 14% % Total % % % Section 4: Characteristic Profile of Westbound Trucks on I-90 Brief summaries of the westbound trucks, empty and loaded, are displayed in the following tables. Major characteristics of consideration include the origin and destination (O-D) states/provinces and cities, as well as their associated O-D facilities. The slight majority of trucks surveyed, loaded and empty, originated with Washington (Figure I.4.1). Unlike eastbound trucks, several other states recorded a significant number of observations. In addition to the observations shown in the figure, a stark difference in the origination states can be seen between those loaded trucks and those empty. Loaded trucks originated from across 52 states and provinces, while empty trucks were more regional in their starting points with only 15 states or provinces represented. Breaking the origins of trips down further, Figure I.4.2 provides indication of the cities from which trucks begin their hauls. Neither loaded nor empty trucks may be suggested to have a primary origination city. Only Spokane generated in excess of 10% of a category, and that was only for those empty trucks. Loaded trucks began their hauls, from more than 500 different cities throughout the U.S. and Canada. 10 P age
20 Figure I.4.1: Westbound-origin State/Province. Origin State/Province WA % % % ID % % % UT % 4 0.9% % OR % % % TX % 0 0.0% % MT % % % Other % % % Total % % % Figure I.4.2: Westbound-origin city. Origin City Spokane 164 8% 64 14% 228 9% Yakima 136 6% 39 9% 175 7% Ellensburg 88 4% 29 6% 117 5% Moses Lake 82 4% 17 4% 99 4% Hermiston 74 3% 11 2% 85 3% Other % % % Total % % % As should be expected given the origin statistics of the eastbound trucks, the vast majority, in excess of 90%, of westbound trucks are destined for Washington (Figure I.4.3). Only BC generates a significant number of destination responses, nearly 7%. The make-up of loaded vs empty trucks moving west offers quite a different picture as those moving east. Eighty-three percent of westbound trucks were recorded as hauling cargo, as compared to the 64% of those heading east. In further consideration of the destinations for loaded eastbound trucks, Seattle leads the greater than 170 cities with 22% of the destinations, followed closely by Tacoma at 17% (Figure I.4.4). Seattle s portion of empty trucks increases slightly to 24%, while Tacoma s considerably drops off to 12%. All of the major destination cities are located on the east side of the Puget Sound; the greater Seattle- Tacoma region. 11 P age
21 Figure I.4.3: Westbound-destination State/Province. Destination State/Province WA % % % BC % 5 1.1% % OR % 1 0.2% % CA 6 0.3% 0 0.0% 6 0.2% AK 4 0.2% 0 0.0% 4 0.2% Other % 6 1.4% % Total % % % Figure I.4.4: Westbound-destination city. Destination City Seattle % % % Tacoma % 51 12% % Kent % 46 11% % Auburn 138 6% 42 10% 180 7% Sumner 125 6% 26 6% 151 6% Other % % % Total % % % Concentrating now on the facility types that generate westbound flows on I-90, Figure I.4.5 displays the ten option types that were provided for the respondents. Loaded trucks were most likely to have originated from a Warehouse or Distribution Center (38%) or an Agricultural Facility (18%). Further exploration may be warranted to determine whether any respondents interpreted Warehouse/Distribution center to imply one of an agricultural variety. Similar to loaded trips, the empty trips were also led by Warehouse and Distribution Centers in conjunction with Trucking Yards. 12 P age
22 Figure I.4.5 Westbound-origin facility types. Facility Origin Trucking Yard % % % Railroad Yard 7 0% 1 0% 8 0% River or Ocean Port 9 0% 1 0% 10 0% Airport 8 0% 1 0% 9 0% Industrial Factory/Sawmill % 18 4% % Agriculture Processing Facility % 22 5% % Warehouse/Distribution % % % Farm or Forest 88 4% 8 2% 96 4% Retail Store or Gas Station 27 1% 55 13% 82 3% Job/Construction Site 18 1% 15 4% 33 1% Other % 69 17% % Total % % % Similar to their origins, destination facilities for respondent trips were largely attributable to Warehouse or Distribution Centers for both loaded (40%) and empty (28%). The western Washington Ports become a readily apparent attractant in the destinations of westbound trucks on I-90, attracting 17% of the westbound loaded trucks completing the survey. The ports of Tacoma and Seattle receive similar volumes of westbound trips, 172 and 159 respectively (Figure I.4.7). The major commodities destined for these destinations is comprised of agricultural products, animal feed and products, and prepared foodstuff (Figure I.4.8a). Specifically, the major westbound products to either port are hay, apples, and frozen French Fries (Figure I.4.8b). In 2012, nearly $4.3 billion in agricultural products (e.g. hay, vegetables, fruit, meat) were exported through the port of Seattle, in addition to another $5.8 billion in non-agricultural products (e.g. forest products, seafood, paper) 2. Survey estimates of the total value of commodities crossing Snoqualmie Pass and heading to the Port of Seattle total slightly more than $2.5 billion, thus contributing significantly to the total exports from the port. Note, that the survey period is somewhat offset from the 2012 total export value from the Port. Similarly, the Port of Tacoma processed $11.2 billion in international exports in 2013 in addition to additional domestic shipments 3. Truck trips destined for the Port of Tacoma over the survey period are P age
23 estimated to total $4.1 billion, making the Pass a significant contributing passageway for products destined for the Port. Figure I.4.6: Westbound-destination facility types. Facility Destination Trucking yard 170 8% % % Railroad yard 24 1% 7 2% 31 1% River or Ocean Port % 34 9% % Airport 14 1% 1 0% 15 1% Industrial factory/sawmill 127 6% 21 5% 148 6% Agriculture processing facility 71 3% 8 2% 79 3% Warehouse/distribution % % % Farm of forest 34 2% 6 2% 40 2% Retail store or gas station 176 9% 7 2% 183 8% Job/construction site 36 2% 7 2% 43 2% Other % 54 14% % Total % % % Figure I.4.7: Westbound-Seattle and Tacoma port destination detail. Number of Empty Trucks Number of Trucks with Cargo Total Cargo Weight (Tons) Total Cargo Value (Million Dollars) Surveyed Seattle ,734 $ 8.26 Tacoma ,163 $ Annualized Seattle 4,855 48,804 1,146,124 $ 2, Tacoma 4,569 52,795 1,277,928 $ 4, P age
24 Figure I.4.8a: Westbound-major commodity groups destined for the Ports of Seattle and Tacoma. SCTG Code Description Number of Trucks Surveyed Annualized Number of Trucks Seattle 3 Other agricultural products 42 11,765 4 Animal feed and products of animal origin 43 12,045 7 Other prepared foodstuffs and fats and oils 32 8, Base metal in primary or semi-finished forms and finished basic shapes 8 2,241 Tacoma 3 Other agricultural products 34 9,524 4 Animal feed and products of animal origin 48 13,446 7 Other prepared foodstuffs and fats and oils 49 13, Wood products 9 2, Mixed freight 7 1,961 Figure I.4.8b: Westbound-major commodities destined for the Ports of Seattle and Tacoma. Commodity Number of Trucks Surveyed Annualized Number of Trucks Seattle Apples 25 7,003 Hay 39 10,925 French Fries 25 7,003 Potatoes 9 2,521 Lumber Tacoma Apples 23 6,443 Hay 41 11,485 French Fries 24 6,723 Potatoes Onions 5 1,401 Lumber 7 1, P age
25 Section 5: Reroute Characteristics of East and Westbound Truck Movement Of significant concern in the formulation of this intercept survey, is the understanding of the tendencies of freight movement in the face of a potentially long term closure of the pass. Drivers were asked In the event of a weather related closure on Snoqualmie Pass, how long are you willing to wait before taking an alternative route? Drivers were provided the opportunity to select from five responses ranging from a decision to reroute immediately, up to waiting in excess of five hours. Figure I.5.1 summarize the responses garnered from all respondents who provided an answer to the rerouting question. Independent of direction, 43% of drivers indicate that they will wait in excess of five hours before rerouting. Nearly a quarter of each was not able to provide a firm answer to the question. Likely justifications for not knowing stem from two main sources: 1) Decisions about rerouting are not made by the driver, rather they are made by a logistics managers (dispatch); and 2) unfamiliarity with the route if not using this route very often. Further examination of two of the more prominent commodities, in each direction, moving over Snoqualmie pass reveals subtle differences taking shape in regards to the willingness to wait for reopening of the pass. Two primary reroutes constitute movement around a potential closure. These include White and Stevens passes, followed by a larger reroute utilizing I-84. None of these options are considered good options as they add many miles/hours and/or additional closure potential. For eastbound flows, food manufacturers appear much less likely (33%) to wait more than five hours as compared to the average truck (43%), and more likely to reroute 20% versus 12%. Moving in the opposite direction, westbound, drivers involved with commodities related to crop production are more likely (49%) to wait in excess of five hours as compared to the average truck (43%) and less likely to reroute. The observations suggest a variation in the valuation of time for the associated freight, reflective of the perishability of the product and/or the necessity to adhere to just in time delivery. 16 P age
26 Figure I.5.1: Timing of reroute decisions by drivers. N Immediately Less Than 1 Hour Less than 3 hours Less Than 5 Hours More than 5 hours Don't Know Eastbound All % 111 6% % 73 4% % % % 12 8% 13 9% 16 11% 48 33% 28 19% % 15 8% 24 12% 3 2% 69 35% 55 28% Westbound All % 157 6% % 109 4% % % % 20 6% 33 9% 26 7% % 69 19% % 36 8% 46 10% 14 3% % % 111: Crop Production 311: Food Manufacturing 339: Miscellaneous Manufacturing The decision to either wait out the closure, or immediately reroute is of course not a costless one. In a 2011 survey of freight dependent businesses conducted by Washington State University s Social and Economic Sciences Research Center (SESRC) for the FPTI, and WSDOT, respondents on average estimated their truck (mixed between heavy and light) operating costs to be $71 per hour 4. Approximately 35% of this cost can be attributed to driver wages and benefits, while another 20% is attributable to fuel costs. Applying this reported value to the trucks along the Snoqualmie pass, we can estimate the direct delay costs associated with closures. Figure I.5.2 displays the estimated cost to waiting trucks for a 1-, 3-, and 5-hour closure of the pass in either direction. Proportions of trucks willing to wait the specified times are identified in Figure I.5.1. Truck volumes assumed to be experiencing the delay are generated based on the assumption that the closure occurs at peak flow in which approximately 8% of the AADTT crosses the pass in an hour; 188 trucks for westbound movement, and 249 eastbound. For example, in a closure that is expected to last more than one hour, but less than three hours, we expect 142 eastbound trucks (~57%) to wait for the reopening. At $71 per hour, this wait generates a cost of $10,109. Moving into longer closures, the calculation becomes somewhat more cumbersome, as we consider those trucks not only arriving in the first hour and waiting out the entire closure, but also those trucks arriving in the second, third, and so on hours of the closure. Subsequently, a 5-hour closure of the eastbound lanes of I-90 over the pass generates a direct cost to firms that choose to wait out the closure of more than $125,000. It is important to note that even with an expected closure of 1-hour, nearly 20% of trucks will reroute. With no short and timely reroutes 4 FD90D4847A66/0/June2012_Impact_Freight_Congestion.pdf 17 P age
27 available, this adds considerably to the cost of a closure. Refer to WA-RD for detailed explanation of the economic impacts of extended closures to Washington s economy. Figure I.5.2: Direct costs accrued to trucks/firms for closures of 1-, 3-, and 5-hours. Westbound Eastbound 1 Hour Closure $ 7,820 $ 10,109 3 Hour Closure $ 42,429 $ 55,302 5 Hour Closure $ 96,366 $ 126,646 Section 6: Conclusion The preceding sections highlight several of the major themes of the data collected in the intercept survey over Snoqualmie pass. The survey instrument is available in Appendix B to gauge the full detail of information collected from the drivers. The survey effort successfully completed in excess of 90% of attempted interviews with drivers. This result is indicative of the excellent work provided by the volunteer crew of Service Club members and the eagerness of the drivers themselves to contribute to a better understanding of roadway conditions. Accompanying this report is the full data set generated from the survey effort. The first several tabs include pivot tables allowing the formulation of many differing aggregations of the data beyond what is included in this report. These pivot tables may be used to generate tables relating to any number of potential questions related to differing characteristics of the network, drivers, or commodity being transported P age
28 [This Page Intentionally Left Blank] 19 P age
29 Appendix I.A Methodology Data Collection Methods and Issues The FPTI origin and destination (O-D) survey was designed to provide a statistically reliable and comprehensive database of freight truck movements on select highway corridors in the state of Washington. A varied set of truck trip and shipment characteristics were determined and incorporated into the survey. Examples of such information include the carrier, truck type, unloaded truck weight, payload weight, commodity type, and the origin and destination facility type(s) (See Appendix B for Instrument). Detailed information on the highways and routes used by the drivers was also collected as an aid in identifying the major and minor freight corridors within and through Washington. Ten interview sites at permanent weigh stations (6), ports of entry (1), and other sites (3) deemed safe by the Washington State Patrol s Commercial Vehicle Enforcement Officers (CVEOs) were utilized to implement the driver survey. Unlike previous FPTI O-D surveys that broadly covered the entire state, the surveys targeted WSDOT identified corridors of interest. Data was collected during a four-week period in each season (Fall (Oct-Nov 2012), Winter (Jan-Feb 2013), Spring (Apr-May 2013), Summer (Jul-Aug 2013), Fall (Oct-Nov 2013)) (Figure I.A-1). The sequential surveys were conducted to allow seasonal traffic flow comparisons to be made. Data collection was conducted on the same day of the week for the specified sites to allow continuity between seasons. As a rule of thumb, surveys were not conducted on holidays or on Mondays and Fridays so as to avoid any generated unusual flow patterns. Surveys on I-90 were conducted over 24-hr periods (2pm- 2pm). All other sites began operation in the early morning hours, 5, 6, or 7am dependent upon historic truck counts. To best capture the highest volume of traffic, all effort was made to capture the time period in which greater than 80% of the truck traffic could be reasonably expected to pass the survey sites. Evening shutdown of the survey operations was dependent upon the density of truck flow and was typically halted when volumes reached fewer than five trucks per hour. 20 P age
30 Figure I.A-1: Survey Schedule DATE LOCATION HOURS October 23, 2012 I-90 W of Cle Elum WESTBOUND 24hr beginning 2:00pm October 24, 2012 I-90 W of Cle Elum EASTBOUND 24hr beginning 2:00pm October 30, 2012 US-2 W of Wenatchee EASTBOUND 5:00am November 1, 2012 US-2 W of Wenatchee WESTBOUND 5:00am November 6, 2012 SR-28 E of Wenatchee EASTBOUND 5:00am November 8, 2012 SR-28 E of Wenatchee WESTBOUND 5:00am January 29, 2013 US-2 W of Wenatchee EASTBOUND 5:00 am January 29, 2013 US-395 Kettle Falls SOUTHBOUND 7:00 am - January 31, 2013 US-2 W of Wenatchee WESTBOUND 5:00 am February 5, 2013 SR-28 E of Wenatchee EASTBOUND 5:00 am February 5, 2013 US-395 Chewelah NORTHBOUND 7:00 am - February 7, 2013 SR-28 E of Wenatchee WESTBOUND 5:00 am February 12, 2013 US-395 Deer Park SOUTHBOUND 7:00 am - February 13, 2013 US-97 N of Brewster at US-97/SR-17 7:00 am - February 19, 2013 I-90 W of Cle Elum WESTBOUND 24hr beginning 2:00pm February 20, 2013 I-90 W of Cle Elum EASTBOUND 24hr beginning 2:00pm April 23, 2013 I-90 W of Cle Elum WESTBOUND 24hr beginning 2:00pm April 24, 2013 I-90 W of Cle Elum EASTBOUND 24hr beginning 2:00pm April 30, 2013 US-2 W of Wenatchee EASTBOUND 5:00 am April 30, 2013 US-395 Kettle Falls SOUTHBOUND 7:00 am - May 2, 2013 US-2 W of Wenatchee WESTBOUND 5:00 am May 7, 2013 SR-28 E of Wenatchee EASTBOUND 5:00 am May 7, 2013 US-395 Chewelah NORTHBOUND 7:00 am - May 9, 2013 SR-28 E of Wenatchee WESTBOUND 5:00 am May 14, 2013 US-395 Deer Park SOUTHBOUND 7:00 am - May 15, 2013 US-97 N of Brewster at US-97/SR-17 7:00 am - July 23, 2013 I-90 W of Cle Elum WESTBOUND 24hr beginning 2:00pm July 24, 2013 I-90 W of Cle Elum EASTBOUND 24hr beginning 2:00pm July 30, 2013 US-2 W of Wenatchee EASTBOUND 5:00 am July 30, 2013 US-395 Kettle Falls SOUTHBOUND 7:00 am - August 1, 2013 US-2 W of Wenatchee WESTBOUND 5:00 am August 6, 2013 SR-28 E of Wenatchee EASTBOUND 5:00 am August 6, 2013 US-395 Chewelah NORTHBOUND 7:00 am - August 8, 2013 SR-28 E of Wenatchee WESTBOUND 5:00 am August 13, 2013 US-395 Deer Park SOUTHBOUND 7:00 am - August 14, 2014 US-97 N of Brewster at US-97/SR-17 7:00 am - October 29, 2013 US-395 Kettle Falls SOUTHBOUND 7:00 am - November 5, 2013 US-395 Chewelah NORTHBOUND 7:00 am - November 12, 2013 US-395 Deer Park SOUTHBOUND 7:00 am - November 13, 2012 US-97 N of Brewster at US-97/SR-17 7:00 am - 21 P age
31 Approximately 9,000 driver interviews were collected (roughly equivalent per season) to complete the entire origin and destination survey. Refer to Section 1 for I-90 specific counts. Additionally, estimates of the number and direction of non-sampled trucks were made during the interview periods. Estimates are based on either actual truck counts established during the collection period or on historic counts under similar conditions. Actual counts were taken where feasible. These counts were then used to construct weighted estimates of total truck volumes at each location by season. The results presented in this study are derived from these weighted truck trip estimates. The driver interviews were conducted by a team of Washington State University personnel assisted by members of local Lions clubs throughout the survey regions. Survey locations were typically staffed by 4 to 6 individuals, resulting in personnel hours accrued conducting driver interviews each survey day. Driver participation in the survey was high, with locations reporting 95 to 100 percent response rates. A copy of the survey questionnaire is included as Appendix I.B of this report. Data Management, Analysis and Modeling Procedures This section briefly highlights key procedures used within this data framework. More detailed information can be found in Strategic Freight Transportation Analysis Report Number 2, Freight Truck Origin and Destination Study: Methods, Procedures and Data Dictionary. 6 Data Management It is important to maintain effective management of data during collection, entry into a database, and during all subsequent analyses. Following and implementing appropriate management techniques helps ensure that the compiled database accurately reflects the statewide freight movements in Washington. There are three possible sources of error that can be attributed to on-site data collection issues. Systemic problems arise from poorly worded questions, incorrect interview procedures and/or problems stemming from sub-optimal site selection. Data problems may come from drivers who provide inaccurate information in response to the survey questions. Finally, interview personnel may fill out the survey incorrectly, providing inaccurate data regarding vehicle information or driver responses. Errors stemming from improper data collection technique were minimized through a constant monitoring of the survey and data entry personnel. On-site monitoring allowed specific problems to be P age
32 immediately addressed with the interviewer. Problems identified during data entry were addressed during the following survey season. One persistent entry error occurred relative to the weight of cargo. Respondents occasionally indicated their gross vehicle weight (GVW) rather than their cargo only weight (payload). Where this event was readily identifiable (e.g. where the combined answers of the empty and cargo weights of the truck grossly exceeded 105,500 pounds), the data entry was adjusted such that the empty truck weight was subtracted from the identified GVW to obtain a payload weight. Surveys that were identified as not being able to be reliably adjusted, were not included in any calculation of the respective variable. Data Analysis and Modeling The data obtained in the driver interviews was entered into a MS Excel database in table format. Additional information from various sources was systematically added to the database in order to provide greater depth of analysis. For example, traffic counts from the WSDOT Traffic Data Office were used when and where feasible to verify and correct the sample weights obtained during the survey period. The use of the MS Excel platform also allows for the incorporation of database information from such sources as the US Census Bureau, the USDOT Bureau of Transportation Statistics and other federal, state and local transportation databases. Linkage of these various databases was and is accomplished by the use of the Standard Classification of Transported Goods (SCTG) code. This code was identified using information obtained during the driver interview about the primary commodity content of the cargo being transported. This information is critical to identifying commodity flows and volumes moving on state highways. In order to best present the survey data in a meaningful manner, site specific seasonal weight factors based upon the total number of trucks passing each survey site during the day of the survey was calculated. Where feasible, truck counters, either tube or permanent, were used to estimate the total volume. To calculate the seasonal weight factor for each site/season, the total number of trucks in a 24- hour period was divided by the total number of surveys collected at each site. The seasonal weight factor is used to expand the collected data characteristics to represent the entire population of trucks at each 23 P age
33 survey location. This expanded information was a representation based upon the total number of daily truck trips. 24 P age
34 Appendix I.B 25 P age
35 26 P age
36 [This Page Intentionally Left Blank] 27 P age
37 VOLUME II: WENATCHEE REGION Section 1: Background The search for understanding of commodity flows throughout the nation and the state of Washington is a continual process. This understanding is critical at many levels of the transportation industry and to those firms and entities that provide that transportation, or regulate and invest in the needed infrastructure. These data, usually desired at the sub national level, are essential to adequate planning by state, regional and local levels as attempts continue to improve the efficiency, effectiveness and sustainability of the transportation system. State and national travel models require those data, often on a seasonal, commodity/industrial, directional, or modal basis. Determining the importance of a commodity flow on a corridor level leads to improved bases for the prioritization of investments in infrastructure as well as increasing the ability to determine quantitative impacts of congestion, regulation and bottlenecks on a transportation system or supply chain. Objectives The overall goal of this research project is to collect the necessary data to quantify and characterize the movement of commodities through specified freight corridors, or through and around relevant entities/cities/counties, using the intercept methodology (Appendix II.A), when trucks are stopped during the movement itself, as developed in previous studies by the Freight Policy Transportation Institute (FPTI) 7. Section 2: Freight Truck Movements in the Wenatchee Region (SR-28) The efficient movement of goods in and over the Wenatchee Region is vital to the economic vitality of the state and the region. Figure II.2.1 summarizes the survey total for each season, along with the recorded average volumes for the week of the survey (where applicable). As can be seen in the table, each survey session garnered sufficient responses to readily obtain a confidence level of 95% (C.I. 5%). Using the Seasonal weight factor calculations (Appendix II.A), the average annual daily truck traffic (AADTT) is calculated as 538 for eastbound trucks (175 empty and 363 loaded), and 617 for westbound trucks (237 empty and 380 loaded). These figures, multiplied by 312, are used to calculate annual volumes and associated values P age
38 Figure II.2.1: Seasonal survey totals. Eastbound Number of Empty Trucks Surveyed Number of Trucks With Cargo Surveyed Truck Total Volume Seasonal Weight Factor Weighted Value Percent of Trucks Surveyed a Confidence Level 95% +/- 5% Fall % Winter % Spring % Summer % Westbound Fall % Winter % Spring % Summer % a Percent of trucks surveyed for winter, spring, summer is established using the counter information obtained in the fall season. The assumption is made that survey rates are equal across dates. Figure II.2.2 captures the aggregated industry groups transporting goods on SR-28, as measured by all surveys collected. Using commodity values ($/ton) generated from the nationally based Commodity Flow Survey (CFS), the value of the cargo being transported has been estimated. Where available, the values are generated from Washington specific averages of the corresponding industry codes. National averages are used in place of those with insufficient records to generate a state average. 29 P age
39 Figure II.2.2: Wenatchee Region (SR-28) industry survey totals by volume and associated value. SCTG Description Number of Occurrences Total Cargo Weight Average Cargo Weight Total Tonnage Total Value 1 Live animals and live fish 1 44,000 44, $ 37,737 3 Other agricultural products ,232,977 38,782 7,116 $ 5,406,648 4 Animal feed and animal products ,612 29, $ 285,189 5 Meat, fish, seafood 3 99,000 33, $ 177,861 6 Milled grain and bakery products 4 23,500 5, $ 21,412 7 Other prepared foodstuffs, fats, oils 62 1,945,464 31, $ 1,254,532 8 Alcoholic beverages 5 74,000 14, $ 78, Natural sands 5 326,960 65, $ 4, Gravel and crushed stone 8 400,720 50, $ 2, Nonmetallic minerals 2 78,500 39, $ 3, Gasoline and aviation turbine fuel ,275 56, $ 480, Fuel oils 3 153,000 51, $ 61, Coal and petroleum product 4 119,160 29, $ 46, Basic chemicals 8 316,626 39, $ 131, Fertilizers ,300 38, $ 80, Chemical products and preparations 3 72,700 24, $ 196, Plastics and rubber ,180 14, $ 507, Logs and other wood in the rough ,100 38, $ 24, Wood products ,943 26, $ 156, Pulp and paper products 2 90,600 45, $ 37, Paper or paperboard articles 51 1,667,499 32, $ 1,483, Printed products 1 40,000 40, $ 72, Articles of textiles or leather ,550 21, $ 3,478, Nonmetallic mineral products 6 135,084 22, $ 15, Primary/semi-finished base metal ,335 33, $ 463, Articles of base metal ,000 20, $ 572, Machinery 43 1,247,795 29, $ 5,587, Electronic, electrical equipment, components and office equipment ,770 12, $ 3,141, Motorized and other vehicles, parts ,900 13, $ 2,024, Transportation equipment 2 65,705 32, $ 913, Precision instruments and apparatus 2 35,000 17, $ 4,383, Furniture, mattresses, lamps, lighting fittings, and illuminated signs 8 146,460 18, $ 719, Miscellaneous manufactured products 4 162,200 40, $ 254, Waste and scrap ,860 39, $ 172, Mixed freight ,109 26, $ 1,683,200 Total $ $33,962, P age
40 As can be readily expected, distinct differences exist between east and westbound commodity movement. At the broadest perspective, this difference is manifest in the average weight and value of the cargo. Figure II.2.3 reveals these differences. Westbound trucks, largely originating in Eastern Washington, averaged over 17.5 tons per truck. The value of these same trucks averaged roughly $4,100 per ton. Eastbound trucks weighed less, just over of 16 tons per tuck, and are valued $1,000 at roughly $3,100 per ton on average, than their westbound counterparts. Annualizing the volume and value of the cargo generates an estimated 2 million tons in either direction and $14.3 billion combined in goods moved (Figure II.2.4). Figure II.2.3: Cargo averages a (SR-28). Average Cargo Weight (Tons) Average Cargo Value ($/ton) Eastbound $ 3, Westbound $ 4, a Only those records for which a cargo weight was specified by the respondent, and an identifiable cargo value could be determined are included here. Figure II.2.4: Annualized volume and value of cargo in the Wenatchee Region (SR-28). Number of Empty Trucks Number of Trucks with Cargo Total Cargo Weight (Million Tons) Total Cargo Value (Million Dollars) Eastbound 54, , $ 5, Westbound 73, , $ 8, Section 3: Characteristic Profile of Eastbound Trucks in the Wenatchee Region (SR-28) Brief summaries of the eastbound trucks, empty and loaded, are displayed in the following tables. Major characteristics of consideration include the origin and destination (O-D) states/provinces and cities, as well as their associated O-D facilities. The overwhelming majority of trucks surveyed, loaded and empty, originated within Washington (Figure II.3.1). Few other states or provinces recorded a significant number of observations. Breaking the origins of trips down further, Figure II.3.2 provides indication of the cities from which trucks begin their hauls. The top five origin cities are presented, with Wenatchee being the primary generator both for loaded and empty trucks (above 40% each). Approximately 68% of eastbound trucks are carrying cargo, having originated from just over 75 cities, while the empty trucks originate from over 50 cities. 31 P age
41 Figure II.3.1: Origin State/Province. Origin State/Province WA % % % OR 9 1.8% 6 2.5% % CA 4 0.8% 0 0.0% 4 0.5% ID 3 0.6% 1 0.4% 4 0.5% Other 4 0.8% % % Total % % % Figure II.3.2: Origin city. Origin City Wenatchee % % % East Wenatchee % % % Chelan % 7 2.9% % Brewster % 1 0.4% % Cashmere % % % Other % % % Total % % % Similar to the origin state, Washington is the top destination for both loaded and empty trucks heading east. The overwhelming majority (above 90%) of empty trucks originate and end their routes in Washington. However, only half of loaded trucks are destined in Washington even though more than 95% originate in WA. As should be expected, destination states are more dispersed than are the coinciding origins, though still somewhat dominated by intrastate travel (Figure II.3.3). Loaded trucks originate from six states and are destined to over forty. Loaded, eastbound trucks are destined for more than 180 cities. Quincy ranks as the most frequent destination, with 10%. None of the top origin cities are in the Top-5 destination cities for loaded trucks (Figure II.3.4). Wenatchee only accounts for 3% of loaded trucks and 6% of empty. This is a far cry from the 49% of loaded trucks and 40% of empty trucks originating in Wenatchee. Replacing Wenatchee as the top destination city for both loaded an empty trucks is Quincy with 10% and 16% respectively. 32 P age
42 Figure II.3.3: Destination State/Province. Destination State/Province WA % % % CA % 0 0.0% % TX % 0 0.0% % OR % 3 1.3% % AZ % 0 0.0% % Other % % % Total % % % Figure II.3.4: Destination city. Destination City Quincy % % % Moses Lake % % % Pasco % 8 3.4% % Spokane % % % Yakima % % % Other % % % Total % % % Concentrating now on the facility types that generate flows on SR-28, Figure II.3.5 displays the ten option types that were provided for the respondents. Loaded trucks were most likely (48%) to have originated from a Warehouse or Distribution Center (26% for empty trucks). As can be expected, a significant number of loaded (and empty), eastbound trucks originate from an Agriculture Processing Facility (24%). More than 60% of empty trucks originated from a Trucking Yard, an Agriculture Processing Facility, or a Warehouse or Distribution Center. 33 P age
43 Figure II.3.5 Origin facility types. Facility Origin Trucking Yard % % % Railroad Yard 0 0.0% 0 0.0% 0 0.0% River or Ocean Port 0 0.0% 0 0.0% 0 0.0% Airport 1 0.2% 1 0.4% 2 0.3% Industrial Factory/Sawmill % % % Agriculture Processing Facility % % % Warehouse/Distribution % % % Farm or Forest % 6 2.7% % Retail Store or Gas Station % % % Job/Construction Site 8 1.6% % % Other % % % Total % % % Similar to their origins, destination facilities (Figure II.3.6) for respondent trips were largely attributable to Warehouse or Distribution Centers for both loaded (42%) and empty (30%). Agriculture Processing Facilities, also, accounted for a significant portion of destination facilities (17% for loaded and 16% for empty trucks). Most other destination facilities do not account for any significant amount of traffic, except for Retail Store or Gas Station with 14% for loaded trucks. Figure II.3.6: Destination facility types. Facility Destination Trucking Yard % % % Railroad Yard % 0 0.0% % River or Ocean Port 1 0.2% 0 0.0% 1 0.1% Airport 0 0.0% 1 0.5% 1 0.1% Industrial Factory/Sawmill % % % Agriculture Processing Facility % % % Warehouse/Distribution % % % Farm or Forest % % % Retail Store or Gas Station % 9 4.1% % Job/Construction Site % % % Other % % % Total % % % 34 P age
44 Section 4: Characteristic Profile of Westbound Trucks in the Wenatchee Region (SR-28) Brief summaries of the westbound trucks, empty and loaded, are displayed in the following tables. Major characteristics of consideration include the origin and destination (O-D) states/provinces and cities, as well as their associated O-D facilities. The overwhelming majority of trucks surveyed, both loaded and empty, originated within Washington (Figure II.4.1). Few other states or provinces recorded a significant number of observations. Breaking the origins of trips down further, Figure II.4.2 provides indication of the cities from which trucks begin their hauls. Neither loaded nor empty trucks may be suggested to have a primary origination city. However, Quincy, Moses Lake, and Spokane combined generated about a third for loaded and empty trucks heading west. Most trucks are originating in Eastern Washington. Also of note, but not pictured below, is that Wenatchee accounts for 10% of unloaded trucks. Approximately 62% of westbound trucks are carrying cargo, having originated from just over 105 cities, while the empty trucks originate from 50 cities. Figure II.4.1: Origin State/Province. Origin State/Province WA % % % OR % % % CA 8 1.7% 1 0.3% 9 1.2% ID 6 1.3% % % Alberta 5 1.0% 1 0.3% 6 0.8% Other % 4 1.3% % Total % % % Figure II.4.2: Origin city. Origin City Quincy % % % Moses Lake % % % Spokane % % % Yakima % 7 2.4% % Wallula % 1 0.3% % Other % % % Total % % % As should be expected, the vast majority, in excess of 96%, of westbound trucks are destined for Washington (Figure II.4.3). No other states or provinces recorded a significant number of observations. The make-up of loaded vs empty trucks moving west is similar as those moving east (61% vs 68%). 35 Page
45 None of the top origin cities are in the Top-5 destination cities for loaded trucks (Figure II.4.4), while only Quincy takes the 5 th spot for empty trucks. The destination cities of choice are Wenatchee and East Wenatchee. Together they account for 70% of all trucks heading west on SR-28. Figure II.4.3: Destination State/Province. Destination State/Province WA % % % British Columbia % 2 0.7% 7 0.9% OR % 1 0.3% 3 0.4% FL % 0 0.0% 2 0.3% Other 6 1.3% 3 1.0% 9 1.2% Total % % % Figure II.4.4: Destination city. Destination City Wenatchee % % % East Wenatchee % % % Chelan % 5 1.7% % Cashmere % 8 2.7% % Orondo % 5 1.7% % Other % % % Total % % % Concentrating now on the facility types that generate westbound flows SR-28, Figure II.4.5 displays the ten option types that were provided for the respondents. Loaded trucks were most likely to have originated from a Warehouse or Distribution Center (42%) or an Agricultural Facility (12%). These percentages are slightly lower than origin facilities for eastbound trucks. Also of note is that Farms of Forests make up 10% of loaded trucks. Similar to loaded trips, the empty trips were also led by Warehouse and Distribution Centers and Trucking Yards and Agriculture Processing Facilities follow slightly behind. 36 P age
46 Figure II.4.5 Origin facility types. Facility Origin Trucking Yard % % % Railroad Yard 3 0.7% 6 2.3% 9 1.3% River or Ocean Port 0 0.0% 2 0.8% 2 0.3% Airport 2 0.4% 2 0.8% 4 0.6% Industrial Factory/Sawmill % % % Agriculture Processing Facility % % % Warehouse/Distribution % % % Farm or Forest % % % Retail Store or Gas Station % % % Job/Construction Site % % % Other % % % Total % % % Similar to their origins, destination facilities for respondent trips were largely attributable to Warehouse or Distribution Centers for both loaded (34%) and empty (31%). Retail Stores or Gas Stations and Agriculture Processing Facilities also make up a significant percent of loaded trucks; however, only a few empty trucks are destined for Retail Stores or Gas Stations, which is not surprising. Figure II.4.6: Destination facility types. Facility Destination Trucking yard % % % Railroad yard 2 0.5% 4 1.5% 6 0.8% River or Ocean Port 2 0.5% 0 0.0% 2 0.3% Airport 5 1.1% 0 0.0% 5 0.7% Industrial factory/sawmill % % % Agriculture processing facility % % % Warehouse/distribution % % % Farm of forest 7 1.6% 3 1.1% % Retail store or gas station % 7 2.7% % Job/construction site % 8 3.0% % Other % % % Total % % % 37 P age
47 Section 5: Freight Truck Movements in the Wenatchee Region (US-97/2) The efficient movement of goods in and over the Wenatchee Region is vital to the economic vitality of the state and the region. Figure II.5.1 summarizes the survey total for each season, along with the recorded average volumes for the week of the survey (where applicable). As can be seen in the table, each survey session garnered sufficient responses to readily obtain a confidence level of 95% (C.I. 5%). Using the Seasonal weight factor calculations (Appendix A), the average annual daily truck traffic (AADTT) is calculated as 583 for northbound trucks (274 empty and 308 loaded), and 456 for westbound trucks (164 empty and 291 loaded). These figures, multiplied by 312, are used to calculate annual volumes and associated values. Figure II.5.1: Seasonal survey totals. Number of Empty Trucks Surveyed Number of Trucks With Cargo Surveyed Truck Total Volume Seasonal Weight Factor Weighted Value Percent of Trucks Surveyed Confidence Level 95% +/- 5% Northbound Fall % Winter % Spring % Summer % Westbound Fall % Winter % Spring % Summer % Figure II.5.2 captures the aggregated industry groups transporting goods on US-97/2, as measured by all surveys collected westbound at the weight station near the intersection of US-2 and US-97 and northbound over Blewitt Pass on US-97. Using commodity values ($/ton) generated from the nationally based Commodity Flow Survey (CFS), the value of the cargo being transported has been estimated. Where available, the values are generated from Washington specific averages of the corresponding industry codes. National averages are used in place of those with insufficient records to generate a state average. 38 P age
48 Figure II.5.2: Wenatchee Region (US-97/2) industry survey totals by volume and associated value. SCTG Description Number of Occurrences Total Cargo Weight Average Cargo Weight Total Tonnage Total Value 1 Live animals and live fish 1 13,000 13,000 7 $ 11,150 3 Other agricultural products 261 8,783,050 33,652 4,392 $ 3,336,397 4 Animal feed and animal products 9 195,700 21, $ 145,869 5 Meat, fish, seafood 4 98,500 24, $ 176,963 6 Milled grain and bakery products 3 92,000 30, $ 83,826 7 Other prepared foodstuffs, fats, oils 69 2,041,566 29,588 1,021 $ 1,316,503 8 Alcoholic beverages ,334 21, $ 254, Natural sands ,700 60, $ 8, Gravel and crushed stone 30 1,096,900 36, $ 8, Nonmetallic minerals 4 273,420 68, $ 12, Gasoline and aviation turbine fuel 18 1,019,285 56, $ 511, Fuel oils 8 384,700 48, $ 154, Coal and petroleum product 3 25,040 8, $ 9, Basic chemicals 4 160,000 40, $ 66, Fertilizers 2 129,100 64, $ 22, Chemical products and preparations 2 52,800 26, $ 142, Plastics and rubber ,859 18, $ 764, Logs and other wood in the rough 7 340,400 48, $ 18, Wood products ,540 31, $ 118, Pulp and paper products 4 239,000 59, $ 97, Paper or paperboard articles ,792 19, $ 323, Articles of textiles or leather 4 39,258 9, $ 524, Nonmetallic mineral products ,556 28, $ 42, Primary/semi-finished base metal ,360 31, $ 439, Articles of base metal ,800 28, $ 632, Machinery ,090 25, $ 2,834, Electronic, electrical equipment, components and office equipment ,327 12, $ 6,197, Motorized and other vehicles, parts ,700 16, $ 1,057, Transportation equipment ,325 28, $ 4,746, Precision instruments and apparatus 2 39,000 19, $ 4,884, Furniture, mattresses, lamps, lighting fittings, and illuminated signs 8 51,130 6, $ 251, Miscellaneous manufactured products 8 169,400 21, $ 265, Waste and scrap ,020 38, $ 242, Mixed freight ,041 20, $ 1,602,644 Total $ $31,303, P age
49 As can be readily expected, distinct differences exist between north and westbound commodity movement. At the broadest perspective, this difference is manifest in the average weight and value of the cargo. Figure II.5.3 reveals these differences. Westbound trucks, largely originating in Eastern Washington, averaged slightly under 14 tons per truck. The value of these same trucks averaged roughly $3,300 per ton. Westbound trucks weighed more, just shy of 17 tons per truck, and are valued higher on average, over $5,600 per ton, than their eastbound counterparts. Annualizing the volume and value of the cargo generates just under 2.9 million tons and $13.5 billion combined in goods moved (Figure II.5.4). Figure II.5.3: North and Westbound cargo averages a. Average Cargo Weight (Tons) Average Cargo Value ($/ton) Northbound $ 5, Westbound $ 3, a Only those records for which a cargo weight was specified by the respondent, and an identifiable cargo value could be determined are included here. Figure II.5.4: Annualized volume and value of cargo crossing Snoqualmie Pass. Number of Empty Trucks Number of Trucks with Cargo Total Cargo Weight (Million Tons) Total Cargo Value (Million Dollars) Northbound 85,644 96, $ 9, Westbound 51,244 90, $ 4, Section 6: Characteristic Profile of Northbound Trucks in the Wenatchee Region (US-97) Brief summaries of the northbound trucks, empty and loaded, are displayed in the following tables. Major characteristics of consideration include the origin and destination (O-D) states/provinces and cities, as well as their associated O-D facilities. The overwhelming majority of trucks surveyed, both loaded and empty, originated within Washington (Figure II.6.1). Oregon is the only other state to have a significant number of observations, averaging about 8% for loaded and empty trucks. Breaking the origins of trips down further, Figure II.6.2 provides indication of the cities from which trucks begin their hauls. The top five origin cities are presented, with Yakima being the primary generator for loaded trucks; however, Seattle is the primary generator overall. Well over 25% of loaded trucks are originating in the Puget Sound region. Approximately 52% of northbound trucks are carrying cargo from just under 100 different cities, while the empty trucks originate from just over 80 cities. 40 P age
50 Figure II.6.1: Origin State/Province. Origin State/Province WA % % % OR % % % CA 5 1.3% 4 1.1% 9 1.2% UT 2 0.5% 0 0.0% 2 0.3% Other 7 1.8% 6 1.7% % Total % % % Figure II.6.2: Origin city. Origin City Yakima % % % Seattle % % % Tacoma % % % Ellensburg % % % Sumner % % % Other % % % Total % % % Similar to the origin state, Washington is the top destination for both loaded and empty trucks heading east (above 92%). British Columbia has the next highest observation count among loaded trucks at 2.6% (Figure II.6.3). Over 50% of loaded and empty, northbound trucks are destined for Wenatchee (including East Wenatchee). A large portion of both empty and loaded trucks end their routes in the Wenatchee region. The Top-5 destination cities for loaded tucks (Figure II.6.4) and destination cities in general are very different than origin cities. Trucks originate from the south and west of the state and, for the most part, end somewhere along US-97 and up into Canada. Since most trucks end their routes in Wenatchee, it isn t surprising that loaded and empty trucks are destined to far fewer cities than where they originated (under 85 for loaded and 40 for empty trucks). 41 P age
51 Figure II.6.3: Destination State/Province. Destination State/Province WA % % % British Columbia % 0 0.0% % FL 4 1.0% 1 0.3% 5 0.7% GA 2 0.5% 0 0.0% 2 0.3% Other % 7 2.0% % Total % % % Figure II.6.4: Destination city. Destination City Wenatchee % % % East Wenatchee % % % Cashmere % % % Chelan % % % Leavenworth % 6 1.7% % Other % % % Total % % % Concentrating now on the facility types that generate northbound flows on US-97, Figure II.6.5 displays the ten option types that were provided for the respondents. Loaded trucks were most likely (45%) to have originated from a Warehouse or Distribution Center (27% empty trucks). As can be expected, a high percentage (37) of empty trucks originate at a Trucking Yard. Besides these two facilities, Agriculture Processing Facilities and, to a smaller extent, Industrial Factories also have a significant number of observations. 42 P age
52 Figure II.6.5 Origin facility types. Facility Origin Trucking Yard % % % Railroad Yard 4 1.0% 1 0.3% 5 0.7% River or Ocean Port % % % Airport 5 1.3% 1 0.3% 6 0.8% Industrial Factory/Sawmill % % % Agriculture Processing Facility % % % Warehouse/Distribution % % % Farm or Forest 4 1.0% 0 0.0% 4 0.6% Retail Store or Gas Station 8 2.1% % % Job/Construction Site % 0 0.0% % Other % % % Total % % % Differing from their origins, destination facilities (Figure II.6.6) for respondent trips were largely attributable to a combination of Warehouse or Distribution Centers and Retail Stores or Gas Stations for loaded trucks (29% and 28%, respectively). Agriculture Processing Facilities remained the same for loaded trucks at 15%. The big change for empty trucks revolves around Agriculture Processing Facilities. Only 9% of empty trucks originated from an Agriculture Processing Facility while 53% were destined to one. The next highest percentage (28) of empty trucks were destined for Warehouse or Distribution Centers. Figure II.6.6: Destination facility types. Facility Destination Trucking Yard 6 1.6% % % Railroad Yard 0 0.0% 1 0.3% 1 0.1% River or Ocean Port 1 0.3% 1 0.3% 2 0.3% Airport 0 0.0% 0 0.0% 0 0.0% Industrial Factory/Sawmill % % % Agriculture Processing Facility % % % Warehouse/Distribution % % % Farm or Forest % 3 0.9% % Retail Store or Gas Station % 6 1.8% % Job/Construction Site % 4 1.2% % Other % % % Total % % % 43 P age
53 Section 7: Characteristic Profile of Westbound Trucks in the Wenatchee Region (US-2) Brief summaries of the westbound trucks, empty and loaded, are displayed in the following tables. Major characteristics of consideration include the origin and destination (O-D) states/provinces and cities, as well as their associated O-D facilities. The overwhelming majority (95%) of trucks surveyed, loaded and empty, originated with Washington (Figure II.7.1). Breaking the origins of trips down further, Figure II.7.2 provides indication of the cities from which trucks begin their hauls. Wenatchee takes the top spot for both loaded and trucks at over 45% and the majority of trucks seem to originate in the Wenatchee region. Approximately 65% of westbound trucks are carrying cargo. Figure II.7.1: Origin State/Province. Origin State/Province WA % % % British Columbia 4 1.0% 4 1.9% 8 1.3% OR 3 0.8% 4 1.9% 7 1.1% ID 2 0.5% 2 0.9% 4 0.7% Other 9 2.3% 1 0.5% % Total % % % Figure II.7.2: Origin city. Origin City Wenatchee % % % Cashmere % % % East Wenatchee % % % Brewster % 4 1.9% % Spokane % 2 0.9% % Other % % % Total % % % Even though Washington is overwhelmingly the destination state of choice, it accounts for 20 percentage points less (Figure II.7.3) than the percentage of loaded trucks originating in Washington (75% vs 95%). California also generates a significant number of destination responses, with over 7%. For trucks without cargo, Washington still account for about 95% of observations. As should be expected, most destination cities are along US-2 or end in the Puget Sound region (Figure II.7.4). Leavenworth takes the top spot at 12% for loaded trucks, with Seattle at 10% and 12% for empty trucks. 44 P age
54 Figure II.7.3: Destination State/Province. Destination State/Province WA % % % CA % 1 0.5% % OR % 8 3.7% % AZ 8 2.0% 0 0.0% 8 1.3% Other % 3 1.4% % Total % % % Figure II.7.4: Destination city. Destination City Leavenworth % % % Seattle % % % Yakima % % % Tacoma % % % Peshastin % % % Other % % % Total % % % Concentrating now on the facility types that generate westbound flows on US-2, Figure II.7.5 displays the ten option types that were provided for the respondents. Loaded trucks were most likely to have originated from a Warehouse or Distribution Center (46%) or an Agriculture Processing Facility (27%). For empty trips, Trucking Yards make up 24% of the observations with Warehouse or Distribution Centers (20%), and Retail Stores or Gas Stations (14%) following close behind. 45 P age
55 Figure II.7.5 Origin facility types. Facility Origin Trucking Yard % % % Railroad Yard 3 0.8% 1 0.5% 4 0.7% River or Ocean Port 1 0.3% 1 0.5% 2 0.3% Airport 1 0.3% 0 0.0% 1 0.2% Industrial Factory/Sawmill % % % Agriculture Processing Facility % % % Warehouse/Distribution % % % Farm or Forest 8 2.1% 7 3.4% % Retail Store or Gas Station % % % Job/Construction Site 8 2.1% % % Other % % % Total % % % Similar to their origins, destination facilities for respondent trips were largely attributable to Warehouse or Distribution Centers for both loaded (40%) and empty (23%). The western Washington ports become a readily apparent attractant in the destinations of westbound trucks on US-2, attracting 9% of the westbound loaded trucks completing the survey. Similar to origination facilities for empty trucks, the top destinations facilities are similar in make-up and percentages except that Retail Stores and Gas Stations are replaced with Industrial Factories and Sawmills. Figure II.7.6: Destination facility types. Facility Destination Trucking yard % % % Railroad yard 3 0.8% 4 2.0% 7 1.2% River or Ocean Port % 2 1.0% % Airport 1 0.3% 0 0.0% 1 0.2% Industrial factory/sawmill % % % Agriculture processing facility % % % Warehouse/distribution % % % Farm of forest 4 1.1% 5 2.5% 9 1.6% Retail store or gas station % 9 4.4% % Job/construction site % % % Other % % % Total % % % 46 P age
56 Section 8: Freight Truck Movements in the Wenatchee Region (Brewster) The efficient movement of goods in and over the Wenatchee Region is vital to the economic vitality of the state and the region. Figure II.8.1 summarizes the survey total for each season, along with the recorded average volumes for the week of the survey (where applicable). As can be seen in the table, each survey session garnered sufficient responses to readily obtain a confidence level of 95% (C.I. 5%). Using the Seasonal weight factor calculations (Appendix A), the average annual daily truck traffic (AADTT) is calculated as 637 (201 empty, and 437 loaded). These figures, multiplied by 312, are used to calculate annual volumes and associated values. Figure II.8.1: Seasonal survey totals. Number of Empty Trucks Surveyed Number of Trucks With Cargo Surveyed Truck Total Volume Seasonal Weight Factor Weighted Value Percent of Trucks Surveyed Confidence Level 95% +/- 5% Fall % Winter % Spring % Summer % Figure II.8.2 captures the aggregated industry groups transporting goods around Brewster, as measured by all surveys collected at the weigh station just north of Brewster. Using commodity values ($/ton) generated from the nationally based Commodity Flow Survey (CFS), the value of the cargo being transported has been estimated. Where available, the values are generated from Washington specific averages of the corresponding industry codes. National averages are used in place of those with insufficient records to generate a state average. 47 P age
57 Figure II.8.2: Wenatchee Region (Brewster) industry survey totals by volume and associated value. SCTG Description Number of Occurrences Total Cargo Weight Average Cargo Weight Total Tonnage Total Value 1 Live animals and live fish 21 1,211,555 57, $ 1,039,107 3 Other agricultural products 130 5,117,463 39,365 2,559 $ 1,943,959 4 Animal feed and animal products ,564 22, $ 188,254 7 Other prepared foodstuffs, fats, oils ,733 20, $ 487,334 8 Alcoholic beverages 5 95,500 19, $ 101, Natural sands 1 56,000 56, $ Gravel and crushed stone ,240 34, $ 3, Nonmetallic minerals 9 449,364 49, $ 19, Gasoline and aviation turbine fuel ,600 52, $ 261, Fuel oils 6 306,000 51, $ 123, Coal and petroleum product 1 45,000 45, $ 17, Basic chemicals 4 122,600 30, $ 50, Fertilizers ,581 29, $ 56, Chemical products and preparations 4 154,040 38, $ 415, Plastics and rubber ,772 19, $ 532, Logs and other wood in the rough ,250 54, $ 41, Wood products 33 1,594,560 48, $ 284, Pulp and paper products 1 2,000 2,000 1 $ Paper or paperboard articles ,232 28, $ 757, Articles of textiles or leather 6 22,800 3, $ 304, Nonmetallic mineral products ,595 30, $ 46, Primary/semi-finished base metal 4 206,087 51, $ 188, Articles of base metal 5 170,500 34, $ 342, Machinery ,900 18, $ 827, Electronic, electrical equipment, components and office equipment ,000 21, $ 6,663, Motorized and other vehicles, parts ,637 14, $ 1,622, Transportation equipment 4 112,500 28, $ 1,564, Precision instruments and apparatus 1 5,000 5,000 3 $ 626, Furniture, mattresses, lamps, lighting fittings, and illuminated signs 8 96,400 12, $ 473, Miscellaneous manufactured products 5 74,000 14, $ 116, Waste and scrap ,255 31, $ 85, Mixed freight ,682 21, $ 976,214 Total $ $20,163, P age
58 Taking a broad perspective is helpful in analyzing the data. Figure II.8.3 (and Figure II.8.4) reveals important information. These trucks, largely originating in Washington, averaged over 16 tons per truck. The value of these same trucks averaged roughly $4,300 per ton. Annualizing the volume and value of the cargo generates in excess of an estimated 2 million tons and $9.7 billion combined in goods moved (Figure II.8.4). Figure II.8.3: Cargo averages a (Brewster) Average Cargo Weight (Tons) Average Cargo Value ($/ton) Brewster $ 4, a Only those records for which a cargo weight was specified by the respondent, and an identifiable cargo value could be determined are included here. Figure II.8.4: Annualized volume and value of cargo in the Wenatchee Region (Brewster) Number of Empty Trucks Number of Trucks with Cargo Total Cargo Weight (Million Tons) Total Cargo Value (Million Dollars) Brewster 62, , $ 9, Section 9: Characteristic Profile of Wenatchee Region (Brewster) Trucks Brief summaries of the Brewster trucks, empty and loaded, are displayed in the following tables. Major characteristics of consideration include the origin and destination (O-D) states/provinces and cities, as well as their associated O-D facilities. The overwhelming majority of trucks surveyed, both loaded and empty, originated within Washington (Figure II.9.1). The Canadian province of British Columbia (BC) also generated a significant amount of observations, more than all other US states combined, absent Washington. This begins to suggest an important relationship between the U.S.-Canadian border and Highway 97. Breaking the origins of trips down further, Figure II.9.2 provides indication of the cities from which trucks begin their hauls. The top five origin cities are presented, with Wenatchee and Brewster being the primary generators both for loaded and empty trucks (about 20%). The trucks, which are carrying cargo, originate from more than 145 different cities, while the empty trucks originate from just over 70 cities. 49 P age
59 Figure II.9.1: Origin State/Province. Origin State/Province WA % % % British Columbia % % % OR % 3 1.3% % CA % 1 0.4% % NV 8 1.5% 0 0.0% 8 1.0% Other % % % Total % % % Figure II.9.2: Origin city. Origin City Wenatchee % % % Brewster % % % Spokane % % % Chelan % 4 1.7% % Okanogan % % % Other % % % Total % % % Washington and British Columbia account for greater than 80% of origin and destination states for loaded trucks and greater than 90% for empty trucks. As should be expected, destination states are slightly more dispersed than are the coinciding origins, though still largely dominated by intrastate travel (Figure II.9.3). Even though Washington and British Columbia make up the same percentage of destination states as origin states, the number of destination states for loaded trucks exceeds that of origin states by more than 50%. Of the top destination cities, only one out-of-state city, Kelowna, British Columbia, cracks into the Top- 5 for loaded tucks (Figure II.9.4). For those trucks with and without cargo, the attraction to Wenatchee significantly drops off, with just under 2% of the destinations. Replacing it as the top destination city for loaded trucks is Omak with 13%. Brewster maintains the top spot for empty trucks for both origin and destination cities. Okanogan and Brewster are the only cities in the top 5 for both origin and destination. 50 P age
60 Figure II.9.3: Destination State/Province. Destination State/Province WA % % % British Columbia % % % CA % 7 2.9% % OR % 6 2.5% % NY 6 1.1% 0 0.0% 6 0.8% Other % 7 2.9% % Total % % % Figure II.9.4: Destination city. Destination City Omak % % % Oroville % % % Kelowna % 8 3.4% % Brewster % % % Okanogan % % % Other % % % Total % % % Concentrating now on the facility types that generate flows near Brewster, Figure II.9.5 displays the ten option types that were provided for the respondents. Loaded trucks were most likely (35%) to have originated from a Warehouse or Distribution Center (15% for empty trucks). Industrial Factories or Sawmills and Agriculture Processing Facilities account for another 20% each for loaded trucks. Combined, these 3 origin facilities account for over 70% of loaded trucks. Overwhelmingly, most trucks without cargo originated from a trucking yard (42%). 51 P age
61 Figure II.9.5 Origin facility types. Facility Origin Trucking Yard % % % Railroad Yard 1 0.2% 0 0.0% 1 0.1% River or Ocean Port 1 0.2% 0 0.0% 1 0.1% Airport 1 0.2% 0 0.0% 1 0.1% Industrial Factory/Sawmill % % % Agriculture Processing Facility % % % Warehouse/Distribution % % % Farm or Forest % 7 3.1% % Retail Store or Gas Station % % % Job/Construction Site 5 1.0% 3 1.3% 8 1.1% Other % % % Total % % % Similar to their origins, destination facilities (Figure II.9.6) for respondent trips were largely attributable to Warehouse or Distribution Centers (30%) for loaded trucks. Agriculture Processing Facilities accounted for roughly the same percentage as origin facilities. Not surprisingly, Retail Stores and Gas Stations make up a large percentage (20) of destination facilities for loaded trucks. Upwards of 50% of empty trucks seem to end their route at one of the top 3 origin facilities (Industrial, Agriculture, and Warehouse). Figure II.9.6: Destination facility types. Facility Destination Trucking Yard % % % Railroad Yard 1 0.2% 1 0.5% 2 0.3% River or Ocean Port 0 0.0% 0 0.0% 0 0.0% Airport 1 0.2% 0 0.0% 1 0.1% Industrial Factory/Sawmill % % % Agriculture Processing Facility % % % Warehouse/Distribution % % % Farm or Forest % % % Retail Store or Gas Station % 7 3.3% % Job/Construction Site % 8 3.8% % Other % % % Total % % % 52 P age
62 Section 10: Roadway Usage and Major Bottlenecks Given the survey locations sites selected for consideration, only a segment of the truck-freight traffic has been captured. However, the segments captured do collect the major ingress and egress means from the Wenatchee area. Figure II.10.1 below summarizes the major roadway segments used within the region by those trucks captured in the survey. Substantial values obviously occur on the roadways being surveyed. It is important to note in the table below that double counting does occur when a particular truck trip use the same highway on two different segments. For example, US 97 would be counted twice if the respondent indicated that they began in Brewster, heading south on US-97 then travelled west on US-2 and then again south on US-97. An additional important note lies in few respondents indicating that they travelled on the Sunset Hwy; most simply identified it as SR-28. However, numerous respondents did indicate the Sunset Highway as a major source of bottlenecks (Figure II.10.2). Bridges (116 comments) and Round-A-Bouts (84 comments) were often cited by respondents as their major cause of concern on roadways within their trip (Figure II.10.2). The George Sellar Bridge was of particular concern to SR-28 travelling respondents. Of the roadways specifically identified that can be related to Wenatchee specifically, the Sunset Hwy and Wenatchee Avenue drew particular ire. 53 P age
63 Figure II.10.1 Segment occurrences of major highways and streets. Roadway Name or Number Survey Location US-2 Westbound US-97 Northbound SR-28 East SR-28 West Brewster a Chumstick Grant Main Miller Sunset Walla Walla Wenatchee P age
64 Figure II.10.2 Major bottlenecks. Survey Location Brewster US-97 NB US-2 WB SR-28 EB SR-28 WB Total Specific Highways Indicated I I-90 (Snoqualmie Specific) Other Roads Mentioned Baker Flats Grant Road Sunset Hwy Wenatchee Ave Bridges Indicated Bridges (any mention) George Sellar Bridge Peshastin Bridge Other Road Features Lights Passing Lanes Round-A-Bouts Construction Rough Roads Section 11: Conclusion The preceding sections highlight several of the major themes of the data collected in the intercept survey in the greater Wenatchee region. The survey instrument is available in Appendix II.B to gauge the full detail of information collected from the drivers. The survey effort successfully completed in excess of 90% of attempted interviews with drivers. This result is indicative of the excellent work provided by the volunteer crew of Service Club members and the eagerness of the drivers themselves to contribute to a better understanding of roadway conditions. 55 P age
65 Accompanying this report is the full data set generated from the survey effort. The first several tabs include pivot tables allowing the formulation of many differing aggregations of the data beyond what is included in this report. These pivot tables may be used to generate tables relating to any number of potential questions related to differing characteristics of the network, drivers, or commodity being transported. 56 P age
66 [This Page Intentionally Left Blank] 57 P age
67 Appendix II.A Methodology Data Collection Methods and Issues The FPTI origin and destination (O-D) survey was designed to provide a statistically reliable and comprehensive database of freight truck movements on select highway corridors in the state of Washington. A varied set of truck trip and shipment characteristics were determined and incorporated into the survey. Examples of such information include the carrier, truck type, unloaded truck weight, payload weight, commodity type, and the origin and destination facility type(s) (See Appendix B for Instrument). Detailed information on the highways and routes used by the drivers was also collected as an aid in identifying the major and minor freight corridors within and through Washington. Ten interview sites at permanent weigh stations (6), ports of entry (1), and other sites (3) deemed safe by the Washington State Patrol s Commercial Vehicle Enforcement Officers (CVEOs) were utilized to implement the driver survey. Unlike previous FPTI O-D surveys that broadly covered the entire state, the surveys targeted WSDOT identified corridors of interest. Data was collected during a four-week period in each season (Fall (Oct-Nov 2012), Winter (Jan-Feb 2013), Spring (Apr-May 2013), Summer (Jul-Aug 2013), Fall (Oct-Nov 2013)) (Figure II.A-1). The sequential surveys were conducted to allow seasonal traffic flow comparisons to be made. Data collection was conducted on the same day of the week for the specified sites to allow continuity between seasons. As a rule of thumb, surveys were not conducted on holidays or on Mondays and Fridays so as to avoid any generated unusual flow patterns. Surveys on I-90 were conducted over 24-hr periods (2pm- 2pm). All other sites began operation in the early morning hours, 5, 6, or 7am dependent upon historic truck counts. To best capture the highest volume of traffic, all effort was made to capture the time period in which greater than 80% of the truck traffic could be reasonably expected to pass the survey sites. Evening shutdown of the survey operations was dependent upon the density of truck flow and was typically halted when volumes reached fewer than five trucks per hour. 58 P age
68 Figure II.A-1: Survey Schedule DATE LOCATION HOURS October 23, 2012 I-90 W of Cle Elum WESTBOUND 24hr beginning 2:00pm October 24, 2012 I-90 W of Cle Elum EASTBOUND 24hr beginning 2:00pm October 30, 2012 US-2 W of Wenatchee EASTBOUND 5:00am November 1, 2012 US-2 W of Wenatchee WESTBOUND 5:00am November 6, 2012 SR-28 E of Wenatchee EASTBOUND 5:00am November 8, 2012 SR-28 E of Wenatchee WESTBOUND 5:00am January 29, 2013 US-2 W of Wenatchee EASTBOUND 5:00 am January 29, 2013 US-395 Kettle Falls SOUTHBOUND 7:00 am - January 31, 2013 US-2 W of Wenatchee WESTBOUND 5:00 am February 5, 2013 SR-28 E of Wenatchee EASTBOUND 5:00 am February 5, 2013 US-395 Chewelah NORTHBOUND 7:00 am - February 7, 2013 SR-28 E of Wenatchee WESTBOUND 5:00 am February 12, 2013 US-395 Deer Park SOUTHBOUND 7:00 am - February 13, 2013 US-97 N of Brewster at US-97/SR-17 7:00 am - February 19, 2013 I-90 W of Cle Elum WESTBOUND 24hr beginning 2:00pm February 20, 2013 I-90 W of Cle Elum EASTBOUND 24hr beginning 2:00pm April 23, 2013 I-90 W of Cle Elum WESTBOUND 24hr beginning 2:00pm April 24, 2013 I-90 W of Cle Elum EASTBOUND 24hr beginning 2:00pm April 30, 2013 US-2 W of Wenatchee EASTBOUND 5:00 am April 30, 2013 US-395 Kettle Falls SOUTHBOUND 7:00 am - May 2, 2013 US-2 W of Wenatchee WESTBOUND 5:00 am May 7, 2013 SR-28 E of Wenatchee EASTBOUND 5:00 am May 7, 2013 US-395 Chewelah NORTHBOUND 7:00 am - May 9, 2013 SR-28 E of Wenatchee WESTBOUND 5:00 am May 14, 2013 US-395 Deer Park SOUTHBOUND 7:00 am - May 15, 2013 US-97 N of Brewster at US-97/SR-17 7:00 am - July 23, 2013 I-90 W of Cle Elum WESTBOUND 24hr beginning 2:00pm July 24, 2013 I-90 W of Cle Elum EASTBOUND 24hr beginning 2:00pm July 30, 2013 US-2 W of Wenatchee EASTBOUND 5:00 am July 30, 2013 US-395 Kettle Falls SOUTHBOUND 7:00 am - August 1, 2013 US-2 W of Wenatchee WESTBOUND 5:00 am August 6, 2013 SR-28 E of Wenatchee EASTBOUND 5:00 am August 6, 2013 US-395 Chewelah NORTHBOUND 7:00 am - August 8, 2013 SR-28 E of Wenatchee WESTBOUND 5:00 am August 13, 2013 US-395 Deer Park SOUTHBOUND 7:00 am - August 14, 2014 US-97 N of Brewster at US-97/SR-17 7:00 am - October 29, 2013 US-395 Kettle Falls SOUTHBOUND 7:00 am - November 5, 2013 US-395 Chewelah NORTHBOUND 7:00 am - November 12, 2013 US-395 Deer Park SOUTHBOUND 7:00 am - November 13, 2012 US-97 N of Brewster at US-97/SR-17 7:00 am - 59 P age
69 Approximately 9,000 driver interviews were collected (roughly equivalent per season) to complete the entire origin and destination survey. Refer to Section 1 for Wenatchee area specific counts. Additionally, estimates of the number and direction of non-sampled trucks were made during the interview periods. Estimates are based on either actual truck counts established during the collection period or on historic counts under similar conditions. Actual counts were taken where feasible. These counts were then used to construct weighted estimates of total truck volumes at each location by season. The results presented in this study are derived from these weighted truck trip estimates. The driver interviews were conducted by a team of Washington State University personnel assisted by members of local Lions clubs throughout the survey regions. Survey locations were typically staffed by 4 to 6 individuals, resulting in personnel hours accrued conducting driver interviews each survey day. Driver participation in the survey was high, with locations reporting 95 to 100 percent response rates. A copy of the survey questionnaire is included as Appendix B of this report. Data Management, Analysis and Modeling Procedures This section briefly highlights key procedures used within this data framework. More detailed information can be found in Strategic Freight Transportation Analysis Report Number 2, Freight Truck Origin and Destination Study: Methods, Procedures and Data Dictionary. 8 Data Management It is important to maintain effective management of data during collection, entry into a database, and during all subsequent analyses. Following and implementing appropriate management techniques helps ensure that the compiled database accurately reflects the statewide freight movements in Washington. There are three possible sources of error that can be attributed to on-site data collection issues. Systemic problems arise from poorly worded questions, incorrect interview procedures and/or problems stemming from sub-optimal site selection. Data problems may come from drivers who provide inaccurate information in response to the survey questions. Finally, interview personnel may fill out the survey incorrectly, providing inaccurate data regarding vehicle information or driver responses. Errors stemming from improper data collection technique were minimized through a constant monitoring of the survey and data entry personnel. On-site monitoring allowed specific problems to be P age
70 immediately addressed with the interviewer. Problems identified during data entry were addressed during the following survey season. One persistent entry error occurred relative to the weight of cargo. Respondents occasionally indicated their gross vehicle weight (GVW) rather than their cargo only weight (payload). Where this event was readily identifiable (e.g. where the combined answers of the empty and cargo weights of the truck grossly exceeded 105,500 pounds), the data entry was adjusted such that the empty truck weight was subtracted from the identified GVW to obtain a payload weight. Surveys that were identified as not being able to be reliably adjusted, were not included in any calculation of the respective variable. Data Analysis and Modeling The data obtained in the driver interviews was entered into a MS Excel database in table format. Additional information from various sources was systematically added to the database in order to provide greater depth of analysis. For example, traffic counts from the WSDOT Traffic Data Office were used when and where feasible to verify and correct the sample weights obtained during the survey period. The use of the MS Excel platform also allows for the incorporation of database information from such sources as the US Census Bureau, the USDOT Bureau of Transportation Statistics and other federal, state and local transportation databases. Linkage of these various databases was and is accomplished by the use of the Standard Classification of Transported Goods (SCTG) code. This code was identified using information obtained during the driver interview about the primary commodity content of the cargo being transported. This information is critical to identifying commodity flows and volumes moving on state highways. In order to best present the survey data in a meaningful manner, site specific seasonal weight factors based upon the total number of trucks passing each survey site during the day of the survey was calculated. Where feasible, truck counters, either tube or permanent, were used to estimate the total volume. To calculate the seasonal weight factor for each site/season, the total number of trucks in a 24- hour period was divided by the total number of surveys collected at each site. The seasonal weight factor is used to expand the collected data characteristics to represent the entire population of trucks at each 61 P age
71 survey location. This expanded information was a representation based upon the total number of daily truck trips. 62 P age
72 Appendix II.B 63 P age
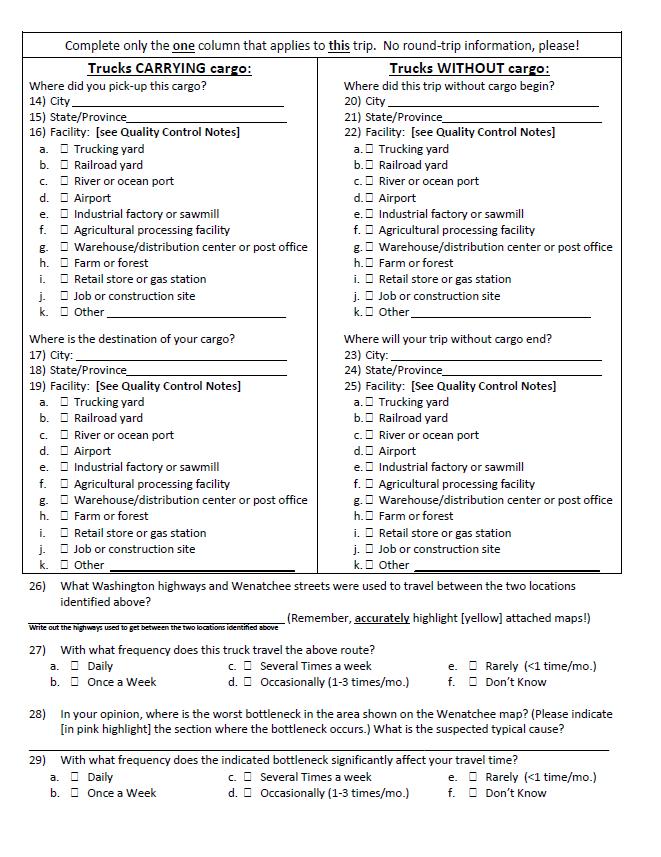
73 64 P age