Real-World Challenges, Real-World Solutions
|
|
|
- Susanna Robinson
- 5 years ago
- Views:
Transcription


1 Real-World Challenges, Real-World Solutions Using big data and information analytics Performance Measures Planning Operations Archive Communications Enabling Effective Decision Making With Data

 RITIS")
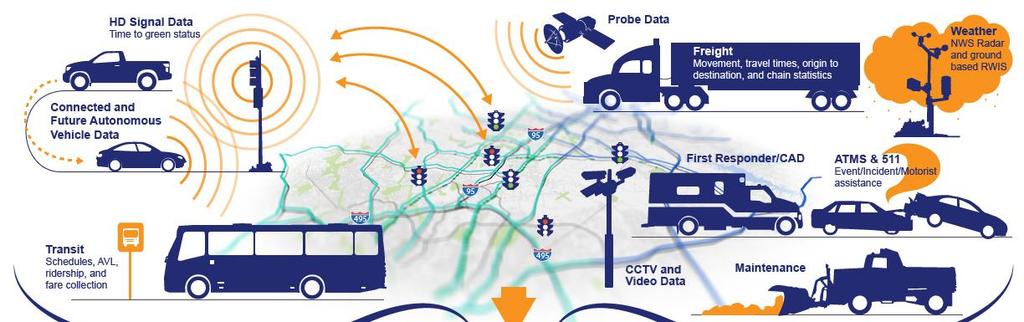
2 RITIS: Fuse Data and Produce Actionable Information in Real Time (Potentially every data stream that is available) RITIS Fusion & DSS
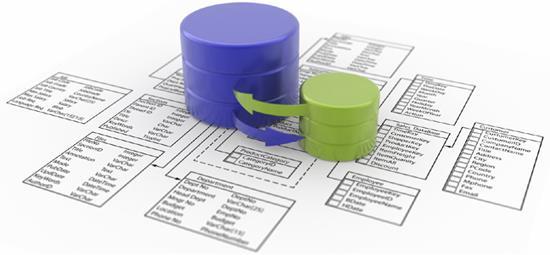
3 RITIS: Archive and Analyze Data to Support Decision Making (Potentially every data stream that is available) RITIS Fusion & DSS
 CCTV, weather, radio, etc: (no stats")
4 How Much Transportation Data Flows Through RITIS? RITIS Today: Traffic accidents: 120,000 records per day: Gb/day Traffic detectors: 45,000,000 records per day: 5 Gb/day Probe vehicle data: 7,500,000,000 records per day: 550 Gb/day (expected to jump to 8 Trillion) CCTV, weather, radio, etc: (no stats kept) records per day:??? Tb/day V2X & Automation data:?,???,???,???,??? records per day:????b/day (Starting in 6 months)


5 Our Goal is to: Provide tools to make data easily accessible, usable, understandable, and allowing for insights discovery To domain experts or the general public


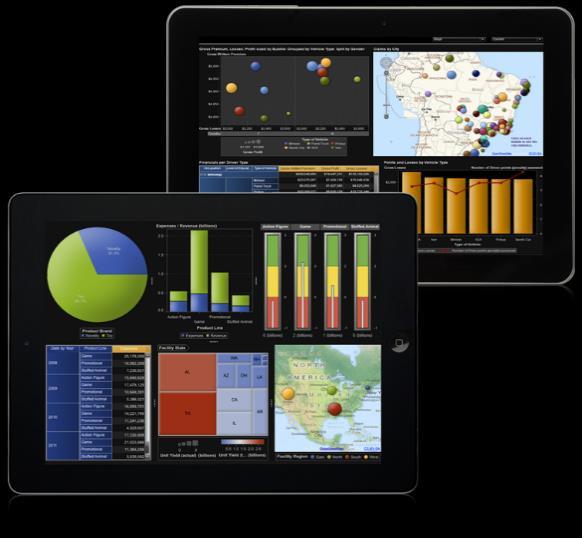


6 The Components of a Great Big Data System Data + + = Tools Fusion, Statistics, Analysis & & Integration Visualization Domain Expertise Insights
7 There Are Many Use Cases for Transportation Visualizations Operations Situational Awareness Decision Support Information Sharing Coordination Evacuation Support AARs Etc. Research Open Data Ease of Access Planning Identifying problems Prioritizing Projects Before & After Studies Etc. Traveler Information Blending multi-agency data Public and Private Data APIs for 3 rd Parties 7
8 Challenge: After Action Reviews There s just been a serious fatal incident on I-70. The incident took a long time to clear maybe too long. The Director of Operations is asking you to facilitate an after action review meeting with the DOT, fire service, police, and others to understand what was done well and what could have been done better. If you find any problems, can you use multiple AARs from similar incidents to create a case for changing policies related to incident clearance in the state? 8


9 I-70 fatality incident Background Occurred on October 29, 2016 at around 4:30 AM Located on I-70 West, past Exit 80 - MD 32 Sykesville Rd A car hit a deer, then a tractor trailer hit the car, and jack-knifed, resulting in one fatality All lanes were closed in the WB direction for over 7 hrs It took about 11 hrs to fully clear the incident and reopen all lanes March 9,

10 I-70 fatality incident Several RITIS / PDA tools were used to conduct impact analysis and provide visual content as part of an After Action Review EQT/ Incident Timeline Region Explorer Trend Map Congestion Scan User Delay Cost March 9,
11 I-70 fatality incident Incident Timeline EQT Event Query Tool Used to review responder response times, lane & event clearance times, and Operator notes. Timeline graphics are inserted in to AARs Heat Map is used to see trends in incident activity EQT analyzes your ATMS event data for insight into event impacts on your roadway system, through auto-created tables, charts and maps. Timeline displays how an incident is being managed by showing the relationships between responder notifications & arrival times, lane status, traffic queues, clearance times, communication logs, CCTV, and DMS. March 9,

12 Integrated Event Management TOC Communications Notifications & Responders Lane Status Overhead Sign Messages Speed Readings March 9,

13 TOC Communications March 9,

14 Notifications & Responders March 9,

15 Lane Status, Sign Messages, Speeds March 9,


16 Event Query Tool Heat Map Events from MDOT CHART that started between September 1, 2016 and October 31, 2016 March 9,

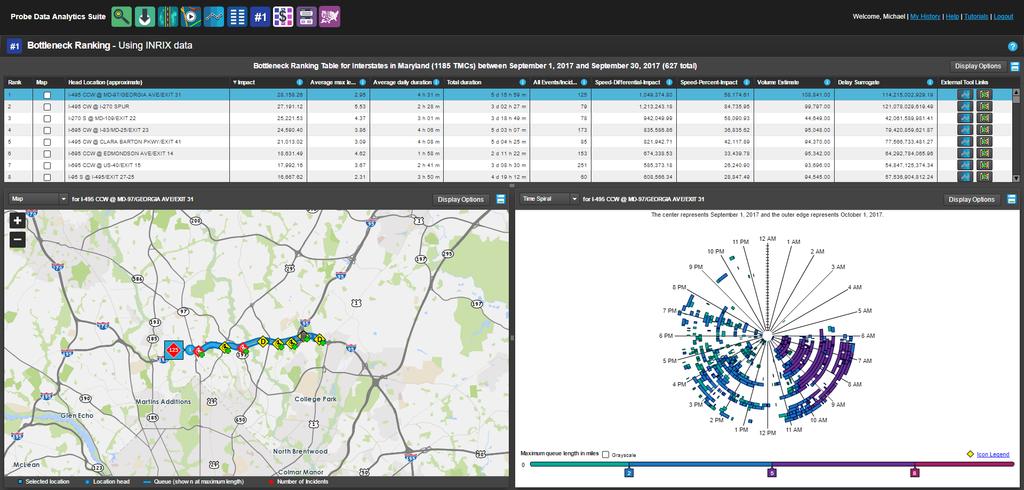
17 I-70 fatality incident Region Explorer Used to determine the choke points of traffic during the incident, and future detour points Helps improve Quick Clearance practices by honing in on the effects on tertiary roadways An interactive traffic conditions app that can be used to explore the impacts of bottlenecks and incidents along a road, in real-time, or previous point in time. March 9,

18 Bottleneck Locations at 12:00 PM on Bottlenecks March 9,
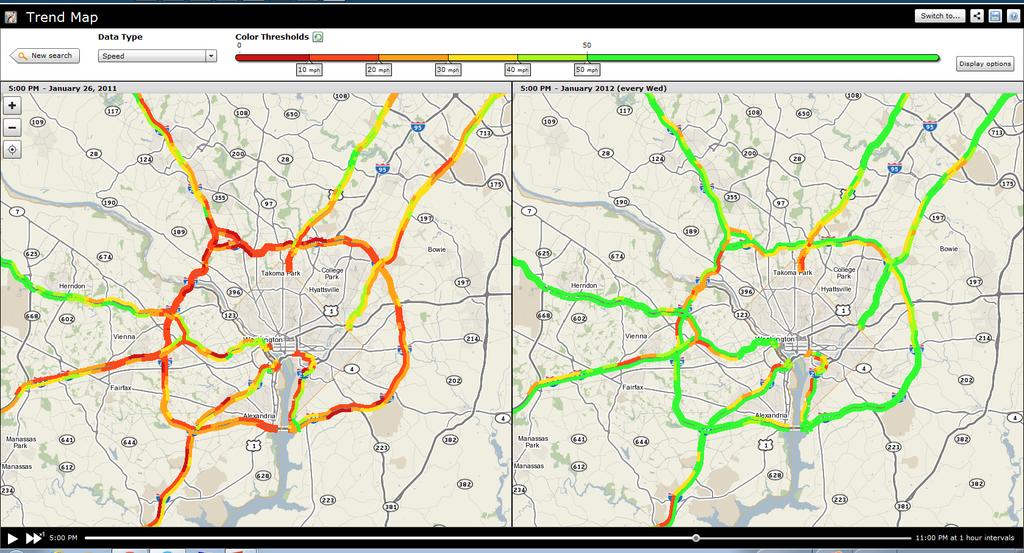
19 I-70 fatality incident Trend Map Used it to determine the significance of the delay over the time of the incident s duration Using it as a case to promote Quick Clearance practices An animated congestion and event conditions map that dynamically displays changes over time. March 9,

20 Congested Locations at 12:15 PM on March 9,
21 I-70 fatality incident Congestion Scan Used to view historical extent of the queue Queue graphics are inserted into AARs for emphasis Analyze temporal and spatial conditions on one or more stretches for road, selecting from several mobility and reliability performance metrics. March 9,

22 Comparing Oct. 29 th to the prior Saturday October 22, 2016 October 29, 2016 March 9,
23 I-70 fatality incident User Delay Cost The tool we use more heavily Helps put things into dollars and cents, to prove the value of our TSM&O program Crucial to our program s funding is to prove the benefit of Quick Clearance practices By analyzing the cost of a long-duration incident, we can better make the case for additional or improved resources Example: for this incident, we were able to make the case that the State Police need an adjustment to how it manages it s tow list ( i.e.; a company should be able to prove that it has the necessary equipment for heavy duty operations) Combine speed data with volume data to estimate the cost of delay (and other measures) due to congestion. March 9,
 $86.")
24 What s the User Delay Cost on the following roads Assuming an Average Value of time of: $16.79 per hour (Passenger Vehicles) $86.81 per hour (Commercial Vehicles) (NOTE: User Delay is calculated any time speeds fall below free-flow) March 9,

25 User delay on I-70 and nearby arterials Normal Saturday = $6k - $7k Oct. 29th Saturday = ~$77k Worse than Friday the day before! March 9,
26 Challenge: Effectively Managing Work Zones How can I understand how my work zones are performing? Am I causing more problems than I m solving? Am I creating safety issues? 26

27 Work Zone Dashboard Overview Critical List Map Delay (C) 2015 Michael L. Pack, University of MD CATT Laboratory 27

28 Current Work Zone List (C) 2015 Michael L. Pack, University of MD CATT Laboratory 28
29 Individual Work Zone Profile Settings Map L A N E Perf. Charts Delay (C) 2015 Michael L. Pack, University of MD CATT Laboratory 29


30 Lane Profile Interaction Bottlenecks & Nearby Events Segment Speeds Live CCTV & DMS (C) 2015 Michael L. Pack, University of MD CATT Laboratory 30

31 Individual Work Zone Profile (C) 2015 Michael L. Pack, University of MD CATT Laboratory 31

32 Adjusting Parameters (C) 2015 Michael L. Pack, University of MD CATT Laboratory 32
33 Work Zone Alerts (C) 2015 Michael L. Pack, University of MD CATT Laboratory 33
34 Problem: Identifying and Prioritizing Projects Your agency continues to struggle with its budget. Times are tough, and you don t have enough money to fix every problem out there. You need to spend wisely based on real data, not politics. Your decisions are going to be scrutinized. What are you going to do? 34
35 35

36 User Delay Cost at this Location: $50.8M
37 37

38 Press Releases: Pre-Thanksgiving traffic vs. normal 2PM Wed. Before Thanksgiving 2PM Normal Wednesdays in November
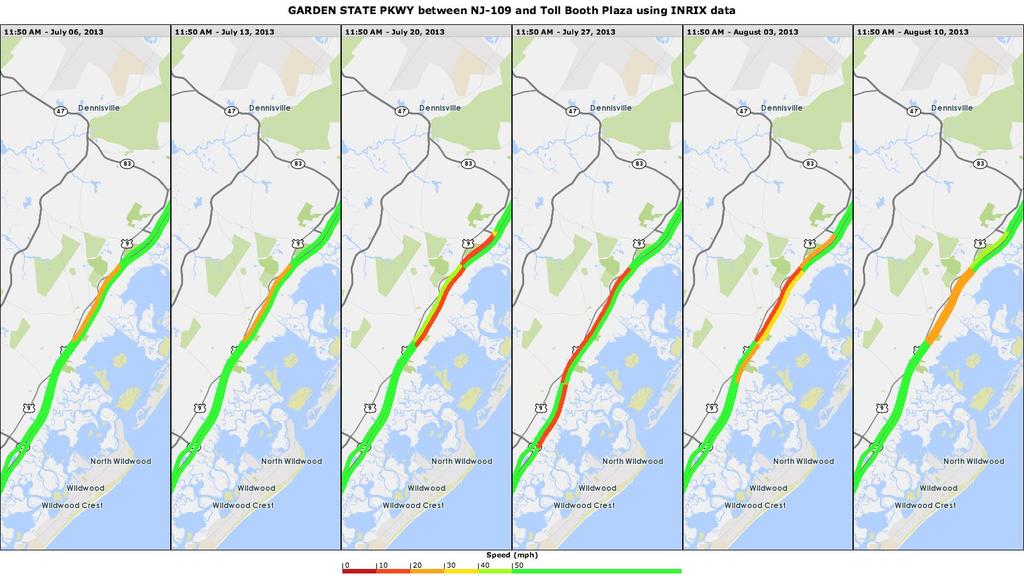
39 Problem: Justify your recent investment/project You just spent millions removing a bunch of traffic signals on the Garden State Parkway. Was it worth it? Did you improve things? How can you justify your expenses to the public? 39
40 7 Saturdays in 2013 (before work to remove 3 signals) 40

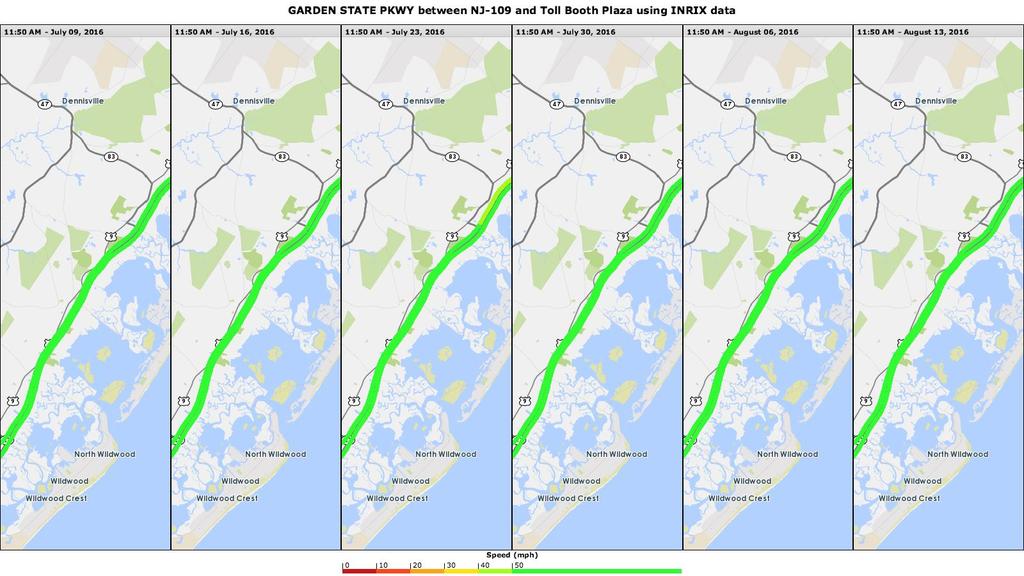
41 7 Saturdays in 2016 (after removal of signals) 41
42 42
43 43


44 Thank You! Nikola Ivanov