Statewide Multi-Modal Freight Model
|
|
|
- Phebe Sims
- 5 years ago
- Views:
Transcription
1 Statewide Multi-Modal Freight Model presented to MTF Freight Modeling Session presented by Maren Outwater and Colin Smith, RSG June 19, 2013 Outline Supply Chain and Logistics Models Model steps Integration into statewide model (FSUTMS) Simulating shipments at a statewide level Project status and remaining work Freight Forecasting Framework Regional truck touring models Integration with supply chain model 2 1
2 Motivation for the Model Enhance Florida s statewide freight forecasting capabilities Represent supply chains and distribution channels Include 4 modes and inter modal connections Provide policy sensitivity for buyer and supplier firm choices AND Provide a framework to support enhancements to regional freight forecasting Represent pick up and delivery systems in regional areas Account for empty trucks and non freight carrying trucks Provide sensitivity for firm logistics choices 3 Model Structure Overview Florida Statewide Model National Supply Passenger Chain Model (Firms, Model Shipments, Modes) Conversion to modal trip tables National/Statewide Networks Regional Model Regional Model Regional Model Regional Truck Pax Touring Model Model Regional Networks 2


 For each buyer/supplier pair, converts an annual")


 TAZs provide detailed")


3 Statewide Model Framework Firm Synthesis Supplier Selection Goods Demand Distribution Channel Shipment Size Mode and Transfers Network Assignment Synthesizes a list of businesses in Florida, the rest of the US, and an international sample Connects suppliers to buyers based on the commodities produced by the supplier andconsumed by the buyer Distributes commodity flows amongst the paired suppliers and buyers For each buyer/supplier pair, selects whether shipments are direct or involve intermediate handling (intermodal, distribution center) For each buyer/supplier pair, converts an annual commodity flow to shipments by size and frequency Identifies the mode for each leg of the trip from supplier to buyer and the transfer locations Assign the trips to the multi modal networks based on the mode(s) and transfer locations 5 Firms and Commodity Flow Data Individual firms are synthesized in each traffic analysis zone (TAZ) based on employment data for each industry (County Business Patterns, InfoUSA, QCEW, and other local data) TAZs provide detailed spatial resolution, particularly in metropolitan areas, for firm locations and shipment origins and destinations Across the whole of Florida, the TAZs provide a significant level of detail FAF commodity flow data, a model input, uses large FAF zones. This is disaggregated down to TAZs based on the firm allocations and economic (input/output) data 6 3


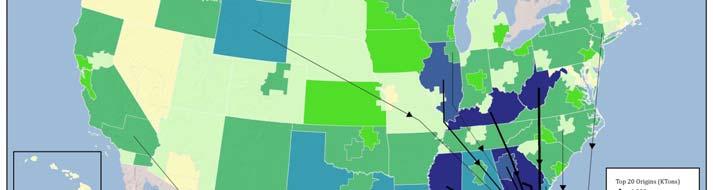
4 Transportation Networks Model covers all of Florida and includes transportation networks across the USA and internationally Uses newest multi modalmodal transportation networks: highway, rail, seaports and waterways, airports, and intermodal connections Uses network information to understand transportation costs (including storage costs during transshipment), capacities, and resulting travel times Model outputs vehicle and commodity flows on networks and through intermodal/distribution centers 7 Modeling a Shipment Into Florida 8 4
 Truck")
")


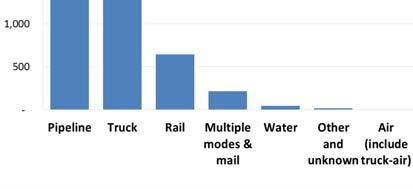
5 Modeling a Shipment Leaving Florida 9 Mode Shares in Florida By Weight (KTons) Truck Rail Multiple modes & mail Other and unknown Water Pipeline Air (include truck air) Florida Florida 682,796 16,835 8,695 8, ,501 Florida Rest of US 45,501 10,753 18,838 1,421 3, ,711 Rest of US Florida 69,204 38,053 17,759 1,518 18,427 21, ,573 Total 797,501 65,640 45,292 11,647 22,277 22, ,784 Total By Value (M$) Truck Rail Multiple modes & mail Other and unknown Water Pipeline Air (include truck air) Florida Florida 492,858 2,008 16,001 15, ,979 Florida Rest of US 84,470 3,843 57,715 3, , ,221 Rest of US Florida 171,236 13,840 82,911 5,730 8,736 8,246 13, ,928 Total 748,563 19, ,627 24,855 9,450 8,442 19, ,128 Total 1 0 5

 (by")
6 Freight Flows in Florida Top Commodities (by Weight) Top Commodities (by Value) Gravel 21% Machinery 17% Nonmetal min. prods. 20% Electronics 9% Waste/scrap 9% Mixed freight 8% Gasoline 7% Motorized vehicles 6% Natural sands 6% Gasoline 6% Nonmetallic minerals 3% Pharmaceuticals 6% Logs 3% Articles base metal 4% Other ag prods. 3% Misc. mfg. prods. 4% Other foodstuffs 3% Other foodstuffs 3% Cereal grains 3% Precision instruments 3% 11 Freight Flows to and from Florida Commodity Flows from Florida Top Commodities Top Commodities (by Weight) (by Value) Fertilizers ers 15% Electronics 13% Commodity Flows to Florida Top Commodities (by Weight) Top Commodities (by Value) Coal 18% Electronics 14% Other foodstuffs 10% Precision instruments 9% Coal n.e.c. 14% Motorized vehicles 10% Cereal grains 9% Pharmaceuticals 8% Gasoline 9% Textiles/leather 7% Newsprint/paper 7% Textiles/leather 7% Other foodstuffs 5% Misc. mfg. prods. 7% Waste/scrap 6% Motorized vehicles 7% Fertilizers 4% Pharmaceuticals 6% Other ag prods. 5% Misc. mfg. prods. 6% Fuel oils 4% Machinery 5% Basic chemicals 5% Machinery 6% Nonmetal min. 4% Mixed freight 5% Nonmetallic prods. 5% Other foodstuffs 4% minerals Wood prods. 3% Precision instruments 4% Wood prods. 4% Mixed freight 4% Basic chemicals 3% Plastics/rubber 4% Nonmetal min. prods. 3% Transport equip. 3% Newsprint/paper 2% Other foodstuffs 3% Note: Including Total flows Source: FAF3 Note: Including Total flows Source: FAF3 12 6


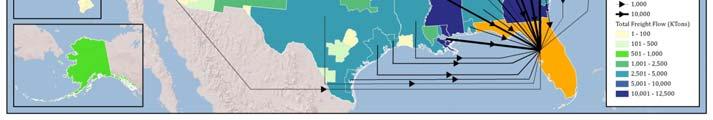
7 Freight Flows by Mode to and from Florida 13 Freight Flows into Florida 14 7


8 International Freight Flows to and from Florida Example: Gasoline imports from the rest of the Americas Gasoline imports arrive at ports and are mainly distributed in the region close to the port, with relatively small amounts trucked to other regions 15 Freight Forecast Growth (2007 to 2040) FHWA s FAF includes forecasts out to 2040 High growth forecast in outbound flow from Florida Growth hin Tonnages Growth in Value 16 8
9 Statewide Policy Sensitivity Changes in land use and economy Spatial distribution of employment and mix of industries Changes in transportation supply Major highway network changes Changes to rail capacity Intermodal facility capacity changes, including deep water ports and airports Changes in distribution center network New facilities i (with regional significance) ifi Changes in commodity flow origins and destinations outside Florida 17 Project Status and Next Steps Developed data inputs and assumptions Developed multimodal networks (rail, air, water, truck) Integrated supply chain models with FSUTMS passenger travel models Developed validation data by mode Calibration and validation of freight models underway Scheduled to complete in October


10 Regional Model Framework Shipment Flows (from Statewide Model) Vehicle and Tour Pattern Choice Number of Tours and Stops in each Tour Stop Sequence and Stop Duration Tour Start Time and output of Trip List Truck Touring Models Warehouse 120 Chicago Region Delivery tour Implemented in Chicago region for CMAP as part of FHWA project Modellinks links shipment deliveries and pick ups together into truck tours Tours built for different truck types and for different patterns: single stop, single loops, several returns to warehouse Output is a trip schedule similar to that from an activity based model of personal travel 10
11 Regional Policy Sensitivity Regional model input is the output from the statewide model, so statewide model s sensitivity feeds through to regional model Local (more detailed) distribution of employment and land use affects local truck travel patterns Local changes in transportation supply, non truck traffic growth causing congestion, and resulting truck travel times Local policies such as truck routes, truck prohibitions, delivery windows, and size limits can be modeled Connections to the Statewide Model Statewide model is designed to be integrated with regional models Statewide model develops shipment paths including transfer locations and modes, and intercity truck movements Statewide model outputs include a list of regional shipment pick ups and deliveries that must be met in a given day: that can then be microsimulated in the regional model Possible modes of operation Integrate complete statewide model with regional model and run models sequentially Provide an extract from the statewide model of regional shipment demand and run the regional model separately 11
12 Regional Model Implementation Data needs: establishment surveys and truck surveys (travel behavior inventory) to support regional model development and calibration Pilot a regional truck model in partnership with an MPO/District, integrated within their regional model Consider further regional implementations Contact Maren Outwater maren.outwater@rsginc.com Colin Smith colin.smith@rsginc.com