Measuring Freight Movement in Ohio Urban Areas:
|
|
|
- Pearl Patrick
- 5 years ago
- Views:
Transcription
1 Measuring Freight Moveent in Ohio Urban Areas: Available Data Sources Peter S. Lindquist University of Toledo Septeber 14, 2010
2 Midwest FreightView Great Lakes Maritie Inforation Delivery Syste Provides a centralized repository for regional freight data with convenient secure access Manageent of a coprehensive database relating: Econoic activity aong all sectors Regional population patterns Iport and export flows Intra-regional flows Interodal connectivity Coprehensive, sealess, spatially registered and current data repository in a GIS fraework Internet-Based Delivery: CITRIX MetaFrae Environent
3 Midwest FreightView Great Lakes Maritie Inforation Delivery Syste Assebly of a regional database that can support freight odeling efforts Data support functions for freight analysts, public officials and policy analysts Projected users: Federal, state, and local governents Metropolitan planning organizations (MPOs) Transportation Trade Groups University research centers Other public stakeholders

4

5

6 Pull down enu

7 AADTT 2010

8 Iron and Steel Mills (IMPLAN) & Downbound Crude Material Tonnage (USACE)
9 Midwest FreightView Contents of Online Database Contents of Data Repository Future Additions to Repository and Online Database
10 Midwest FreightView Online Data Current Network Data: ORNL CTA North Aerican Highway Network NHPN (FAF) Highway Network Integrated Highway Network Updated ORNL CTA North Aerican Rail Network North Aerican Transportation Atlas Data (NORTAD) BTS Interodal Terinals, Ports, Airports USACE Dock Data (Master Docks Plus Database) FAF Zones and Centroids INTERMODAL FAF 2002 OD Flows (National Scale) FAF Provisional OD Flows (National Scale)
11 Midwest FreightView Online Data, Continued Econoic/Population Data: US Census of Agriculture / NASS Data (County-Level) Deographics Plus 2003 Business Counts Tract+ US Census 2000 Long For Database Tract + Geographic Data: Counties, Census Tracts, ZIP Code Areas, Congressional Districts, MSAs, Urban Areas County-Level Eployent by 3-Digit NAICS classification (Sources: BLS ES/202, County Business Patterns, suppleented with Minnesota IMPLAN Group, Inc. data) Satellite iagery / aerial photography of dock facilities
12 Data Repository Contents INTERMODAL Data Residing in Repository outside of MWFV Iport/Export Flows (GTIS), 1999+, by State, Custos Gateway Dock equipent, lock perforance data U.S. side only Establishents and eployent by 2-6 Digit NAICS classification aong counties, MSAs and individual Establishents in 10-State MVFC study region (Sources: Minnesota IMPLAN Group, Inc., Dun and Bradstreet/Harris InfoSearch) BEA gross doestic product by etropolitan area and by sector and by Year BEA regions in ESRI Shapefile forat
13 Data Repository Contents, Continued Data Residing in Repository outside of MWFV Air Freight Flow Network (by arket & onth) Air Freight Data (T ) MARAD international vessel oveents & USACE Vessel Entrances and Clearances USACE Waterborne Coerce Database Part III (Great Lakes) ESRI Traffic Volues
14 Looking Ahead: Updates, Additions, Iproveents Data Currently Being Added to Database: ORNL CTA North Aerican Rail Interlining Network Integrated Network Great Lakes Waterway, Highway, Rail linked to Coercial Docks, Locks (USACE) Updated US Highway Network Speed / Estiated Travel Ties Toll gates / weigh stations Add ESRI Traffic Counts to integrated highway network Add ATRI Travel Tie Data (by tie of day, day of week) Link highways to Rail Network through Interodal Sites Link BEA Regions/BEA GDP Data to Public Rail Waybill Data
15 Looking Ahead: Updates, Additions, Iproveents Data Currently Being Added to Database: Add T100 Air Flows between Airports (by onth, year) USACE Foreign Traffic Vessel Entrances and Clearances USACE Waterborne Coerce Data County-to-County Mileage and Ipedance Tables: Highway Rail Water Useful for Analytical Tools Accessibility, Location Analysis, etc. Updated County Business Patterns
16 Looking Ahead: Updates, Additions, Iproveents Data Currently Being Added to Database: Continue developent of integrated network: Highway Perforance Indicators Tie-Dependent Vehicle Routing on Highway Network Developent of New Data Viewer to Replace ArcView Strealined Data Viewer INTERMODAL User Friendly Query Functions Exaple: National County Coodity Flow Data Delivery Syste
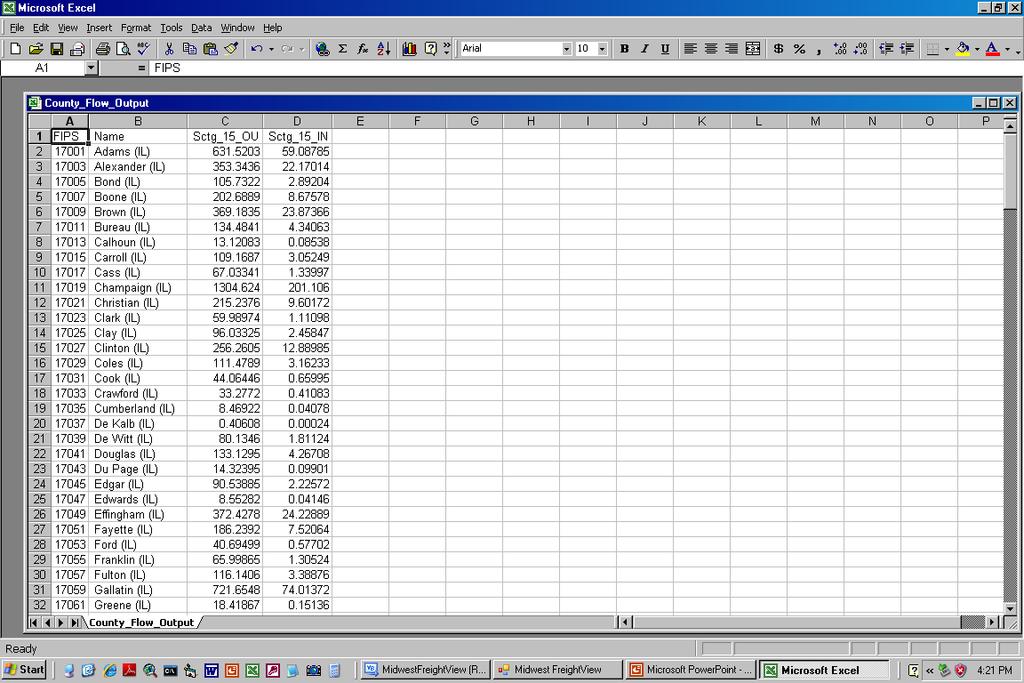
17 National County Coodity Flow Data Delivery Syste (UIC / UT Partnership) Contents of the database consist of 43 2-digit SCTG (Standard Classification of Transported Goods) Categories Data anaged in the following forats County-level inflow tonnage totals (kton)--all odes County-level outflow tonnage totals (kton) all odes County-level cobined inflow/outflow volues County -to-county OD flow tonnage (trucks only) Access to the site by perission only: User Ids, Passwords, issued by University of Illinois Chicago Research Tea
18 National County Coodity Flow Data Delivery Syste Query / Data Retrieval Functions Data retrieved by selections on pull-down enus Users select SCTG Codes, Inflows, Outflows, Counties Generate Data Tables for Inflows, Outflows, OD Flows Data tables in CSV forat for iport into Spreadsheets or database software


19 Access provided at Web Portal
20
21


22
23 Thank You