Instructor Info: Bruce Gladwin, PMP, 6σBB VP, Commercial Products Office:
|
|
|
- Jonah Nicholson
- 5 years ago
- Views:
Transcription

1 Instructor Info: Bruce Gladwin, PMP, 6σBB VP, Commercial Products Office:
2 Materials for this Session Value Stream Mapping vs. Process Simulation Discuss Case Model Transforming Value Stream Maps to Process Simulations General Methodology Specific steps for transforming Acme model How to transform each VSM icon to Process Simulator Analysis of Current-State Model (Methodology) High-level metrics Throughput, WIP, Cycle/Lead Time, Labor & Equipment Utilization Drill down metrics Activities, Resources (Labor), General Report VSM Constructs for Building Future State Model Supermarkets & Kanbans FIFO Lanes Pacemaker Processes Analysis of Future State Model 2 2

3 Learning to See Lean Enterprise Institute o Authors: Mike Rother, John Shook o To Purchase: 3 3
4 Learning to See: 1998 LEI, Inc., pp
5 Value Stream Map Static model that describes the states of current and/or future processes Tells what is happening in the process now and what the process could be later Reports on cycle/lead times, and value added time Requires general information regarding material arrivals, operation times, labor and equipment availability. e.g. average time = 15 sec Process Simulation Dynamic model that predicts the behavior of current and/or future processes Tells why a process behaves the way it does or how it could behave in the future Reports on throughput, inventory, cycle/lead times, VA and resource utilization Requires specific information about material arrivals, batch constraints, operation times, labor and equipment uptime & availability, transportation methods and times, and any other capacity constraints. e.g. Time = T(5,10,25) sec 5 5
6 Runtime view of Process Simulator model 6 6


7 Sign off authority Project Manager Purchaser stakeholdermap.com Project Management, project planning, templates and advice Processing project related invoices Enter invoice in PO System Is invoice element more than PO line? No Attach Pos to invoice and complete coding form File copy of paperwork Put all docs in finance pigeon hole. Invoice received by purchaser Yes Raise PO for difference. Give reasons. Pass invoice for authorisation No Is invoice valid? No Reject invoice Yes Accept invoice Is invoice above limit? Yes Is invoice valid? No Reject invoice Yes Accept invoice Stakeholdermap.com 7 7

8 Click this button to automatically convert your diagram to a simulation. 8 8
9 Learning to See: 1998 LEI, Inc., pp
10 Focus on Material Flow Information flow will take place through PCS constructs such as Storages, Send Routes, and Order Statements, or, in some cases, by using additional (dummy) activities and trigger entities to control the flow of materials. Convert non-functional icons (e.g. go see ) to Plain Graphics in Process Simulator Collect and enter the missing behavioral data from your Value Stream Map
11 Arrivals Make assumptions regarding material delivery times and starting quantities Entities Make assumptions regarding # Parts/Coil Inventory Buffers Make assumptions regarding maximum storage capacities Activities Leave times constant or make assumptions regarding op variability Resources Make assumptions regarding dedication to station Routings Make assumptions regarding movement methods and times 11 11

12 Process Activity 1 Customer Model these icons as Activities in PCS 12 12

13 Inventory FIFO FIFO Line Sequenced Pull Ball Model Inventory Signs, FIFO Lanes and Sequenced Pull Balls as Buffers in PCS 13 13

14 Supermarket Safety Stock Model Supermarkets and Safety Stock icons as Storages 14 14


15 Operator Shipment Forktruck Boat Model operator icons as Resources in PCS Model transport icons as Resources or Plain Graphics 15 15

16 Finished Goods Push Model material movement arrows as Routings 16 16
17 Pull Kanban Post Kanban Signal Production Kanban Withdrawl Kanban Go See Material Info Flow Electronic Info Flow Kanban Path Data Box Information Box Q OXOX 30 Secs 5 Days Kanban Burst Quality Problem Load Leveling Level Load Level Load Model these icons as Plain Graphics in PCS 17 17
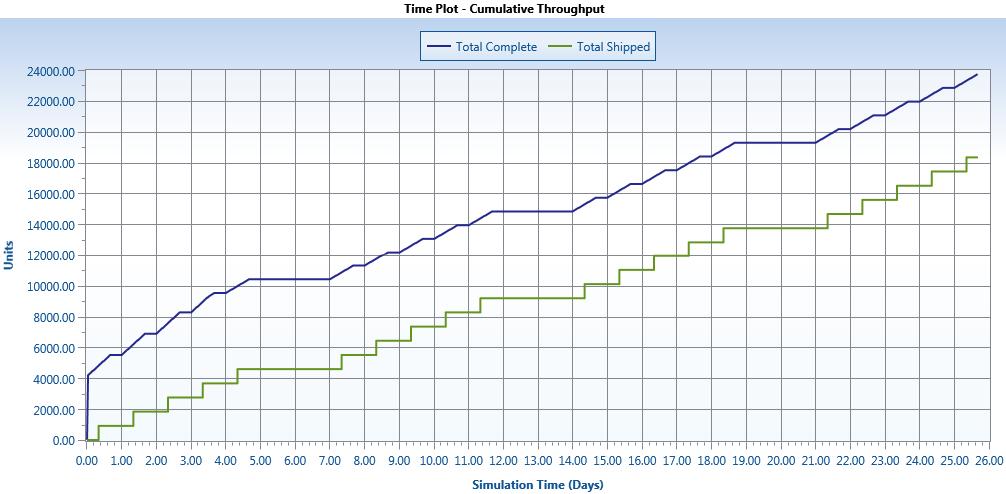
18 Begin with Systemic (high-level) Metrics Throughput (Can we meet the required rate?) Examine Cumulative and Periodic charts WIP (Is it stable? Are there trends up or down) Where is WIP building up? (In front of the turtles) Where is WIP being depleted? (In front of rabbits) Cycle/Lead Time Is it growing over time? (yes = systemic constraint) Note: it should not be a time-weighted calculation Resource Utilization Is there a balance across Labor and Equipment? 18 18
19 Drill down to other statistics as necessary Activities Single-capacity shows % setup, waiting, down, idle Multi-capacity shows % empty, full, partially full Resources (Labor) % in use, % down, % idle (do these make sense?) Off-shift time is not considered down time! General Report (other things to consider) Entity failed arrivals (due to insufficient capacity at the arrival activity/buffer/storage) Entity/Resource/Activity cost summary 19 19
20 20 20

21 Total WIP WIP 1 WIP 2 Shipping WIP 4 WIP
22 Note: Lead Times for initial inventory in the system are cut off in order to prevent skewing the average lead time calculation with partial times. First parts through entire process (starting as Coil material) leave the system at about 16.4 days. Here we see that average lead time of the parts is rising, indicating a systemic constraint or bottleneck

23 Very small Value Added time % Blocked = Waiting as semi-finished parts in WIP buffers % Waiting = Waiting as Finished Goods at Shipping/Staging 23 23
.")
24 These workstations are all maxed out, indicated by no idle time (dark blue). Significant imbalance among processing stations 24 24

25 % Empty time for these buffers signals upstream constraints Significant imbalance among inventory buffers 25 25
26 These resources are both maxed out, indicated by no idle time (dark blue). Significant imbalance among operators 26 26
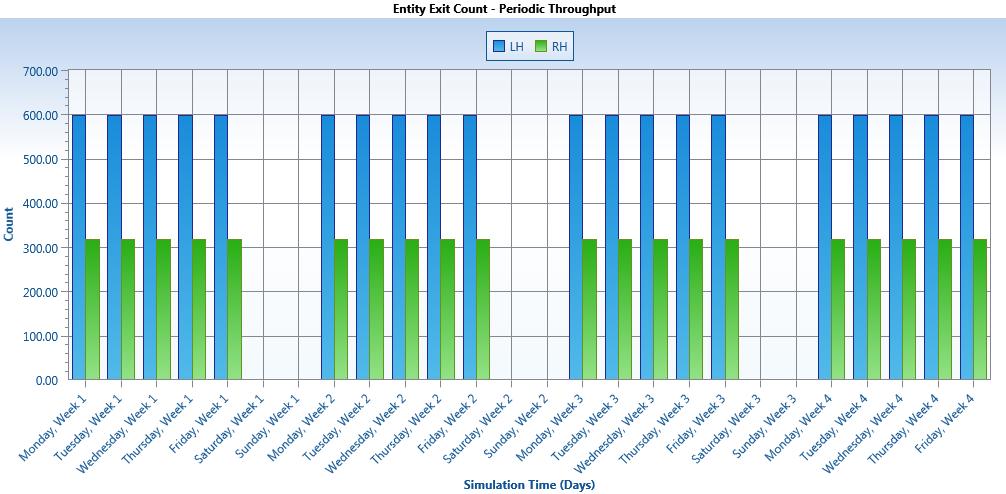
27 The Good Met required production rates for LH, RH parts across the simulation timeframe (4 weeks). The Bad Drawdown of Finished Goods inventory cannot be sustained indefinitely. Imbalance in both Labor and Equipment usage The Ugly Excessive inventory across entire process! 27 27
28 Learning to See: 1998 LEI, Inc., pp
29 Learning to See: 1998 LEI, Inc., p
30 Learning to See: 1998 LEI, Inc., p
31 Learning to See: 1998 LEI, Inc., p
32 Supermarket Pull System with Pacemaker Process and Downstream FIFO Lane Ordered Arrivals Send Route Pacemaker Process Buffer with Capacity = 10 & FIFO Rule Attach Route LH RH Buffer Upstream Process A Op A Pacemaker Process B Supermarket 0000 v_qty LH Op B 0000 v_qty RH FIFO FIFO Line 0000 Downstream Process C Op C 0000 Pack & Ship Order Op D (Exit) 0000 v_order Qty v_throughput v_total WIP Customer Orders arrive every 30 min: 10 to 20 LH (left hand brackets) + 5 to 10 RH (right hand brackets) Orders scheduled at Pacemaker Process Activity Logic: v_qty_lh = U(15,5) v_qty_lh = Round(v_Qty_LH) v_qty_rh = U(7.5,2.5) v_qty_rh = Round(v_Qty_RH) a_ord_qty = v_qty_lh + v_qty_rh Send v_qty_lh LH to Process_B Send v_qty_rh RH to Process_B Receive Customer Order Cust Order 32 32

33 Runtime view of Future-State Process Simulator model 33 33
34 Begin with Systemic (high-level) Metrics Throughput (Can we meet the required rate?) Examine Cumulative and Periodic charts WIP (Is it stable? Are there trends up or down) Where is WIP building up? (In front of the turtles) Where is WIP being depleted? (In front of rabbits) Cycle/Lead Time Is it growing over time? (yes = systemic constraint) Note: it should not be a time-weighted calculation Resource Utilization Is there a balance across Labor and Equipment? 34 34
35 Drill down to other statistics as necessary Activities Single-capacity shows % setup, waiting, down, idle Multi-capacity shows % empty, full, partially full Resources (Labor) % in use, % down, % idle (do these make sense?) Off-shift time is not considered down time! General Report (other things to consider) Entity failed arrivals (due to insufficient capacity at the arrival activity/buffer/storage) Entity/Resource/Activity cost summary 35 35
36 36 36

37 Total WIP 37 37
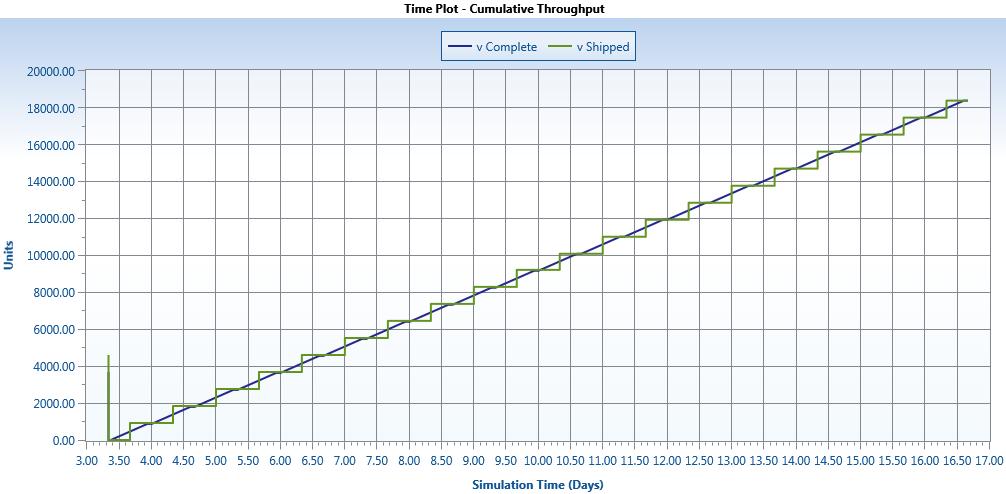
38 Lead Time leveling off at about 3.4 days 38 38
39 Not Very Different From Current State % Blocked = Waiting as semi-finished parts in WIP buffers % Waiting = Waiting as Finished Goods at Shipping 39 39


40 Stamping activities for this cell still a small part of stamping capacity. Weld and Assembly stations are full 90% of time

41 Labor is near full capacity 41 41
42 The Good Average Total WIP reduced from over 20,000 parts to about 3,000! Average Lead Time reduce from 20 days to 3.5 The Bad Still significant room for improvement. Cut inventory and cycle time by another 50% The Ugly None 42 42

43 Click this button to export all model data to Excel
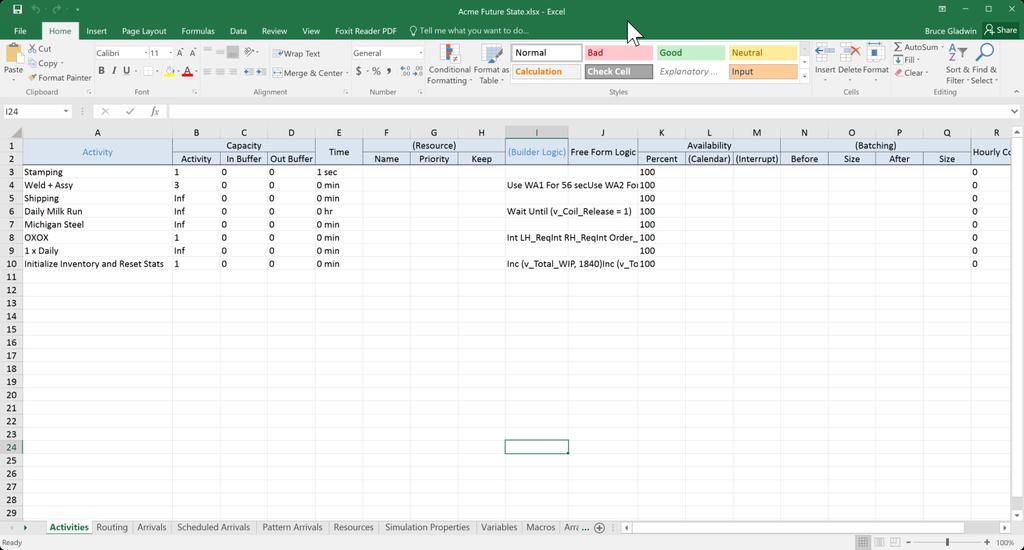
44 44 44
45 Value Stream Maps are an important tool for understanding and quantifying the opportunities for system improvement. Process Simulator can take an existing map as the starting point for a simulation model, but some work will be required to supply the missing behavioral data. In many cases it s easier to start over and develop a new model for dynamic analysis, rather than to modify an existing VSM
46 ? Instructor Info: Bruce Gladwin, PMP, 6σBB VP, Commercial Products Office:
47 47 47