Scenario Planning for the Future: Highlighting Connections to New Technologies
|
|
|
- Loreen Rice
- 5 years ago
- Views:
Transcription
1 Scenario Planning for the Future: Highlighting Connections to New Technologies Catherine C. McGhee, P.E. Associate Director of Safety, Operations, and Traffic Engineering Virginia Transportation Research Council Dr. Michael A. Mollenhauer Director, Center for Technology Implementation Virginia Tech Transportation Institute
2 LINKING EMERGING TECHNOLOGIES to LONG RANGE TRANSPORTATION PLANNING Both States and MPOs develop long-range transportation plans (LRTPs) MTPs guide decision-making and investments across all modes of surface transportation over a 20+ year horizon Scenario planning techniques are often used to inform LRTP development During this 20+ year horizon, emerging Connected and Autonomous Vehicle technology may revolutionize transportation, making it important that long range plans start including plans for the infrastructure, data, etc. that regions will need to support this driving force


 3")
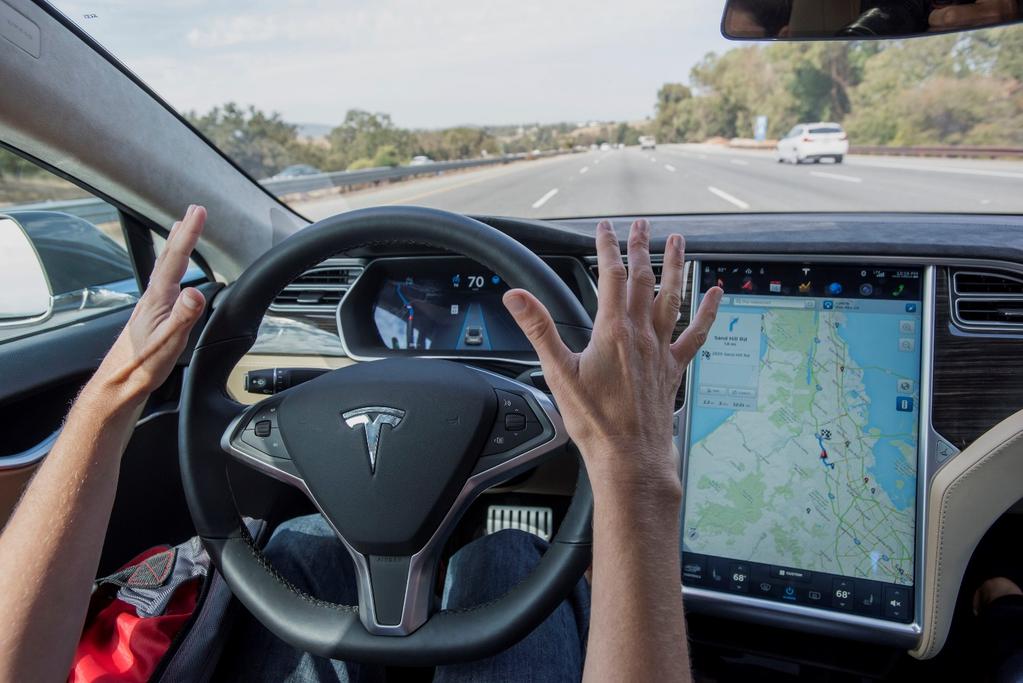
3 What is a Connected Car? V2V: Bi-directional information sharing between vehicles V2I: Bi-directional information sharing between a vehicle and the roadway V2X: Bi-directional information sharing between a vehicle and X (pedestrians, cyclists, trains, etc.) 3
4 Example V2V Safety Applications Emergency Electronic Brake Lights Forward Collision Warning Blind Spot / Lane Change Warning Left Turn Assist Intersection Movement Assist Do Not Pass Warning Etc., Etc. RV-1 RV-2 HV HV RV-2 RV-1 RV-1 RV-2 HV HV RV-2 RV-1


5 Example V2I Applications Queue Detection and Warning Red Light Violation Warning Merge Assistance Emergency Vehicle Preemption Transit Signal Priority Eco Traffic Signal Timing Dynamic Driver Messaging ATM Integration
 3G/4G Cellular: Nearly ubiquitous coverage Less reliable communications 1.5 3.")
6 Methods of Connecting Dedicated Short Range Communications (DSRC): WiFi for cars, very fast and reliable Good for localized imminent collision warning and time sensitive data.0002 s latency Relatively short range (300 meters) 3G/4G Cellular: Nearly ubiquitous coverage Less reliable communications s latency 5G Cellular (future): Still in draft technical specs but promising low latency, high reliability, high bandwidth Works from much of the existing cellular infrastructure Performance TBD Image Source:


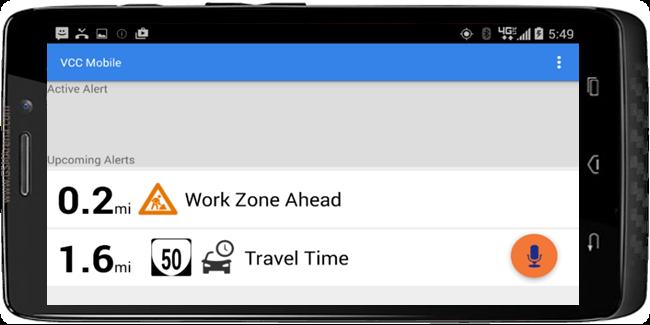
7 Early Implementation Example Audi PRIME traffic light feature Interface to centralized signal control system in several cities Counts down Red to Green phase change Uses cellular communications
8 Implications of Connected Vehicle Deployment Safety V2V alone may address up to 81% of crashes involving unimpaired drivers (27K fatalities, 1.8M injuries, 7.3M property damage) 2 V2I alone may address up to 19% of crashes involving unimpaired drivers 2 Mobility Improved traffic flow and reduce delays (27%) 1 Increased awareness of and access to multi-modal choices More direct, actionable information for drivers (re-routing, incidents, weather, etc.) Environmental Combined Eco-Signal apps may reduce CO2 and fuel consumption (11%) 1 Signal and freeway lane management combined reduce fuel consumption (22%) Estimated Benefits of Connected Vehicle Applications: Dynamic Mobility Applications, AERIS, V2I Safety, and Road Weather Management, lib/56000/56200/56238/fhwa-jpo pdf 2 Harding, J., Powell, G., R., Yoon, R., Fikentscher, J., Doyle, C., Sade, D., Lukuc, M., Simons, J., & Wang, J. (2014, August). Vehicle-to-vehicle communications: Readiness of V2V technology for application. (Report No. DOT HS ). Washington, DC: National Highway Traffic Safety Administration.
9 Other Potential CV Implications Exposure and access to multi-modal travel options Increased transit and facility demand More desire for non-motorized travel options (bikes, pedestrian paths, etc.) Dynamic routing increases capacity but more trips on secondary roads Parking apps can reduce hunting for parking and some urban congestion Potential to reduce or eliminate infrastructure Variable dynamic message, lane management, and traditional signage Traffic signals Increased needs for monitoring and contingency planning System outage or failures become more significant System security becomes critical

10 10 Reduce VHD


11 Virginia s CV Deployment Strategy WE ARE HERE UTC Program NOVA Testbed Smart Road Testbed Build, Develop, Test Operate and Maintain Applications Long Term Operations & Maintenance 11

12 VCC Open Cloud Environment VDOT Resources Northern VA Traffic Operations Center TOC Controllers Operating: Signal Phasing HOV Lanes Ramp Meters Changeable Signs Incident Management Maintenance Activity Etc. VDOT Data Sources Incident Reports Weather Events Work Zone Locations Dynamic Message Sign Content Limited Traffic Data System DB System APIs Message Queues Redis Cache Persistent Data Other National Deployments VCC Cloud Computing Environment US DOT Research Data Exchange Mission Control System Monitoring Asset Management Data Visualization Android Cell Phone Visual Display Audio Display Text to Speech Msgs Speech to Text Reports New VDOT Traffic Operations Support Applications TOC Support Applications: Queue Detection and Warning Weather Event Detection Probe-Enabled Monitoring Incident Detection and Mgmt Work Zone Safety Mgmt Etc. VTTI Data Center 3 rd Party App Provider RSE s OBE s
13

14 Cloud Data Portal Automation of Existing and Anticipated Sources 14
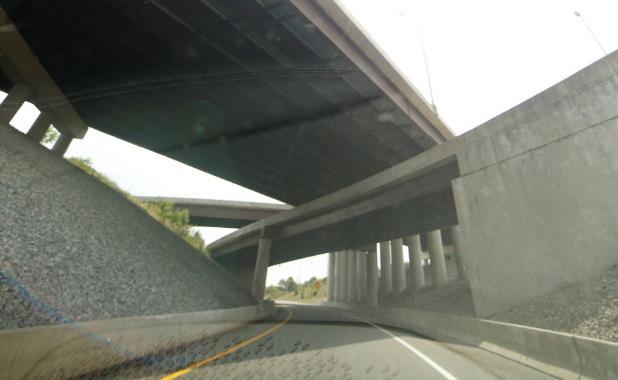
15 Reduce Traditional Infrastructure


16 Provide Connected and Automated Vehicle Roadway Infrastructure


17 Provide Connected Vehicle Pilot Application


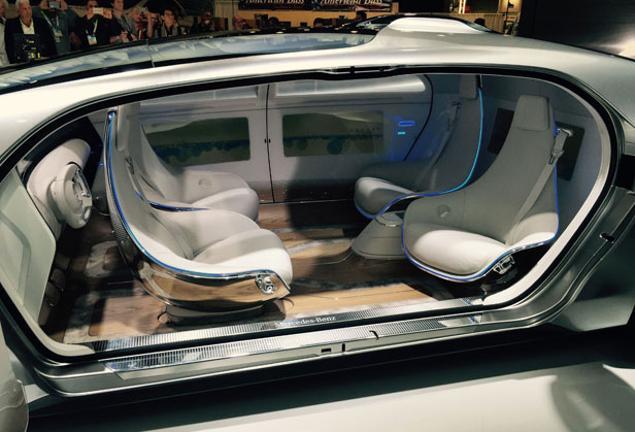
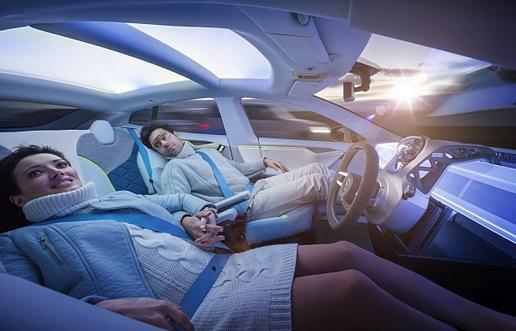
18 Public Perceptions of Automation

19 SAE Levels of Automation Copyright 2014 SAE International and J3016


20 Difficult AV Challenges
21 Approaches to AV Deployment Auto manufactures appear to favor an incremental, evolutionary approach Add features and capability while building confidence Advance and build upon connected concepts Allow for adaptation of drivers and public perception L2 vehicles are in production now, some L3 s announced for , L4 s Non-traditional auto makers (tech companies) favor a revolutionary approach Straight to level 4, some driving modes, likely geo-fenced, precision mapped, and conditional (good weather and lighting, etc.) Driver adaptation is less critical to success Will benefit from better infrastructure (roads, lines, connected signals, etc.) True level 5 (anywhere, anytime, any condition) will take time if ever
22 Implications of Automated Deployment Implications depend on type of automation and level of adoption Estimates of adoption and saturation rates vary significantly and saturation takes time Product positioning, fleet use, ownership models, luxury vs. masses, affordability User acceptance not a given, 65% of unexposed drivers are unwilling to relinquish control to an automated vehicle Perception of safety and security, high profile events Safety Implications Significant safety improvements are possible, particularly with increased saturation May eliminate most of driver error crashes (90%) Impaired, aggressive, inattentive, and generally risky driving are reduced or eliminated May introduce new risks System failures, cybersecurity risks, reduced seat belt use, mixed fleet interactions, more travel
23 More Implications of AV Deployment Impact on roadway capacity May initially be a dis-benefit Safe operating parameters or non-aggressive tuning for rider acceptance Mixed fleet driver expectation issues Expect deployments on freeway systems first Up to 2X increased capacity at high penetration levels due to shorter headways, narrower lanes, higher speeds, coordinated movement Simulation shows benefits not achieved until 50-75% of fleet is equipped and cooperating with non-linear increases as penetration nears 100% With acceptance and penetration, operating parameters can be sharpened to add more capacity Less non-recurring congestion due to crash reduction, reduced rubbernecking, efficient weave/zipper
24 More Implications of AV Deployment On travel demand Increases due to positive experience, ability to multi-task, access to nondrivers May significantly reduce regional air and rail travel Estimates of 5-20% increase in VMT with 50% market penetration, up to 35% increase with 95% penetration (particularly with L4/L5) Impact on transit May increase transit use by providing first/last mile access Improves efficiency and reliability when applied to transit vehicles May supplement or replace transit over time
25 More Implications of AV Deployment Enables robo-taxi and ride sharing fleets Highly desirable model for automakers (limits risk and manages expectations) Eliminates driver labor from the ride share economics Reduced parking requirements in activity centers Potential for many dead head runs bigger issue off hours and rural areas Who manages cleaning, vandalism, messes and will riders accept cameras as a management tool Effects on families/lives Reduced ownership (maybe a 1 car family instead of 3 cars), less expense Enables travel for non-drivers Live/work further away from activity centers Impact on public health - potentially reduces willingness to bike, walk, transit