Active Direction to Managing Transportation ATDM: Ohio s Perspective
|
|
|
- Adela Black
- 5 years ago
- Views:
Transcription


1 Active Direction to Managing Transportation ATDM: Ohio s Perspective John Gray, Associate Vice President AECOM Brenton, Bogard, P.E. Studies Engineer Ohio Department of Transportation Ohio Transportation Engineering Conference (OTEC) October 28, 2015
2 Presentation Agenda What is ATDM? Strategies Benefits Applications Methodology ODOT Context Next Steps Question and Answers Without a Plan With a Plan 2

3 Active Direction to Managing Transportation 3
4 DEFINITION: What is Managing Travel Demand? Managing travel demand is about providing travelers, regardless of whether they drive alone, with travel choices, such as work location, route, time of travel and mode. In the broadest sense, demand management is defined as providing travelers with effective choices to improve travel reliability. * * FHWA,
5 TRAVEL DEMAND STRATEGIES PROVIDE: Choices Mode Choice Location Choice - Drive alone - Telework - Car- and vanpool - Transit-oriented development - Shuttle buses - Location-efficient mortgages - Bike/walk - Proximate commute Time Choice Route Choice - Traveler info - Traveler info - Travel time prediction - Active Traffic Mgmt. - Event scheduling - HOV lanes - Flex-time - Congestion pricing 5
6 A range of reasonable alternatives (Potential ATDM Strategies) Hard Shoulder Running Contra Flow Lanes High Occupancy Vehicle Lanes Bus Only Lanes Priced Lanes TMC Improvements Incident Response Integrated Corridor Management Truck Only Lanes Speed Harmonization Dynamic Message Signs providing real-time traffic information Dynamic Route Planning Ramp Metering Dynamic Lane Assignment Queue Warning


7 Dynamically manage recurrent and non recurrent freeway congestion Maximize effectiveness / efficiency Increase throughput and safety Integrated systems with new technology Automated dynamic deployment Individual Lanes All Lanes Dedicated Shoulder Lanes Dedicated Shoulder Lanes Dynamic Shoulder Lanes Speed Harmonization All Traffic Queue Warning HOV Dynamic Shoulder Lanes Dynamic Re routing Priced Dynamic Shoulder Lanes Bottleneck Control 7
8 Application ATDM strategies can assist in: Expands capacity Shifts demand Meters traffic Outcome Restored travel speeds Improved safety Travel time reliability Long term Return on Investment


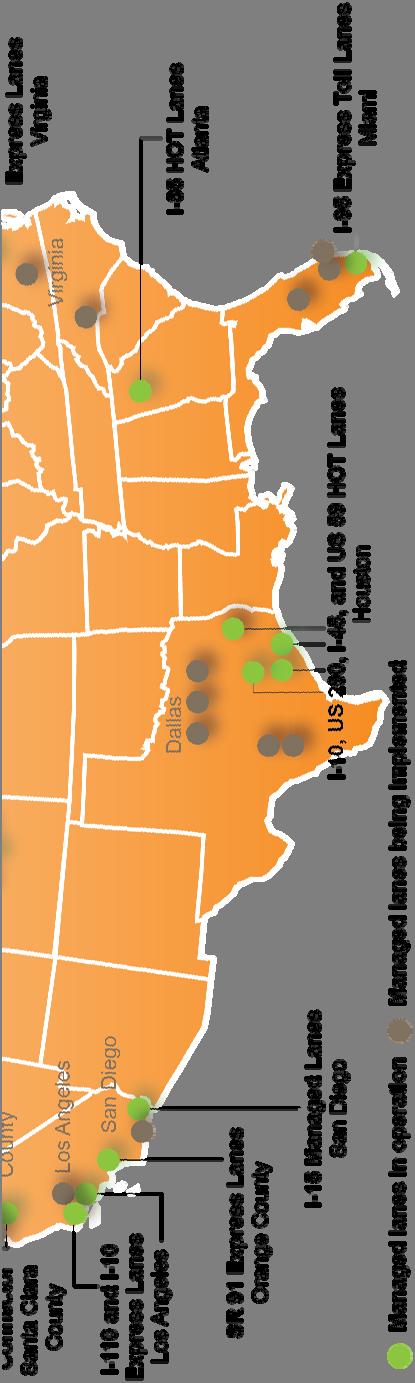
9 Managed Lanes Projects in the U.S. 9


10 User Benefits Time Savings Improved reliability Reduced delay More Choices Managed Lane Benefits System Benefits Greater throughput Increased transit & carpool use More modal options Improved air quality Revenue generation I-10 / Katy Freeway, Houston, TX SR-91, Orange County, CA 10
11 Managed Lane Benefits cont d Maximize Transportation Investments Maintain capacity performance of New Facilities Revenue Generation to offset Costs Seek Logical Financial Partners Seek and Leverage Grant Opportunities I-495,Express, Northern VA I-10/I-110 Express, Los Angeles, CA 11

 Outside shoulder used as a HSR Signs are placed strategically Shoulder lane is also paved with red pavement material")
12 Applications of ATDM I-35W (Minneapolis, MN) Inside shoulder was converted to a Priced Dynamic Shoulder Lane Utilizes variable speed limits MnDOT states that the facility is operating safely and more efficiently I-66 (between Merrifield, VA and Washington D.C.) Outside shoulder used as a HSR Signs are placed strategically Shoulder lane is also paved with red pavement material to distinguish double white lines were placed to indicate areas where merging and diverging is allowed 12

 13")
13 Applications cont d I-110/I-10 L.A. Metro Expresslanes Congestion Reduction Pilot Project Originally a I year demonstration project Conversion of the existing HOV to HOT Increased speeds in the general purpose lanes I-595 Reversible Expresslanes Opened March mile E.B./W.B. commute Utilizes a series of gate at entry Enhanced signage (digital and static) 13

14 ODOT s Study Need Evaluate the use of Active Traffic and Demand Management and Managed lanes Strategies Ohio's overall and major regional transportation networks MAP-21 requirements Streamlined solution-based methodologies Develop an implementation strategy, identifying potential projects for implementation 14
15 AO40 Vision Identified Six Goals The six goals were: 1. Preservation Promote cost-effective preservation of multimodal assets 2. Mobility and Efficiency Reduce congestion and increase travel reliability 3. Accessibility and Connectivity Increase customer access to Ohio s multimodal transportation system and improve linkages between modes 4. Safety Continue to improve transportation system safety 5. Stewardship Advance financial, environmental, and social objectives for transportation investments 6. Economic Development Develop and operate a state transportation system that supports a competitive and thriving economy, attracts new businesses, and provides for predictable freight movements 15

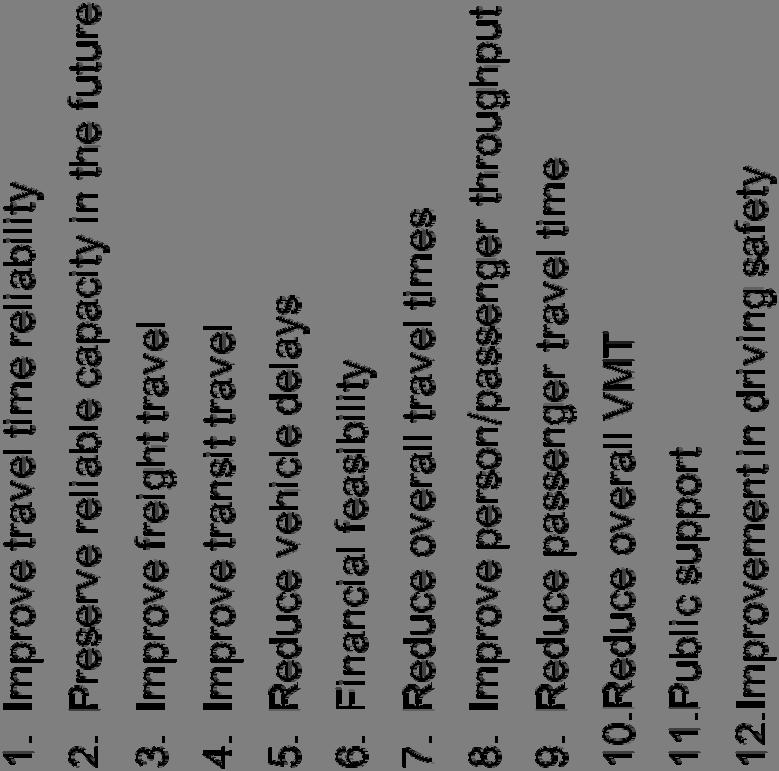
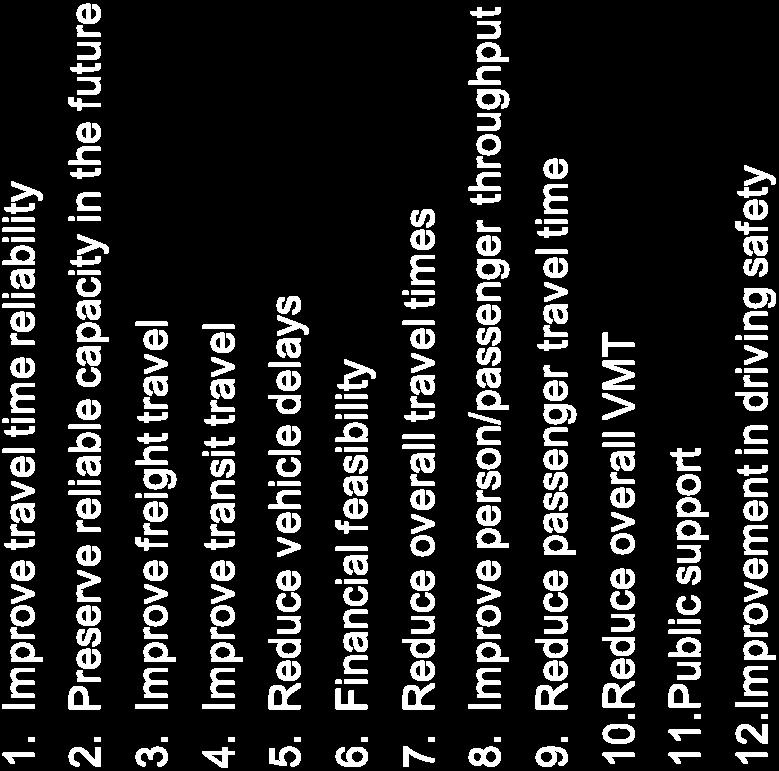
16 Project Goals 16

17 Methodology: Screening Process


18 Study Areas Cincinnati Dayton Columbus Toledo Akron-Canton Cleveland
19 Criteria Considered Resources Capacity addition and/or resurfacing From INRIX Bottleneck Report for Ohio Congestion and Safety Lists and Databases Travel Time Reliability Index from ODOT - Top 10 per region Inside or outside shoulder width Time savings to be worth the change in behavior or cost Commuting trips are longer rather than shorter Relatively high percentage of through trips TIMS Right-of-way, Volumes, Speed, etc. Public support appears likely Ratio of travel time in peak period/travel time in free-flow Existing/Under Constr/Planned Managed Lanes/HOT Lanes Source ODOT TRAC/Transportation Plan ODOT ODOT ODOT ODOT Basic Road Inventory Modeling Modeling Modeling ODOT Surveys, Reports, Prior Project Public Meetings, News Papers, 2012 TTI Mobility Report by region FHWA
20 Screening Elements for Ohio Managed Lanes Primary Travel speeds in the general purpose lanes are unacceptable to motorists, due to congestion Potential time savings is perceived to be worth the change in behavior or the cost Commuting trips are longer rather shorter Relatively high percentage of through trips New capacity being provided Right-of-way Available Public support appears likely
21 Modeling Tool ODOT Statewide Model Modeling Process Calibration Focus on corridors of interest Review and update Number of Lanes, Capacity/Weave, and Free Flow Speeds Calibrated to 2010 Speed Data by Direction and Time Period 2010 and 2040 No Build Network and Trip Tables Highway assignments for AM, MD, PM and EV
22 Performance Measures Mobility measures to evaluate base and horizon year conditions. Reliability Vehicle Hours of Delay Peak Speed Vehicle Hours Travelled Vehicle Miles Travelled Vehicle/Person Throughput Average Trip Length Time in minutes for a 15 mile trip Standard Deviation (minutes) y = x x R² = Average Speed (mph) std Poly. (std) Average Speed (mph) Buffer Time Avg Time 95th Percentile Time
23 Secondary Screening Fatal Flaws - HOVs Qualitatively Quantitative Direct Impact/High Benefit Ancillary or Indirect Impact/Moderate Benefit No Impact/Low Benefit Yes or No Quantitative Corridor Congestion Considered Mixed Use HSR Requires Dynamic Lane: Assignment and Speed Harmonization Triggers Choice Lanes


24 Tertiary Screening Benefit/Cost Analysis: Monetization Local Government Support Public Support
25 Economic Analysis Overview Quantitative Preliminary Benefit Cost Ratio (BCR) Preliminary screening process using traditional benefits Travel time savings (truck/auto) Travel time reliability (truck/auto) Emissions (reduced truck/auto VMT) Travel cost savings (reduced truck/auto VMT) Safety (reduced truck/auto VMT; crash reduction/increase with ATDM) Make sure the strategies have BCR above 1.0 Qualitative Rating Potential for Wider Economic Benefits Productivity/agglomeration Economic competitiveness Investments avoided/delayed Overall Ranking
26 Regional Improvements Traffic Management Center Improvements Incident Response Integrated Corridor Management Dynamic Route Planning


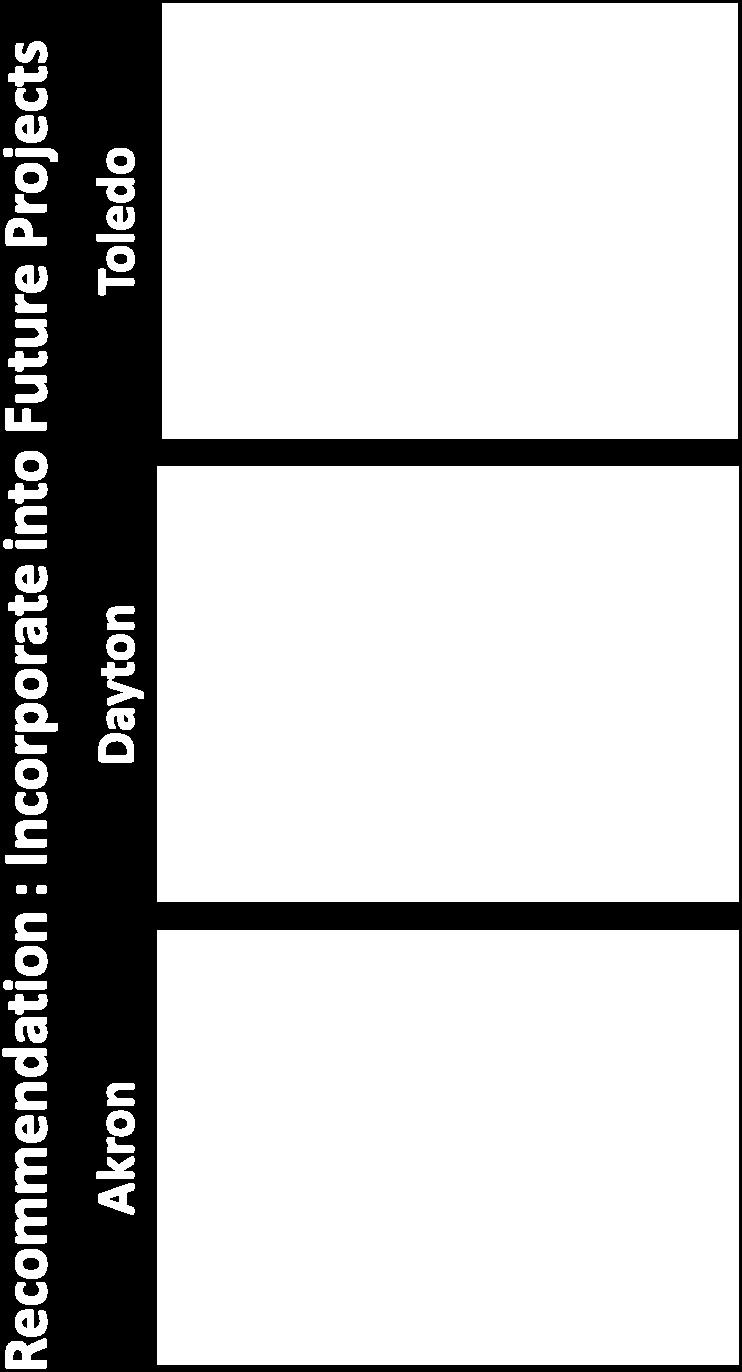
27 Screening Recommendations for ATDM Strategies in Ohio

28

29 Hard Shoulder Running
")
 ANNUAL")
30 Mobility Benefits (2040) Peak Reliability Travel Time Savings: 5.6 to 6 minutes Decreased Peak Vehicle Hours of Delay: 30% to 39% (1,220 to 1,700 Vehicle Hours) 22,410 Vehicle Hours Annual Vehicle Hours of Delay Reduction: 18,510 Increased Peak Vehicle Miles Travelled: 5% to 6% Decreased Peak Vehicle Hours Travelled: 14% to 16% (less time wasted) ANNUAL RELIABILITY SAVINGS PEAK SPEED IMPROVEMENT

31

32 Hard Shoulder Running
 3,960 Vehicle Hours Annual Vehicle Hours of Delay Reduction: 3,870 Increased Peak Vehicle Miles")
33 Mobility Benefits (2040) Peak Reliability Travel Time Savings: 0.6 to 1.8 minutes Decreased Peak Vehicle Hours of Delay: 42% to 56% (210 to 350 Vehicle Hours) 3,960 Vehicle Hours Annual Vehicle Hours of Delay Reduction: 3,870 Increased Peak Vehicle Miles Travelled: 1% to 6% Decreased Peak Vehicle Hours Travelled: 10% to 12% ANNUAL RELIABILITY SAVINGS PEAK SPEED IMPROVEMENT

34

35 Hard Shoulder Running
36 Mobility Benefits (2040) Peak Reliability Travel Time Savings: 5.1 to 5.7 minutes Decreased Peak Vehicle Hours of Delay: 33% to 45% (180 to 260 Vehicle Hours) 17,900 Vehicle Hours Annual Vehicle Hours of Delay Reduction: 3,240 Increased Peak Vehicle Miles Travelled: 8% to 13% Decreased Peak Vehicle Hours Travelled: 1% to 9% ANNUAL RELIABILITY SAVINGS PEAK SPEED IMPROVEMENT

37 DYNAMIC RAMP METERING

 All")

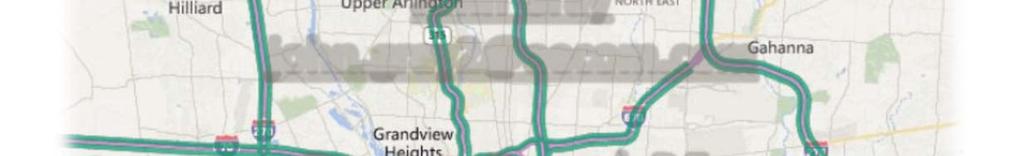
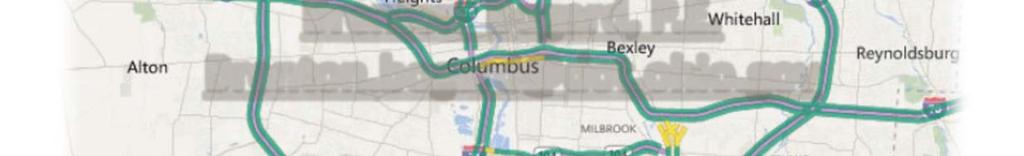
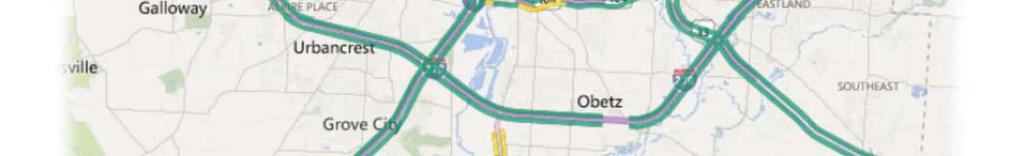
38 Recommendations Hard Shoulder Running Cincinnati I 275 Cleveland I 271 Columbus I 670 I 70 I 71 Dynamic Ramp Metering (incorporate with planned improvements) All Cities Bus on Shoulder Likely viable when other criteria is used Existing or planned transit service
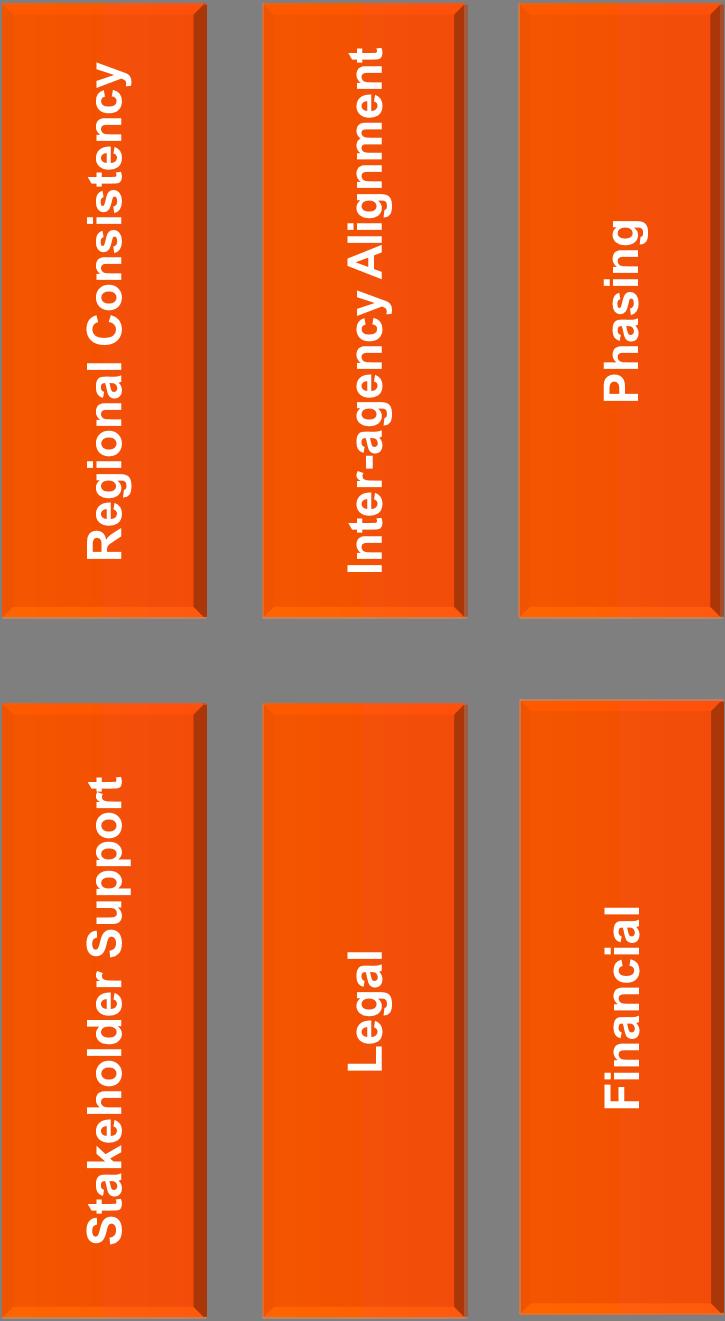
39 Policy Considerations
40


41 Concept for ATDM System System Architecture System Elements Operational Policies Operations Staff Training Performance Measures

42 Concept for ATDM System Normal Conditions Bottlenecks/Congestion Minor/Major Accidents Work Zones Weather Events Enforcement Failure Conditions
43 ATDM System Needs Hard Shoulder Running Lane control signals (color) Decision support system software Overhead gantries spaced at ½ mile (continuous viewing) Supplementary incident status and delay messages (DMS) Static vehicle eligibility signs Vehicle detection (all lanes including shoulders) CCTV camera surveillance (full coverage) ATMS software compatible with required TMC functions
44 ATDM System Needs Speed Harmonization Variable speed limit signs (color) Decision support system software (automatic based on ops. rules) Overhead gantries spaced at ½ mile (continuous viewing) Supplementary incident status and delay messages (DMS) Vehicle detection (all lanes) CCTV camera surveillance (full coverage) ATMS software compatible with required TMC functions Speed changes in 5 mph increments (< 15 mph in single interval) Speed range: 5 mph to 30 mph less than speed limit
45 ATDM System Needs Dynamic Ramp Metering Ramp metering field hardware Communications Dynamic ramp metering software/firmware Vehicle detection (all lanes plus on ramps and queue detectors) Static signs with regulatory information CCTV camera surveillance (covering ramp queue) ATMS software compatible with required TMC functions

46 Concept of Operations- Next Steps TMC Operations Review Operations Workshops System Requirements O&M Staffing Requirements Public Education & Outreach ConOps

 Operational")
47 Develop Concept of Operations HOW: will the system operate (TMC requirements), WHO: will operate and maintain the system, WHAT: elements will the system incorporate, WHEN: will the system operate, and WHERE: will the system be in operation Operational policies and constraints ITS Systems Functionalities TMC Operations Performance Measures and Monitoring (Travel Time Reliability, Optimizing Person Throughput) Operational Scenarios Enforcement
48 I-670 Strategy Concept-Visualization


49 Teaming Partners.