Hill Country Alliance Presentation
|
|
|
- Rodger Perkins
- 5 years ago
- Views:
Transcription


1 Hill Country Alliance Presentation September 24, 2015
2 Lone Star Regional Rail Strategic Considerations Lone Star Rail District Connectivity/Mobility Issues 1
3 Lone Star Regional Rail Strategic Considerations Lone Star Rail District 2


4 Lone Star Rail District (LSRD) Independent entity authorized by State of Texas Created by cities of Austin & San Antonio and counties of Bexar & Travis in 2003 San Antonio area has 7 of the 23 seats on the District s Board of Directors Mission: Establish regular passenger rail service between Austin and San Antonio 3


5 LSRD Board of Directors Region s Board Representation: 23 members representing the political leadership and business community of Central/South Texas, plus at large members appointed by the TxTC. o Cities: Georgetown, Austin, San Marcos, New Braunfels, Schertz, San Antonio o Counties: Williamson, Travis, Bastrop, Hays, Caldwell, Bexar o Transit Agencies: Capital Metro, CARTS, VIA, ART o MPOs: CAMPO, AA MPO o Community College Districts: ACCD 4


6 Connectivity/Mobility LSTAR Line Local freight & passenger service Originally 16 stations at full service (up to 24 with split stations service) 32 round trips a day at full service 118 miles of passenger rail; San Antonio north to Georgetown East Line - Freight Rail Line 30+ through freight trains per day rerouted to Freight Rail Line 80+ miles of new freight rail line from Seguin to Taylor 40+ miles of improved freight rail line from San Antonio to Seguin 5


7 Connectivity/Mobility - Finding the Right Fit LSTAR Passenger Rail High Speed Rail Regional Rail Distance Speed Commuter Rail Light Rail Bus Rapid Transit Streetcar Local Bus # of Stops - Proximity to Origin and Destination 6
 Kyle (1) San Marcos (2) New Braunfels (1) Schertz (1) San Antonio Stations")
8 LSTAR Potential Stations Georgetown (1) Round Rock (TBD, 1-2) Austin (7) Buda (1) Kyle (1) San Marcos (2) New Braunfels (1) Schertz (1) San Antonio Stations (7) 7
 o Passenger trains are shorter & faster (max. 8 cars; avg. 60 mph) o Moves through freight trains to East Line (approx.")
9 Lone Star Regional Rail East Line for Through Freight Regional Mobility/Access Relocation of UP reduces freight rail traffic in city centers o Through freight trains are longer & slower (1-2 miles long; avg. 20 mph or less) o Passenger trains are shorter & faster (max. 8 cars; avg. 60 mph) o Moves through freight trains to East Line (approx trains/day) o Remaining local freight stays in the corridor (no loss of service) 8
10 Lone Star Regional Rail Strategic Considerations Connectivity/Mobility Issues 9

11 Connectivity/Mobility 10 Over 90% of trips are by auto 10
 and approximately 9,000 at ACC s")

12 Connectivity/Mobility 2009: nearly 30% of all jobs in the Austin region were located in 78701, 78703, 78704, ,000 students at UT (80% live off campus) and approximately 9,000 at ACC s Rio Grande campus downtown 2000: nearly 18% of all jobs in Austin Region were located in Austin s downtown 4 th highest % in the nation 20% 18% 16% 14% 12% 10% CBD Share of Total Urban Area Employment


13 Connectivity/Mobility CAMPO Daily Work Trips Trips Percent Hays County To Travis Co. 28,880 45% US 290 US 183 US 183 Travis County In County 456,627 92% Williamson County To Travis Co. 89,703 48% Bastrop County To Travis Co. 15,872 55% Caldwell To Travis Co. 4,506 34% Travis Co. LOOP 1 SH 130 US 290 SH 71 Total Trips 791,504 Travis Co. Trips 595,588 75%

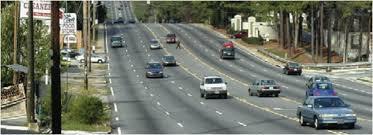
14 Connectivity/Mobility Highway expansion capability is limited Right of way established in s Alamo Area MPO anticipates adding one million in population o Traffic model - avg. daily transportation system capacity overwhelmed between 2020 and 2040 Capital Area MPO data additional southern lanes needed by

15 Connectivity/Mobility Austin 1962


16 Connectivity/Mobility Leander Cedar Park Georgetown Round Rock Pflugerville Hutto Taylor Manor Elgin Austin Bee Caves Lakeway Bastrop Lockhart 2011 Buda Kyle San Marcos Central Texas is a high growth region with an initial ring of suburban cities around the core supported by existing transportation system.


17 Connectivity/Mobility Limited capacity in IH 35 corridor o IH 35 demand above capacity during morning and evening peaks o Peak periods forecast to lengthen 16
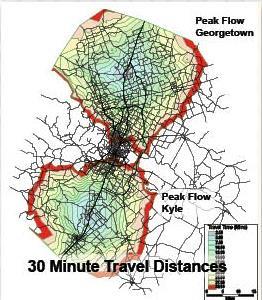
18 Connectivity/Mobility What We ve Learned from Other Cities Community Tipping Point 30 minute trip 2 million regional population Congestion builds, mobility is limited Personal Choices Find alternative route (Cut-through traffic) Relocate residents/businesses (Closer to CBD or affordable area) Relocate to avoid key destinations (new or expanding centers or move out of region) Choose another mode of (pedestrian, bikes, transportation improved commuter transit) 17

19 Connectivity/Mobility Highway System Funnels Peak Pass-Through and Commuter Traffic Together Through Rings of Congestion Leander Cedar Park Georgetown Round Rock Pflugerville Hutto Taylor Regional growth increases pressure for mobility throughout region Mano r Elgin Bastrop Lockhart Buda Kyle San Marcos Bee Caves Lakeway Mature roadway portions of the system meter access to regional economic destinations
20 Georgetown Leander Manor $ $ Bastrop Travel Time (Mins) San Marcos Lockhart Free Flow Speeds Miles Congested Speeds
21 20


22 Connectivity/Mobility Austin is fastest growing large city in US o Region s growth exceeds 110 people per day Commute time to increase o Round Rock to Central Austin 3 hours o San Marcos to Central Austin TBD 21
23 Connectivity/Mobility Current Transportation Issues TTI Mobility Investment Priorities Project Long-Term Central Texas IH 35 Improvement Scenarios (Aug. 2013) o IH 35 initiatives are short- and mid-term improvements o 2035 CAMPO - no large-scale improvements o Congestion is high, increasing faster than similar US areas Findings Austin & San Antonio in 15 most congested o IH 35 congestion will be severe even if substantial capacity is added o Long-term solution cannot be capacity-addition alone Central Texas cannot build its way out of congestion Need everything including the kitchen sink Operating system improvements New development patterns Travel behavior change 22
 John W. Hargis Hall Oakwood Cemetery Univ. Med. Center Brackenridge Austin Police Headquarters & Municipal Courts Palm Park Historic East Austin")
24 Connectivity/Mobility Austin Public Impacts Mount Calvary Cemetery University of Texas o o o o o Athletic Practice Facilities Mike Myers Stadium Disch-Falk Field Frank Erwin Center & Medical District (Dell Medical School) John W. Hargis Hall Oakwood Cemetery Univ. Med. Center Brackenridge Austin Police Headquarters & Municipal Courts Palm Park Historic East Austin

25 Connectivity/Mobility Kyle Parkway overview Central Texas lacks highway expansion capacity o Right of way established in s o CAMPO data additional lanes needed by 2035 o TxDOT funding is limited 24
26 Connectivity/Mobility Trends and Impact Growth Trends National shifting to information & service economy Convenient walkable mixed-use city centers/destinations Quality of life or experience focus Communities seeking to diversify housing/life style options Flattened national demand for new autos o Auto costs projected to increase for fuel & technology improvements Employers stressing work at office for collaborative relationships Location is still key migration to more affordable second tier urban areas o Austin is #1 and San Antonio #3 destinations o San Marcos fastest growing city in 2010 census Impacts - rents rising, home sales spiking and traffic congestion increasing 25
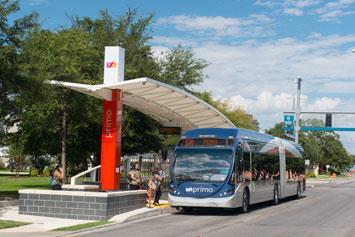
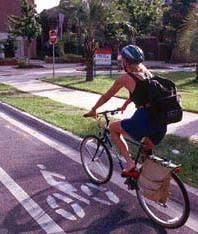

27 Connectivity/Mobility Multiple Modes and Strategies 26
28 Connectivity/Mobility - LSTAR Regional Rail Benefits Economic Development Induces new station area development /redevelopment Can attract diverse types of high value development (TOD or TAD) Focuses development within/near activity destinations for walkable neighborhoods Quality of Life Emphasis Links regional employment centers & anchors investment/property values Helps retain competitive advantage within region and nationally Community Development Part of a broad vision for community & aligns with community plans/goals Reinforces community identity/brand as connected to region Reduces growth in traffic congestion Works well in an integrated bus/rail transit system Relocates most freight trains Safety and aids in air quality attainment 27 27


29