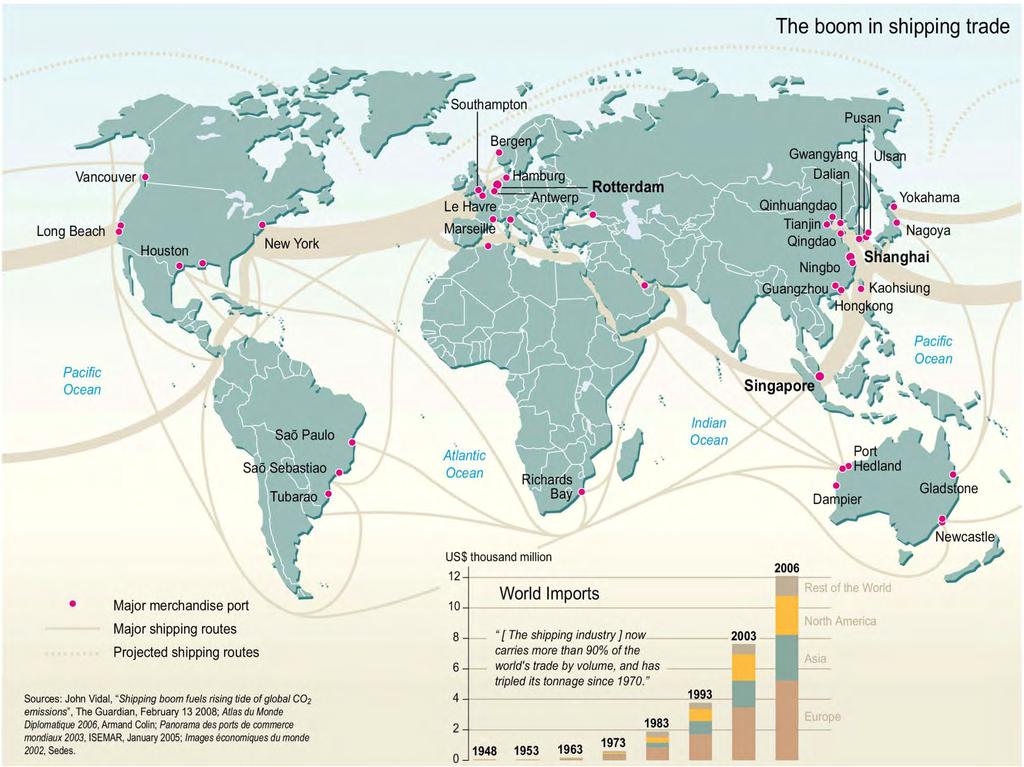
Changing Geography of Markets
|
|
|
- Berniece King
- 5 years ago
- Views:
Transcription
1 Changing Geography of Markets

2 Warning
3 Outline Changing Directions and Volumes of Freight Flows Biofuels and Domestic Energy Industry Supply Chain Trends Auto Industry example Panama Canal Expansion Globalization Challenges for Louisiana

4 Domestic Oil and Gas Production


5 The world will continue to consume fuel

6 Energy and Transportation US No 2 Diesel ($ gallon) Mar-1994 Nov-1994 Jul-1995 Mar-1996 Nov-1996 Jul-1997 Mar-1998 Nov-1998 Jul-1999 Mar-2000 Nov-2000 Jul-2001 Mar-2002 Nov-2002 Jul-2003 Mar-2004 Nov-2004 Jul-2005 Mar-2006 Nov-2006 Jul-2007 Mar-2008 Nov-2008 Jul-2009 Mar-2010 Nov-2010 Jul-2011 Mar-2012

7 Price of Fuel and Distribution $200/ barrel


8 Current Production and Distribution Ethanol Petroleum Source: National Commission on Energy Policy. Biofuels Infrastructure Task Force. 2008

9 State and Local Incentives Production Incentives Distribution Incentives Clean Fleet Filling Station Locations

10 U.S. Biofuels Are Not Projected to Reach 36 Billion by 2022 Cellulosic Challenges? Source: Annual Energy Outlook, 2010
11 Rural Development Issues Equipment not necessarily compatible Transportation Costs may limit effective range (yields per acre, sources, etc.) Economic Incentives may work were existing infrastructure can source feedstocks Size and density of plants Road deficiencies
12 Industry Supply Chain Trends
 11,000 ton-miles (driving")
13 Everyone wants stuff!!! Annually Everyone - consumes 50 tons of stuff (2 Trucks) 11,000 ton-miles (driving between LA and Charleston 5 times!) 9% of US GDP spent on logistics

14 What the World Eats, Time Magazine The Revis family-north Carolina Food expenditure for one week: $341.98

15 There are many considerations to balancing a Supply Chain Safe Secure Environmental Responsible Efficient/Reliable Cost effectiveness Accessible to various modes and facilities

16 UPS helping tell people important
17 Wholesaling/Distribution Centers Employment Density by County
18 Manufacturing Centers Employment Density by County

19 Source: Wilbur Smith Associates, 2010
20 Near Shoring Supply Chain Costs Quality of workmanship Intellectual property controls

21 Example Structural Change in One Industry


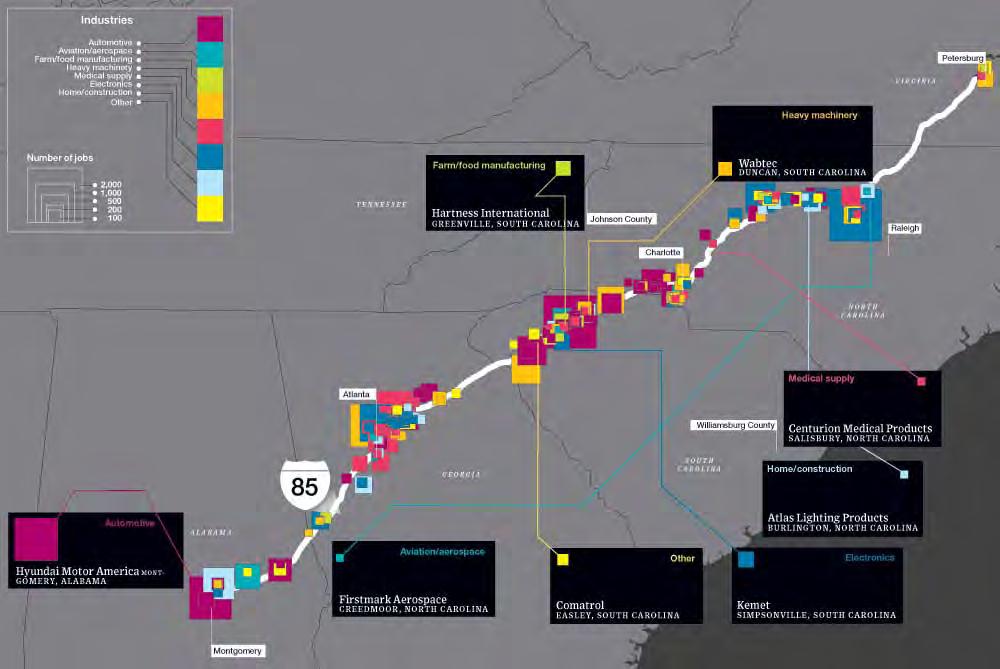
22 The Rise of Foreign Domestics Lead to the Southern Auto Corridor 12 U.S. Total Car Sales (Nominal U.S. Dollars) The Big Three vs. Foreign Domestics U.S. Car Production 10 6,000,000 Import Dom estic Sales in Millions The Big Three Foreign Domestics Units Produced in Millions 5,000,000 4,000,000 3,000,000 2,000,000 Source: Ward's Automotive Yearbook (Southfield, MI: Annual Issues). Year 1,000, Source: Ward's Automotive Yearbook Year (Southf ield, MI: 2009) U.S. Owned Suppliers 66% 35% F-D Suppliers 15% 32% Imported Parts 19% 33% Source: DesRoisers

23 Geographic Characteristics Multistate Corridor I-65/I-75 Northern Tier U.S. Southern Tier Foreign Integration with NAFTA Flows

24 Southern Auto Corridor OEMs, Tier 1 Suppliers, and States Coded by Supplier Establishments Share of U.S. Auto Industry 2008 Production 26% Vehicle GDP 27% Parts Suppliers 24% Over 1,500 Establishments with 200,000+ employees Employment 26% Sales of New Vehicles 23% Source: ELM International

25 Mercedes-Benz Tier One Suppliers - Shortest Highway Routes


26 Modal Usage 80-90% of parts arrive by truck and 70-80% vehicles leave by rail (Vanuono 2004)
27 Changing Supplier/Automaker Relationship Multi-tiered system OEM, Tier 1, Tier 2, Tier 3 Independent suppliers more integrated in production than in past Suppliers Taking on More Responsibilities: Suppliers Handling Logistics: Going Green: Greater Use of 3PLs:

28 Auto Supplier Location Criteria Nissan and its US Based Tier One Suppliers Most Suppliers within One Day Drive
29 Auto Supplier Location Criteria One day delivery drive time to a final assembly plant Ideally two final assembly plants located within the one day drive Access to four-lane divided highway/interstate or two-lane highways with limited access and few stoplights Two route options for inbound and outbound material Access to rail (not a requirement for all suppliers) Workforce density times the number of projected employees Educational assets workforce training programs Sources: (Canup, 2006; Canup, 2007; Goldsmith, n.d.; Klier and Rubenstein, 2008; Murrary, Dowell, and Mayes, n.d.)
30

31 Logistics Parks and Economic Development What type of facility? Trackage and Terminals Develop densities Need partners
32 Panama Canal Expansion

33 What Questions Should be Asked Is it needed? Does it fundamentally change North American flows? Can (will) I get a piece of the pie?

34 Why Expand the Canal? Overall strong growth over past few years Seem as critical, but obsolete, bottleneck Coastal Competition West Coast Uncertainties Vessel Economics

35 Is it Needed?


36 Panama Canal Expansion Projects
37
38 Transits and Tolls Through the Panama Canal, FY 2007 and FY 2008 Market Segment Transits Tolls (Thousands) TEUs (Thousands) Long tons (Thousands) Container 3,544 3, , ,947 12,335 12,641 60,220 56,889 Dry Bulk 2,420 2, , , ,166 81,429 Refrigerated 2,166 2,188 65,996 56, ,988 5,830 Tankers 2,066 1, , , ,673 40,020 General Cargo ,272 26, ,115 7,541 Vehicle Carriers , , ,892 2,864 Passengers ,070 26, Others 1,127 1,190 55,669 57, ,658 13,641 Total 13,147 13,233 1,316,042 1,182,527 12,555 12, , ,217
39 Country Flows through the Canal, 2008 (long tons) Country Origin Destination Inter- coastal Total Total exc. Intercoastal United States 73,219,464 62,190,326 1,803, ,409, ,606,037 People's Republic of China 28,192,062 15,572, ,764,223 43,764,223 Chile 13,010,080 13,728, ,738,808 26,738,808 Japan 5,884,876 18,811, ,696,380 24,696,380 South Korea 8,017,982 9,292, ,310,895 17,310,895 Peru 7,118,715 6,972, ,091,191 14,091,191 Colombia 9,381,569 4,229,563 58,942 13,611,132 13,552,190 Ecuador 6,788,875 6,747, ,535,878 13,535,878 Panama 3,123,754 9,862, ,102 12,985,790 12,821,688 Mexico 5,469,701 6,478, ,588 11,947,755 11,830,167 Canada 7,140,047 2,734, ,874,673 9,874,673
40 Growth of container traffic through the Panama Canal ( Est.) Transits Transits (1,644-3,485) TEU Capacity (4.1M-12.6M) Million of TEUs FY98 FY99 FY00 FY01 FY02 FY03 FY04 FY05 FY06 FY07 FY08 FY09 (Est) 0 Based on the capacity of transiting vessels Source: ComPair Data - April 2009.
41 340 Projections of Vessel Tonnage (FY2009 FY2014) Millions of PC/UMS tons History PB Jun 08 Master Plan MP July 09 OPT July 09 PES July

42 Changing Hinterlands? Faster Transit Economies of Scale Anything else? Bulk Exports Container availability

43 A Muddled Future North American Logistics Tolls versus Rail Rates Other Gateways (Canada, California, Suez Canal) Eastern Railroad developments Expectations Everyone is focusing on their part What if nothing happens? Shippers Near-Sourcing Changing Shipment Strategies Intermodal Connectivity FDI and Market Shifts Pace of US Recovery Policy Dredging US Chinese Trade Tensions Security and Regulatory Oversight Economy Carriers Ship Rotations Order Books Transshipment hubs in region
44
45 Panama Canal Expansion Answered? Is it needed? YES Does it fundamentally change North American flows? Bulks Yes - more volume Containers Yes, Some growth Ports Opportunities for Ports Transshipment Opportunities Yes and No Managing Expectations
46 Globalization and Louisiana
47 Foreign Direct Investment- Thousand Jobs (2010) Transportation needs vary Like to locate near neighbors Tend to use more import sourcing
48 LATIN AMERICA AND THE CARIBBEAN: SHARE OF SELECTED PARTNERS IN TOTAL TRADE, A. (PERCENTAGES) EXPORTS IMPORTS Source: Economic Commission for Latin America and the Caribbean (ECLAC), on the basis of information from the United Nations COMTRADE Database and nationalsources. A/ Projections from 2011 to 2020 are based on GDP growth rates for the years in Asia-Pacific, China, the European Union, Latin America and the Caribbean, the United States and the rest of the world. The growth rate of trade is expected to converge with the economies long-term growth rate. 48 Ricardo J Sanchez CEPAL Naciones Unidas Ricardo.Sanchez@ECLAC.org

49 Louisiana Shipments by Origin, Trade by Mode, By Value ($55.1 Billion)
50 Louisiana Shipments of Origin, Top Five Commodities, (All modes - $55.1 Billion)

51 Louisiana Shipments of Origin, Top Five Destinations, (All modes - $55.1 Billion)

52 Port Activities Part of Larger Chain

53 Louisiana Freight Profile
54 Total Freight Transportation in Louisiana ,022,178 Thousand of Tons Source: Freight Analysis Framework, FHWA 612,482 Current Millions$

55 Louisiana s Trade Partners ,467 Thousand of Tons Source: Freight Analysis Framework, FHWA 447,591 Current Millions$
56 Comparison of Freight Dependency: US, Southeast, Louisiana (2011) 60% Share Based on Estimated Industry Clusters, NIACS Code 50% 40% 30% 20% 10% 0% US Average Southeast Average Louisiana Consuming Producing
57 Industry Share of the Louisiana Economy, 2011 Government 8% Agriculture, forestry, fishing, and hunting 1% Mining 9% Utilities 1% Construction 3% services 27% Manufacturing 20% Transportation and warehousing 3% Retail trade 4% Nondurable goods 18% Durable goods 3% Wholesale trade 3%
58 State Economic Output in Transportation Sectors, Millions of Dollars Warehousing and storage Other transportation and support activities Pipeline transportation Transit and ground passenger transportation Truck transportation Water transportation Rail transportation Air transportation

59 Services vs. Goods

60 Response

61 DOT s have two questions they need to answer concerning freight: 1. How do I help my businesses grow 2. How do I offset through cargo on my network
62 What is the value of I-69 What is value to individual states? What is value to region? What tools are needed? BCA Data Needs


63 Example Choices between Baton Rouge and Lafayette Automobile Bus Rail - Amtrak Airplane Boat Walk Horse Bicycle


64 Regional Operations are no laughing matter Lost productivity for all involved!!
65 Planning for Freight- Today More modal balance Largest trading partners are neighbors To-From State 34% Through Freight 33% All Modes All cargos Discretionary routing Mostly Trucks Tend to be heavier products Rural-urban flows Urban-urban flows Within State 33%

66 What is the value of I-69 What is value to individual states? What is value to region? What tools are needed? BCA Data Needs
 Source: Freight Analysis")
67 Forecast of Transportation for Louisiana By Weight (in thousand tons) Source: Freight Analysis Framework, FHWA
 Source: Freight Analysis Framework,")
68 Forecast of Transportation for Louisiana By Value (current millions $) Source: Freight Analysis Framework, FHWA

69 Are We Prepared for the future?

70 Needs in Southeast from Latin American Trade (LATTS)
71 And What? Will exports go up or down in 10 years? Fracking, natural gas? Where will people live in ten years? Where will the state see more truck traffic? Will there be a catastrophic lock failure? What if we go to heavier/longer trucks? What if the State attracts more manufacturing? Truck parking issues? What does this cost my economy?
72 Freight Planning Does Matter Do this every day Needs to be more than truck counts, axle weight, etc. Needs to help make business competitive Its only as complicated as we make it It is not checking a box It helps create a future The Story Matters
73 Some Considerations What do WE want Relinking Transportation to industrial development Perception of value of capital stock Economic development = jobs What must WE balance Everyone more engaged in parts of the debate System s use not fully understood Others Have It syndrome Scale and Densities Aging Infrastructure vs. Capacity Manage Expectations
74 Final Thoughts? Louisiana benefits From previous investment in public and private freight infrastructure These facilities connect the State with world markets, generating jobs The State growth is with external markets The lack of systems approach May result in congestion and unreliability Will add costs to doing business