Strategic Port Authority Leadership. May 8, 2006 Presented by Bernard S. Groseclose, Jr. President & CEO S.C. State Ports Authority
|
|
|
- Morgan Riley
- 5 years ago
- Views:
Transcription

1 Strategic Port Authority Leadership May 8, 2006 Presented by Bernard S. Groseclose, Jr. President & CEO S.C. State Ports Authority
2 Congestion Could Crush U.S. Ports By The Journal of Commerce Online March 7, 2006
3 Federal & International Regulations The Port Environment Truckers Railroads Stevedores Global Economy Shipping Lines/Agents Longshoremen THE MARINE TERMINAL Repair/Maintenance State/Local Governments Warehouses Tugs Pilots Brokers/Forwarders Environmental Issues


4 Ocean Carrier (or local agent) Exporter/Importer Forwarder/Broker Misc. Ship Services Stevedore Ports Authority Pilots Tugs Line Handlers Surveyors Chandler/Supplies Longshoremen Clerks Mechanics Carrier-Directed Transloading VESSEL SERVICES Berthing Crane Operators Container Handlers CARGO SERVICES Common User Receiving/Delivering/Scheduling Shipper-Directed Transloading Terminal Equipment Maintenance Licensed-User Gates Inventorying/I.T. Security
5 Landlord vs. Operating LANDLORD Principal Relationship with Stevedore/MTO Little Operational Control/Oversight More Focus on Long- Term Construction, Planning, Financing Insulated from Many Operating Issues OPERATING Principal Relationship with Ocean Carrier Direct Operational Control/Oversight Must Focus on Long- Term and Daily Operations Higher Profile in Port Community
6 Factors Impacting Ports, Terminals Trade Growth Larger Vessels Inland Infrastructure Automation & Technology Truck Power Labor, Fuel, Shortages Environmental Concerns, Interests Community Opposition Traditional Work Rules Industry Consolidation Safety Issues Security, Regulations
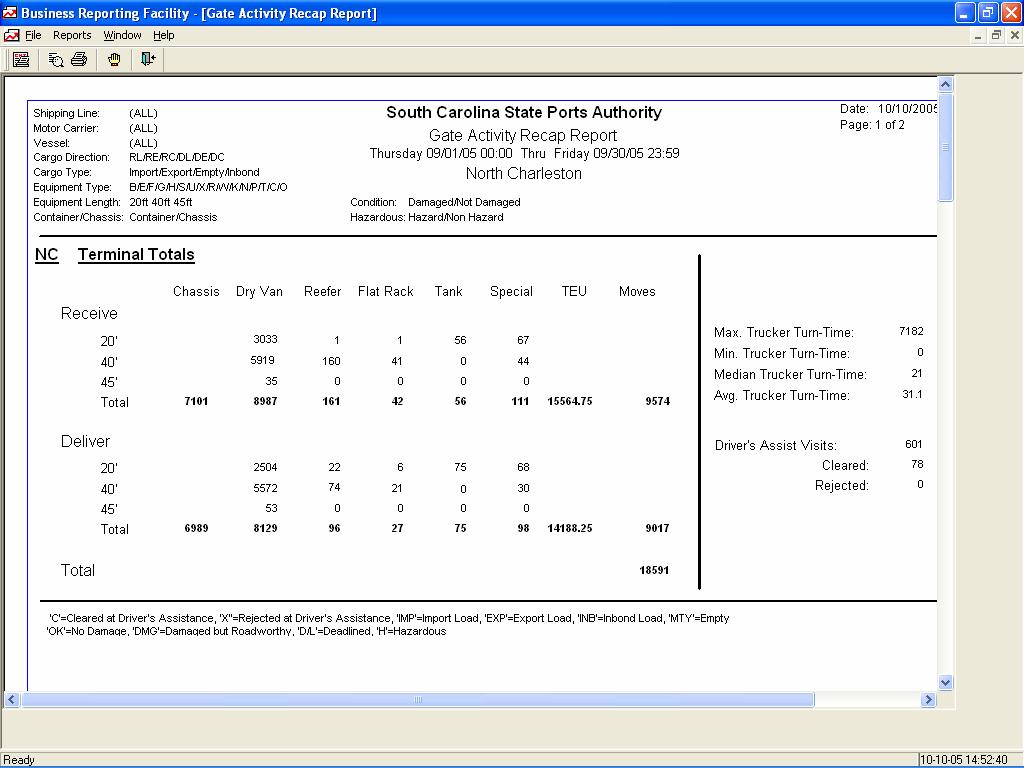
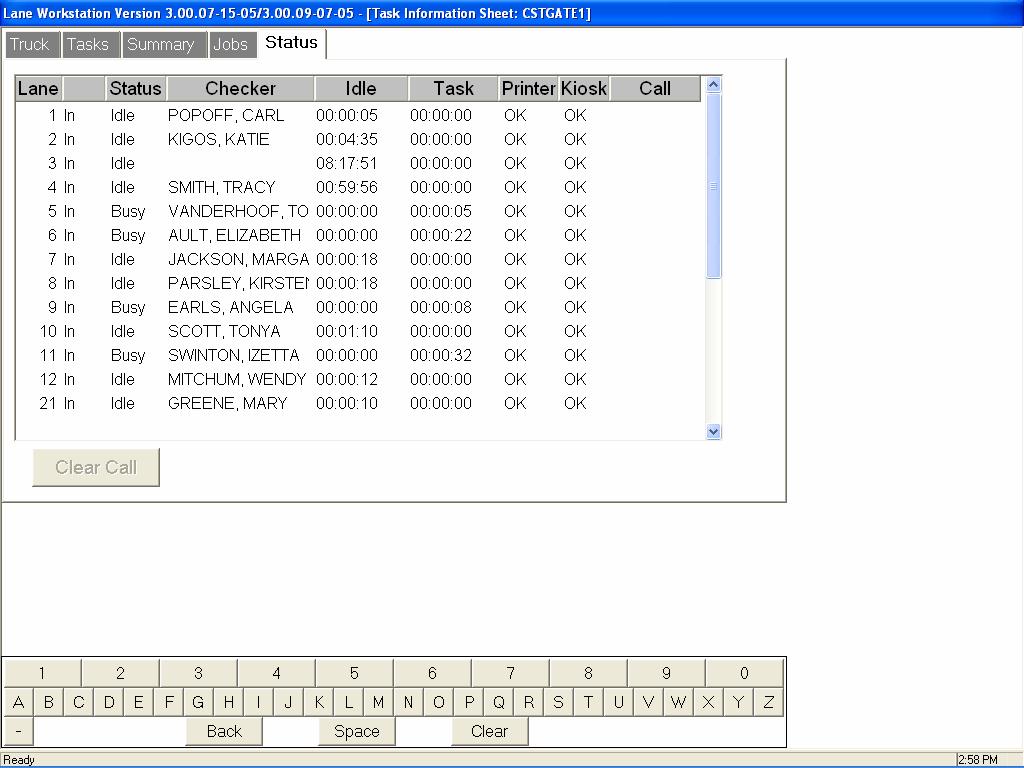
7 Measuring What We Do Operational Productivity Truck Turn Times Ship Turn Times Yard Productivity Merit-Based Pay Pay for Performance Incentives Benefits Specific Performance Measures Operating Margin Volume Cost Per Unit Accident Rate
8 Current Operations Efficiency Charleston Port Productivity Crane Efficiency All Carriers (moves per hour per crane) SCSPA Global Standard Gate Efficiency Trucker Turntime Common Use (minutes) SCSPA (common use) U.S. Standard Yard Utilization Throughput (TEU per acre per year) SCSPA U.S. Standard 4,907 3,000
9
10
11
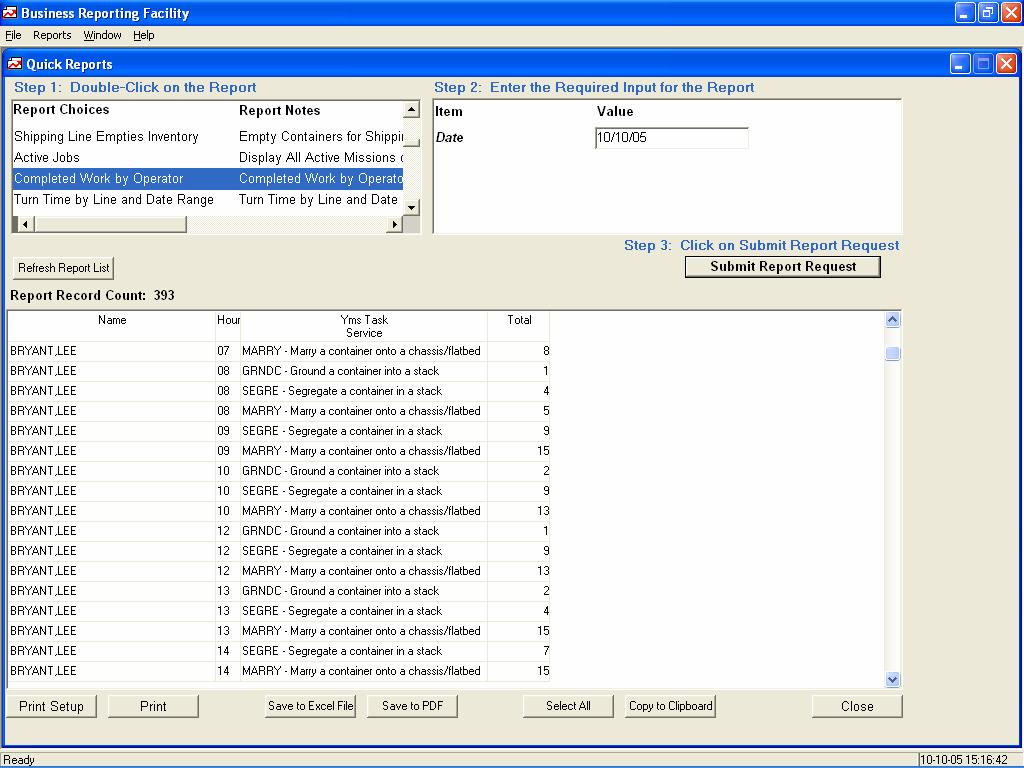
12 Tracking Crane Productivity Jan-Mar 06 Crane Type Total Moves Hours Total Productivity Canron - CST 1, Canron - NCT 6, Canron - WWT 1, IHI - NCT 54, , IHI - WWT 9, Morris 51, , PACECO - CST 25, PACECO/Espana 16, PACECO/HHI 116, , Grand Total 285, ,
13 Cutting Dwell Times Average Dwell Average Dwell Dwell As of 1 June 2005 As of 1 December 2005 Difference Terminal Export Import Export Import Export Import CST NCT WWT
14 Ports Must Improve Productivity Measures & standards, operational inputs Capacity New facilities, enhanced utilization Infrastructure Landside and waterside

15 To Prepare for Increasing Trade in Charleston: Complete Harbor Deepening Improve Existing Facilities Bridge Construction & Demolition Permit & Expand at Navy Base Expand on Savannah River Enhance Transportation Connections
16 Specifically, Successful Ports will Extend Gate Hours Requires volume commitments, truckers Reduce Dwell Time Better management, contractual requirements, demurrage Manage Equipment Stackers, empty standards, off-site storage & chassis pools Apply Technology Such as OCR, RF in new ways Build New Terminals Perhaps limited by land, opposition Enhance Local Transportation Connections Last-mile & rail connections
17 The Realities of U.S. Infrastructure ASCE says the U.S. needs to spend $1.6 trillion in 5 years on existing infrastructure 2005 report card: aviation D+, navigable waterways D-, highways D, rails C- In 60s & 70s, federal infrastructure spending was 1% of GDP; by 97 dropped to 0.57% U.S. has 4 million miles of public roads/bridges, 5,200 airports, 163,000 miles of railroad and 9,000 commercial docks and piers In 30 years, vehicle highway travel has increased 161%, but road mileage increased only 6% Congestion costs $63 billion in wasted time and fuel Jobs depend on trade, but U.S. can t remain competitive and keep the economy from stagnating without infrastructure investment Center for Strategic & International Studies has called for a National Investment Corporation to focus on projects of national significance SAFETEA-LU, the current $286 billion highway spending bill, has 6,300 earmarks worth $24 billion
18 Increasing volume does not have to mean increased congestion and higher costs. Charleston s FY05 Results: Container volume up 14% Expenses up only 0.35% Maintained or improved productivity