Services trade and services trade statistics
|
|
|
- Joella York
- 5 years ago
- Views:
Transcription


1 Opportunities and challenges in using evidencebased trade policy for the achievement of sustainable development goals Thimpu, June 2016 Services trade and services trade statistics Mia Mikic, TIID
2 Lets start with why are services different? Features of services: Intangibility Non storability Intermediation Protection behind the border High regulatory intensity Diversity Examples of services: Teaching Hair-cut Retail Internet Banking Guiding tours Services in national data
3 Outline we shall discuss the following questions: Services trade - concepts Services trade - barriers Measuring services trade Q&A
4 Trade in services
5 Issues Which services are tradable, that were not tradable 10 years ago? Which services will become tradable tomorrow? How to predict those? How many jobs are in tradable services? Which of these face competition from other developing countries? How important are services for efficiency and productivity growth? Industrialization?
6 The accepted notion of services trade comes from the General Agreement on Trade in Services - GATS For the purposes of GATS, services trade is defined as a supply of a service: 1. from the territory of one member into the territory of any other Member 2. in the territory of one member to the service consumer of any other member 3. by a service supplier of one member, through commercial presence in the territory of any other member 4. by a service supplier of one member, through presence of natural person of a member in the territory of any other member.
7 This definition is now generally known as the four modes of trade in services Mode 1: cross-border provision (25-30%) Mode 2: consumption abroad (10-15%) Mode 3: commercial presence (55-60%) Mode 4: a temporary movement of natural persons (<5%)
8 APEC definition Consumer or property located within territory of residence No Mode 2 (BPM6 services) Yes Supplier has presence within consumer s territory Yes Supply through Commercial presence Mode 3 (FATS) No Mode 1 (BPM6 services) Mode 4 (BPM6 services) Presence of natural persons Source: Manual on Statistics of International Trade in Services 2010.
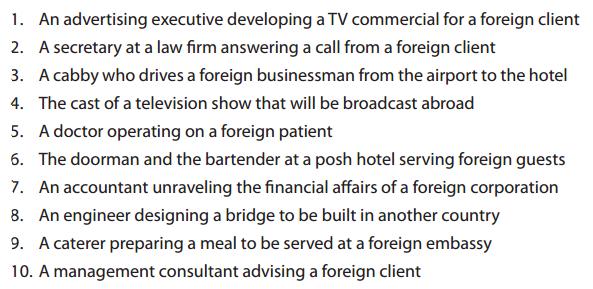

9 Examples Feketekuty, 1988
10 Policies For goods - control is through border measures (e.g. tariffs) For services - control is through regulations no tariffs (remember how services are supplied? ) Restrictions are with the importing country- behind the border barriers, many in form of Government regulations (which are often prudent and necessary; examples?) Concern exists when regulations are applied in a discriminatory and unnecessarily restrictive manner that limit market access; many come in form of restricting FDI (mode 3) or temporary movement of providers and consumers of services (modes 4 and 2). Are there restrictions on mode 1? Are there restrictions on exports of services?
11 Effects of trade barriers in services Traditional resource allocation and scale effects More recent barriers (related to digital trade and data flows) include forced localization of trade (e.g. requiring locally based servers or no transfer of own data) - has to be weighted against need to protect privacy for citizens, security, and similar When thinking of barriers, think about role of services as intermediates in industrial and agricultural exports, not only about services as final (consumer) good
12 Measuring services trade Based on presentations shown at the Trade Data Day, WTO, July 2016
13 UN Interagency Task Force on ITS Services and merchandise trade statistics TFs established in early 1990s, meeting jointly since 2008 Convenors: WTO and OECD, other members: IMF, UNSD, UNCTAD, UNWTO, Eurostat Coordinate work of international organisations on statistics of merchandise trade and services trade (meta) data collection, sharing, processing and dissemination; conceptual work (standards, classification, compilation problems): Manual on Statistics of International Trade in Services (2010 edition); technical assistance (i.e. implementation), compilation guidance: first edition released in December 2014 Overview of existing databases covering statistics of international trade in service at different international organizations <
; Eurostat on-line database (structural business stats), WTO s International Trade Statistics publication + I-TIP services statistics module Value added Measures")
14 What needs to be measured? Value of services trade flows (modes 1,2,4): By detailed service category and partner For all economies, regions, economic groups, world FATS - OECD.Stat (globalisation); Eurostat on-line database (structural business stats), WTO s International Trade Statistics publication + I-TIP services statistics module Value added Measures Other indicators
15 Measuring trade flows What is available: Difficult to get a matrix of bilateral flows, mostly there is trade flow with the world (BOP): Exports and imports of modes 1 and 2 Annual (sometimes quarterly) time series Available for most countries worldwide UNCTAD Data on Trade in Services: 1980-current Total services and 11 services categories World Bank World Development Indicators Services in GDP and employment (1960-current) Services trade (2005-current): total services and 5 services categories Collected from IMF Balance of Payments Statistics Yearbook
16 Some data
17 WTO
18 WTO
19 Measuring bilateral trade flows World Bank Trade in Services Database Provides a global picture of bilateral trade in services for developed and developing countries Developed by T&C with Francois et al. (2013) Consolidates multiple sources of bilateral trade data on services (UN, Eurostat, OECD) and global trade data (IMF) Applies mirror techniques to capture North-South trade (South- South remains largely unreported) Cross-border trade and consumption abroad (modes 1 and 2) Reported across sectors (BOP codes), economies (195) and years ( )
20 Measuring value added services trade World Bank Export of Value Added Database Measure value added exports of services and the linkages with other export sectors Developed by T&C with Francois et al. (2013) Based on input-output tables from GTAP Measures gross, direct and indirect value added exports based on backwards versus forward linkages Reported across 27 sectors (9 commercial services, 3 primary and 14 manufacturing), economies (118) and years ( ) OECD/WTO Trade in Value Added Database 66 countries, 5 services categories, (New release soon with updated years, more countries and disaggregated services sectors) Includes additional indicators such as foreign and re-imported value added in exports based on the OECD s own input-output tables

21 Regulatory mapping

22 WTO Services trade statistics
23 Challenging work ahead Services statistics on BoP basis implementation of new statistical standards (BPM6) develop partner data in particular in developing economies reduce asymmetries (OECD-WTO bilateral matrix project) Foreign Affiliates Statistics (measure mode 3) Develop modes of supply data New areas of work TiVA- Trade in Value Added terms (of which services) STEC-Services Trade by Enterprise Characteristics
24 Classification of services for WTO/UNCTAD/ITC Annual data: Total services, Commercial services, and 16 selected BPM5/EBOPS items; more detailed EBOPS information available from ITC Trade map; more detailed EBOPS information available from ITC Trade map; Under development: Quarterly data by 4 main sub-items: Transport, Travel, Other (commercial) services and government services n.i.e.
25 Classification commercial services (BOPM6) The current account is subdivided into goods, services (including government goods and services, n.i.e.), primary income, and secondary income. Commercial services comprise all services categories except government goods and services, n.i.e. Commercial services are sub-divided into manufacturing services on physical inputs owned by others, maintenance and repair services n.i.e., transport, travel, and other commercial services.
26 The BPM6 contains the following 12 standard services components (1) Manufacturing services on physical inputs owned by others (2) Maintenance and repair services, n.i.e. (3) Transport (4) Travel (5) Construction (6) Insurance and pension services (7) Financial services (8) Charges for the use of intellectual property, n.i.e. (9) Telecommunications, computer and information services (10) Other business services (11) Personal, cultural and recreational services (12) Government goods and services, n.i.e.
27 Based on data we have: what do we know about services trade Asia-Pacific Trade and Investment Report (ch 2), ESCAP Services more resilient in crisis Developing countries participation increased Transport and travel share in world trade decreased South-south trade increased Role of so-called servicification

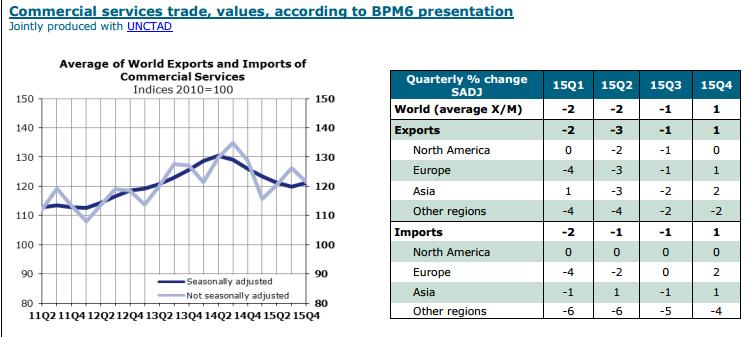
28 World exports of commercial services, by main category
29 Exports and imports of total commercial services, by selected region EXPORTS IMPORTS 2014 q q q q q q q q q q4 World North Americaincl. Mexico Europe a Asia
30 Services trade and LDCs
31 Progress made for LDCs with Services waiver Developed and developing Members shall indicate sectors and modes of supply where they intend to provide preferential treatment to LDC services and service suppliers; A Member may accord preferences similar to those arising from preferential trade agreements to which it is a party; Targeted and coordinated technical assistance aimed at strengthening the domestic and export services capacity of LDCs The Council for Trade in Services shall periodically review the operationalization of the waiver ESCAP Trade Insights, No.13
32 Post-Bali and challenges in services negotiations Linkage to other negotiating areas Especially agriculture & NAMA Difficult policy coordination in capitals Sectoral responsibilities scattered among different ministries Structure of GATS Schedules and modal structure too complex? Regionalism Diversion of negotiating resources? Lack of political leadership: Informal meeting of Trade in service council on 20 April 2015, etc.
33 Q&A Keep up to date at: Thank you artnet.unescap.org
34 Selected references Asia-Pacific Trade and Investment Report, various issues, ESCAP J. Bradford Jensen (2011) Global trade in services: Fear, Facts and offshoring, PIIE

35 Some international data - US