2017 Q2 EPS Response Time and Dispatch Call Volumes. Presented to the Edmonton Police Commission July 20, 2017
|
|
|
- Chloe Fox
- 5 years ago
- Views:
Transcription

1 2017 Q2 EPS Response Time and Dispatch Call Volumes Presented to the Edmonton Police Commission July 20,
. New for this report: Response Time Performance by patrol division.")
2 Purpose Respond to EPC s request to provide trend analysis of Priority 1-5 Response Time Performance & Dispatch Call Volumes ( Q2). New for this report: Response Time Performance by patrol division. Response Time Distribution by each priority level. 2
3 Priority Levels & Response Time Targets Priority Code Definition/Example Response Time Target (80% of the time) 0 Officer in Distress / Officer Needs Assistance In Progress Person At Risk - Response will likely prevent or reduce further harm to a person example: assault with a weapon in progress In Progress Property At Risk - Immediate response will likely prevent or reduce the further loss of property example: a neighbour observing an auto theft in progress Just Occurred - Immediate response will increase the likelihood of locating a suspect example: mischief that occurred very recently Dispatch Time + Travel Time 7 minutes Dispatch Time + Travel Time 12 minutes Dispatch Time + Travel Time 17 minutes 4 The Nature of the Occurrence is Time Sensitive example: a shoplifter is in-custody with security and is cooperative Dispatch Time + Travel Time 40 minutes 5 General Service - The nature of the offence is not time sensitive example: a business finds that they were vandalized the night before (i.e., the absence of in progress or just occurred) Dispatch Time + Travel Time 180 minutes 6 The Occurrence is Minor in Nature (eg.) Bylaw 9 Broadcast - Information only 3
4 What is Included in our Statistics Dispatch Call Volume Priority 1-5 Pre-empted calls where we do not arrive Excludes: On-view calls (< 30 second response) Follow-up calls Priority 0 (officer in distress), 6 (bylaw), 9 (general information) In 2016, Dispatch Call Volume was 163,158. Response Time Performance Priority 1-5 In addition to above criteria, excludes: Priority 1 impaired driving Pre-empted calls where we do not arrive Calls where the final priority level was more urgent than the original level (~2.5% of calls in 2016) Response Time Performance calculates from a subset of dispatch call volume. In 2016, this was based on 139,711 records. 4
5 Steps to Complete a Emergency Call Phone call is placed Phone call in 911 queue Phone call answered (operator) Phone call Transferred to evaluator Phone call answered (evaluator) Event Accepted CAD call created/sent to dispatch Call dispatched to patrol Patrol Arrives on-scene Patrol Concludes Call 911 Operator ASA 911 Assess Time 911 Evaluator ASA Evaluator Initial Assess Time Dispatch Delay Time Travel Time Investigative Time Response Time Performance 5
6 Distribution of Priority Levels The majority of dispatch call events are of low priority (P4,P5). Only 7.6% of calls in 2016 were highly urgent (P1-P3). In 2009, this was 16.5%. All growth in calls since 2009 have been in low priority (P4,P5). Percentage of EPS Dispatch Calls by final priority level 60.0% 50.0% 40.0% 30.0% 20.0% 10.0% 0.0% 49.8% 48.0% 42.5% 35.5% 11.1% 4.6% 5.5% 2.0% 0.8% 0.1% Priority 1 Priority 2 Priority 3 Priority 4 Priority
7 Response Time Drivers Response time is driven by a number of factors, including: Police strength Number of resources Resources committed to other calls Geographic size Distance Urban sprawl Environmental factors Traffic conditions Construction zones Weather Traffic Congestion, Travel Speeds Dispatch Call Volume Population growth Increasing complexity of criminal investigations and judicial requirements 7

8 P1-P5 Response and Dispatch Call Volume P1-P5 Dispatch Call Volume decreased 2.4% from YTD P1-P5 Response Time Performance declines since 2011 until this year. -1.3% 0.7% Annual dispatch call volume growth 4.0% 4.8% 3.2% 8.5% -1.0% 2017 YTD P1-P5 Response Time Performance was 69.0%, compared to 67.2% in 2016 YTD. Response Time Performance: % of events with Dispatch Time + Travel Time Priority Target Time 8

9 P1 - Response and Dispatch Call Volume P1 Dispatch Call Volume decreased 9.6% from YTD. P1 Response Time Performance 71.7% 2017 YTD, compared to 70.8% 2016 YTD. P1 Response Time Performance: % of events with Dispatch Time + Travel Time 7 min 9


10 P2 - Response and Dispatch Call Volume P2 Dispatch Call Volume increased 2.0% from YTD. P2 Response Time Performance 94.6% 2017 YTD, compared to 94.2% 2016 YTD. P2 Response Time Performance: % of events with Dispatch Time + Travel Time 12 min 10
11 P3 - Response and Dispatch Call Volume P3 Dispatch Call Volume decreased 9.3% from YTD. P3 Response Time Performance 95.5% 2017 YTD, compared to 94.2% 2016 YTD. P3 Response Time Performance: % of events with Dispatch Time + Travel Time 17 min 11

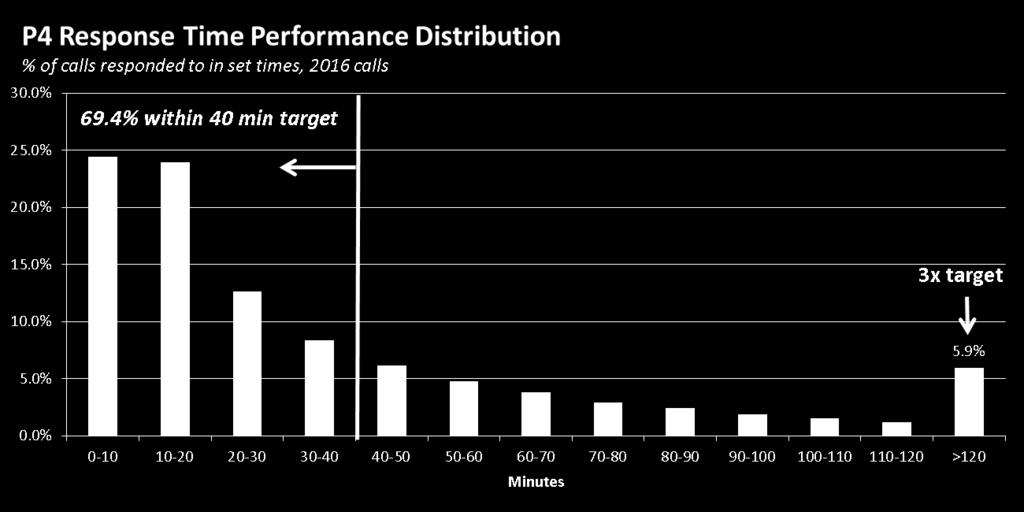
12 P4 - Response and Dispatch Call Volume P4 Dispatch Call Volume decreased 0.4% from YTD. P4 Response Time Performance 70.3% 2017 YTD, compared to 69.2% 2016 YTD. P4 Response Time Performance: % of events with Dispatch Time + Travel Time 40 min 12

13 P5 - Response and Dispatch Call Volume P5 Dispatch Call Volume decreased 3.6% from YTD. P5 Response Time Performance 69.0% 2017 YTD, compared to 67.2% 2016 YTD. P5 Response Time Performance: % of events with Dispatch Time + Travel Time 180 min 13
14 Response Time Distribution 14
15 Distribution of Response Times 15
16 Distribution of Response Times 16

17 Distribution of Response Times 17

18 Distribution of Response Times 18

19 Distribution of Response Times 19
20 20


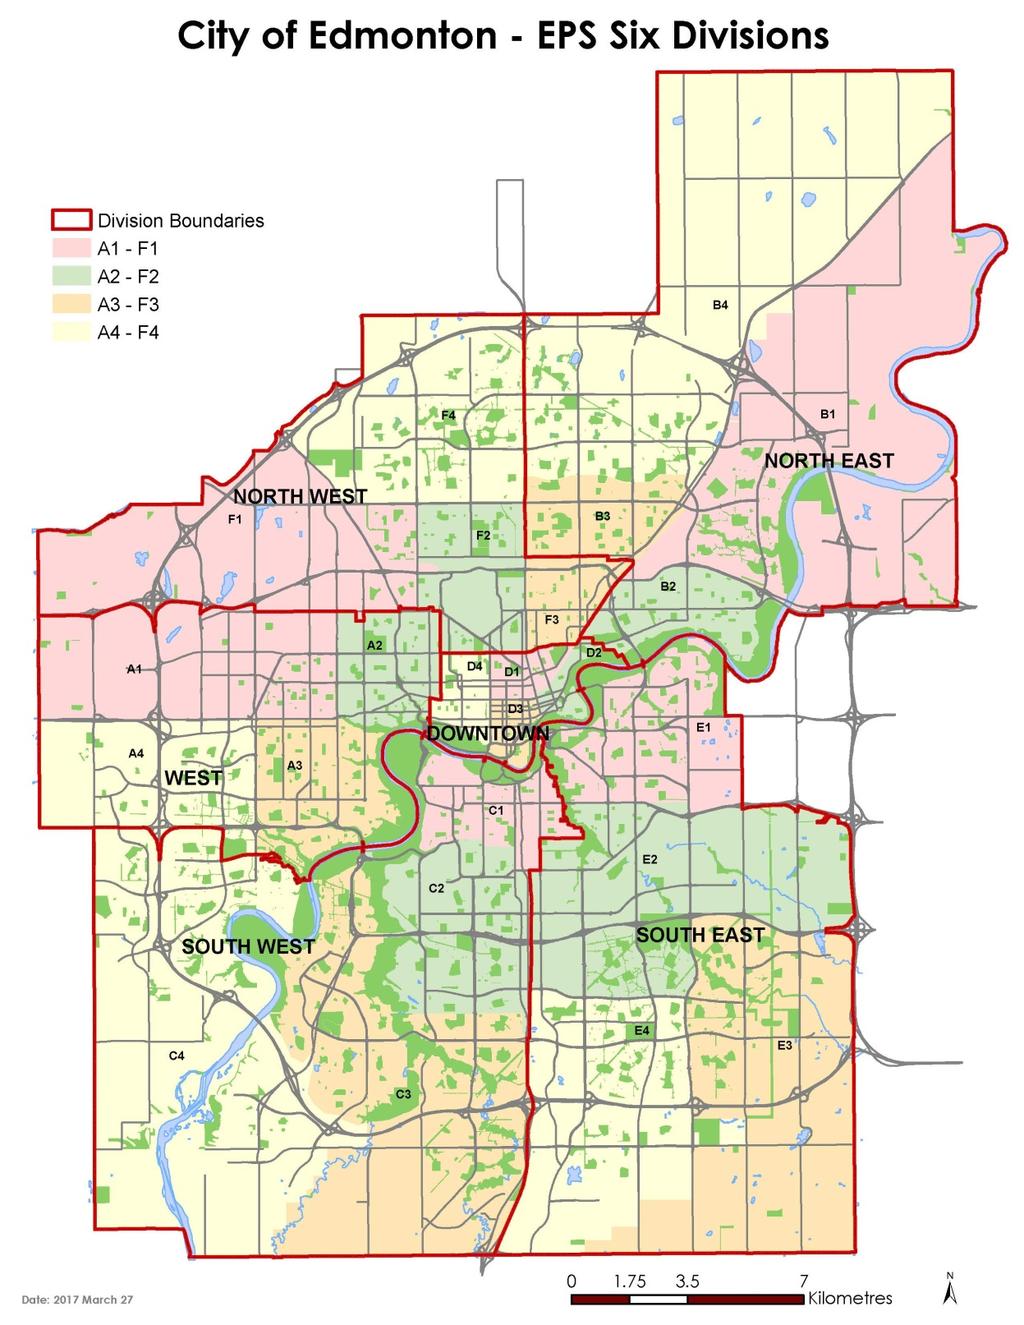
21 Response Time Divisions 21

22 Response Time Divisions 22

23 Response Time Divisions 23


24 Response Time Divisions 24


25 Response Time Divisions 25
26 Response Time Summary Divisions Response Time Performance against target, 2017 YTD Downtown North East North West South East South West West P1 P2 P3 P4 P5 Green: 80% Yellow: 70% Red: < 70% 26
27 EPS Action Items Communication Strategy to Patrol: Patrol focus on district policing and geographic deployment. Reduce self-dispatching. Response times can be affected when members selfdispatch and become out of position. Better to get clearance and direction from the watch commander. Driver Safety. Service Vehicle Collisions are up. Patrol members need to know its okay to slow down in order to get to calls safely. Time tracking. The importance of accurately tracking time and booking off on calls is being stressed to members. Org review of on-hold P5 calls. Enhancements at Old Scona station (SW) and Ottewell station (SE) will reduce patrol clustering at the divisional stations. EPS commitments following City Auditor recommendations on patrol staffing: MPP methodology to be assessed/revised in Q year review cycles after. MPP model will be run in Q1 2018, and annually afterward. 27

28 Summary City-wide Stats EPS Response Time 2016 Q Q Performance and Dispatch YTD YTD Priority 1 Priority 2 Priority 3 Priority 4 Priority 5 Performance Performance Performance Performance Performance 75.3% 93.6% 93.4% 76.0% 83.1% 80.6% 95.1% 95.7% 80.8% 85.1% 79.1% 94.8% 95.3% 83.9% 85.4% 77.0% 96.2% 94.1% 80.6% 82.7% 71.2% 92.9% 92.1% 76.0% 75.4% 71.3% 92.9% 92.8% 73.2% 72.2% 71.4% 93.2% 92.9% 69.2% 62.6% 70.9% 94.7% 94.6% 69.4% 62.6% 71.1% 94.2% 94.3% 69.2% 60.7% 71.7% 94.6% 95.5% 70.3% 63.8% # Calls # Calls # Calls # Calls # Calls 6,238 1,143 15,039 48,261 65,172 6,315 1,003 14,798 52,355 59,665 4, ,843 56,489 58,939 4, ,472 61,436 61,344 4, ,494 65,949 63,629 4, ,782 71,130 64,393 3, ,490 78,978 70,347 3, ,049 81,270 69,317 1, ,819 40,854 34,527 1, ,372 40,693 33,297 Total # Dispatched Calls 135, , , , , , , ,168 81,918 79,926 Source: Cognos R15-091, generated July 7,

29 QUESTIONS? 29