... Terminal of the Future in San Pedro Bay. by Ashebir Jacob Larry Nye Moffatt & Nichol
|
|
|
- Victoria Amber Gardner
- 5 years ago
- Views:
Transcription

1 Terminal of the Future in San Pedro Bay by Ashebir Jacob Larry Nye Moffatt & Nichol September 15,


2 Moffatt & Nichol Founded in 1945 in Southern California to serve the evolving Naval, Port and Maritime Industries 550+ employees; 27 offices (North America, Europe, Latin America, Middle East, Pacific Rim) A recognized leader in marine terminal planning, analysis, design and goods movement economics 2
3 Container Shipping 101 the real driving force behind globalization is the declining cost of international transport Journal of Commerce The Box That Changed the World It has always been about cost It will always be about cost But it is also about reliability 3

4 Container Shipping 101 People need to move stuff The people of the world are connected by very deep water Water is very strong Water is very slippery Ocean shipping is, forever and always the best way to move stuff on this planet. 4

5 San Pedro Bay Ports 5

6 San Pedro Bay Ports are Blessed Geo-nautically positioned between Asia and North America Near-perfect year-round weather Natural headland and federal breakwater protecting a ~15,000 acre embayment with ~40 foot water depth and a sandy bottom Relatively inexpensive deepening and reclamation Rock quarry on the water in Catalina Island Local population of ~12 M people High Capacity (avalanche-free) highway and rail connectivity to US hinterland and ~350 M people (the rest of em) Two competing ports, well-managed for the benefit of local and San Pedro Bay national beneficiaries Historically building state-of-the-art port, road and rail infrastructure ahead of demand Over 3,000 acres of dedicated container terminals Rock Quarry If that were not enough; $Billions in oil and gas resting below it all California is the worlds 10th largest economy 6
7 Where have We Been? About 50 years into containerization US Chassis-based systems (original Sea-Land model) Responsive ports developed relatively large terminal areas NY/NJ, LA/LB, Oakland, Houston, GPA Strong waterfront labor unions Relatively high labor cost Relatively slow to densify, change/innovate Rest of world Spared from the chassis curse Little space, higher terminal storage/throughput density required Varying labor jurisdiction and power Container handling automation developed in the 1990 s Netherlands, Germany, UK, Australia 7
8 Where are We Now? SP Bay Large vessels and call sizes 8,000 > 14,000 TEU vessels 8,000 lifts per call > 14,000 Terminals densifying Draying to offsite support yards Pier pass Latest container handling technologies are being deployed Operating procedures changing to match technologies 8

9 Terminal of the Future Singapore Next Generation Container Port Competition 20M TEU per year 80% Transshipment 200,000 slots 78 STS cranes 200 Yard cranes 2,500m 27 Landside transfer cranes Recessed terminal AGV railway 1,000m 1,000m 9
10 Where are We Going? Even larger vessels 18,000 > 22,000 TEU Maturing North American population Shifting economies and demographics North America and Europe aging Latin America maturing Asia and Africa growing Panama Canal Third Locks project opening next year (14,000 TEU) Will it effect SP Bay? 10

11 18,000 and 22,000? TEU Vessels 18,000 TEU 1,312 ft loa 202 ft beam 204 ft high High Cube bays Airdraft ~ 185? 22,000 TEU Concept 1,400 ft loa 202 ft beam 224 ft high High Cube bays (guess) Airdraft ~ 185? 11


12 2014 World Population Projection North America is a Maturing Market Population is aging and stabilizing If optimum vessel size settles, the next generation of SP bay terminals could last a long time We could (finally) create near perfect, optimized terminals for this port Europe, North and South America 12
13 What is the Future? System Optimization Vessels, services, service speeds, terminals, landside transportation all Right-Size and Right Speed for optimum service/cost Consistency, reliability, sustainability and predictability with lowest cost 13
14 Port Planning 101 So, we port people only need to get our arms around a few things Service Consolidations Technology Infrastructure Fuel Costs Cost IT Systems CHANGE Automation Cascading Capacity! Handling Technology ROI Seasonal Peaking Truck / Rail Splits The Internet The Chassis Problem Transit Time vs Cost Investment Climate Scrapping / IBC Handling Security VSA s Appointment Systems Hinterland Connectivity Labor Costs Panamax vs Post Panamax vs Super Post Panamax Port Productivity Vessel Size IY Ground Operations 14
15 Primary Drivers of Change in the Past Containerized trade volume growth Vessel size increases Technological advances Computers, internet, automation, etc., etc. Changing market pressures Transit speed Intermodal (double-stack) Just-in-time delivery Big box DC s Increasing fuel costs Environmental regulations & concerns Slow steaming 15
16 Terminal of the Future (San Pedro Bay) Large vessels with large number of moves per call Optimized services and terminals Electrically powered container handling Automated, semi-automated and driver assisted container handling where it makes sense to increase productivity Ship-to-shore cranes? Waterside transport? Container stacking / retrieval? Gate/truck service? Rail loading/unloading? People Jobs, safety, security and the environment 16
17 Big(ger) Ships are Coming to San Pedro Bay Larger vessels, steaming at optimum speed reduce slot cost More efficient power plants and hulls 14,000 TEU is New Panamax 18-22,000 TEU is nearly Suezmax But there are no canals between Asia and SP Bay How big will they get? 22,000-24,000 TEU is already being discussed Will these prove to be the optimum for Asia-NA? $400 $350 $300 $250 $200 $150 $100 $50 $0 Transpacific Fuel Cost per Loaded TEU ($900 / MT) $356 $224 $ ,200 13,800 18,000 Speed, Number and Size of Vessel 17
18 Optimized Asia NA Service; San Pedro Bay Terminal 6-22,000 TEU vessels 19 knots 41 total days per rotation, 25 sailing days, 2 days early-late allowance, 14 port days, 7 days each side Average 90% full, 2.0M TEU / year throughput generated / service 21,750 lifts per call accomplished within ~6 days High reliability, recoverability Low cost per box What will it take? 18
19 Days on Berth ,000 TEU Vessel 21,750 moves per Call K TEU Productivity vs Days on Berth 21,750 Lifts per Call Working Hoots, Not Working Hoots, 7 STS, 30 mph 8 STS, 34 mph 6 Days No of STS Cranes / Aver Net Producvitivy Berth days no hoots Berth days with hoots Berth Days Limit 19
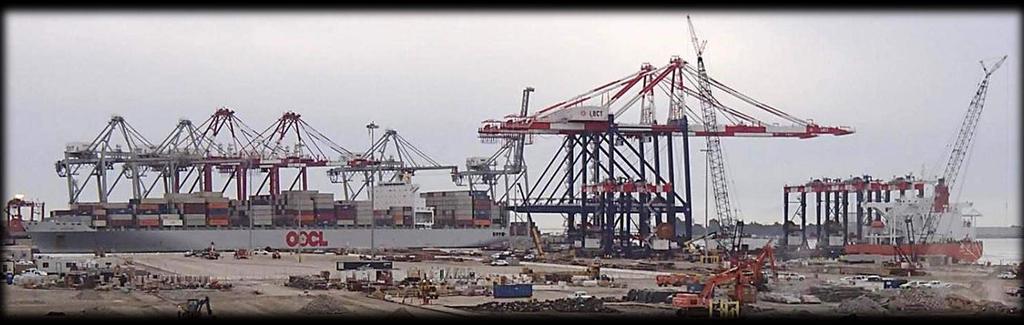
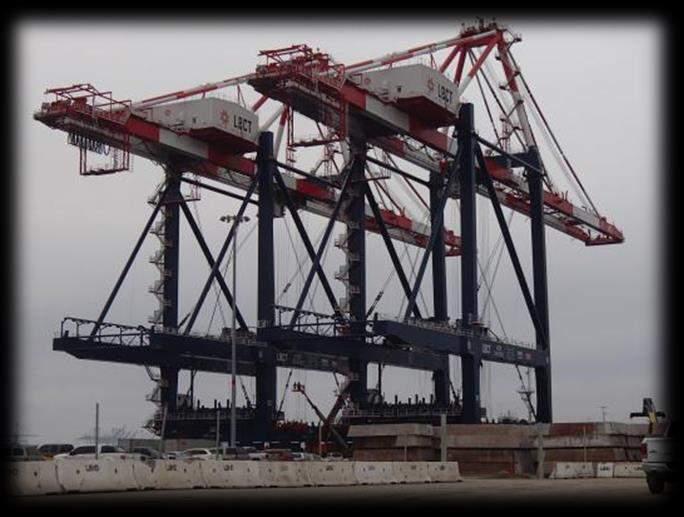
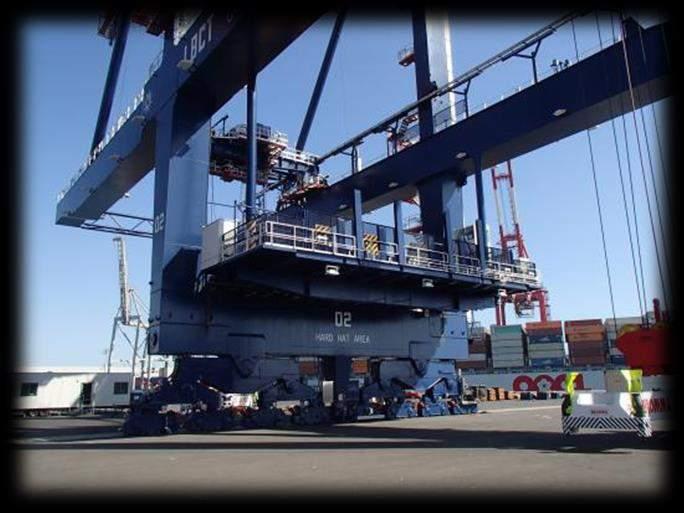
20 Ship-to-Shore Cranes 20

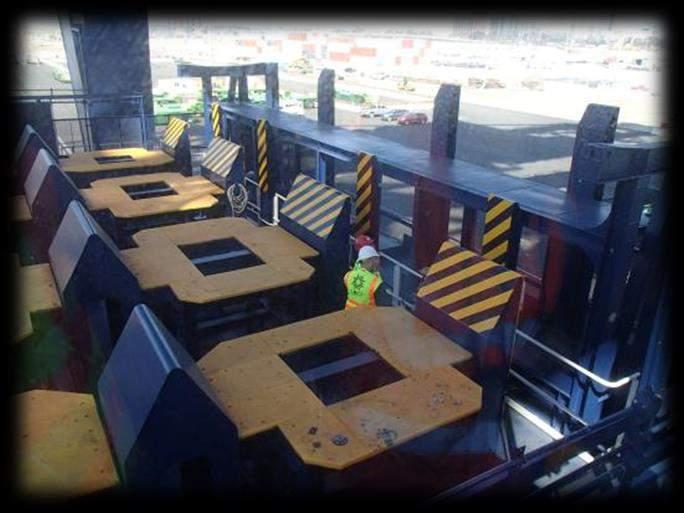
21 Ship-to-Shore Cranes Dual trolley, tandem / single Elevated transfer/ibc platform moves per hour Driver assist functions Remote operation? Handoff to HTS in back-reach 21


22 Ship-to-Shore Cranes Driver Assist or Automated Automated Manual Tandem / Twin / Quad Single 22


23 HC HC New Panamax & EEE STS Cranes 19 Rows Rows ,000 TEU - New Panamax Single Trolley Twin 20 / Tandem 40 Spreader 18,000 TEU - EEE Dual Trolley Twin 20 / Tandem 40 Spreader 23
24 HC Conceptual 22,000 TEU Outreach 225 Lift Height Rows ,000 TEU - EEE Dual Trolley Twin 20 / Tandem 40 Spreader 24
25 Feet STS Crane Dimensions Outreach and Lift Height ,200 13,000 18,000 22,000 Vessel Size Required Outreach incl 2.0M overrun Recommended Lift Height Above Rails 25
26 STS Wheel Loads Dedicated 22K TEU Berth 3 Bays 22,000 TEU Vessel bays / 8 STS cranes = 3.25 bays / STS Do we have to stay with 88 feet Bumper-Bumper and 16 wheels per corner? Why not B-B, 20 wheels per corner? 26
27 STS Wheel Loads Dedicated 22K TEU Berth 3 Bays 22,000 TEU Vessel bays / 8 STS cranes = 3.25 bays / STS Do we have to stay with 88 feet Bumper-Bumper and 16 wheels per corner? Why not B-B, 20 wheels per corner? 27
28 STS Wheel Loads Dedicated 22K TEU Berth 3 Bays 22,000 TEU Vessel bays / 8 STS cranes = 3.25 bays / STS Do we have to stay with 88 feet Bumper-Bumper and 16 wheels per corner? Why not B-B, 20 wheels per corner? 28

 AShC (hybrid")
29 Waterside Transport Detailed gathering and distributing tasks to/from storage Move any box, from any location to any location at any time Must be rubber-tired AGV (battery operated) AShC (hybrid diesel) 29


30 Container Stacking and Retrieval End-loaded stacking/retrieval cranes Side-loaded stacking / retrieval with landside transfer cranes 30

31 Rail Unloading/Loading Wide-span gantries Ground crew safety Buffer slots, bomb carts or ShC s Wide-span gantries with rotators Up to eight working tracks 31
32 Stacking End-Loaded or Side Loaded? End-Loaded twin (ala MHT and Trapac) Most cost effective for high import-export, low transshipment ASC s are separated for waterside and landside, difficult to balance Waterside and landside handling capacity is fixed WS ASC~18 LS ASC ~13 Won t fit on all sites Side-Loaded More costly than EL for high import-export Higher ASC productivity WS moves ~23 LS moves ~ 19 ASC fleet is combined, all waterside, all landside Handling capacity is variable Requires fewer ASC s, additional LTC s and more AGV s or ShC s Won t fit on all sites 32
 ~$275M Equipment (not incl. STS) 33")
33 3M TEU End-Loaded Twin ASC Terminal Dual Trolley STS Cranes AGV s AShC s WS ASC s LS ASC s Landside Transfer 40 WS ASC s at 18 mph = 720 net WS mph 40 LS ASC s at 13 mph = 520 net LS mph ~64 AGV s (or ~48 ShC s) ~$275M Equipment (not incl. STS) 33
 ~$400M Equipment (not incl.")
34 Dual Trolley STS Cranes 3M TEU Side-Loaded ASC Terminal AGV s or AShC s ASC s Landside Transfer 60 (larger) ASC s at mph = 1,260 WS/LS mph 21 LTC s ~156 AGV s (or about 132 ShC s) ~$400M Equipment (not incl. STS) 34


35 Side-Loaded ASC s & Landside Transfer Stacking Cranes 12W x 6 H LTC AGV or AShC OTR Truck Buffer Landside Transfer 35
36 8:00 9:00 10:00 11:00 12:00 13:00 14:00 15:00 16:00 17:00 18:00 19:00 20:00 21:00 22:00 23:00 0:00 1:00 2:00 3:00 4:00 5:00 6:00 7:00 Side-Loaded ASC Advantage Shared ASC handling capacity (HC) can be assigned to either waterside or landside Waterside HC = Total HC Instantaneous landside demand Export boxes received onto AHT can be sent directly to vessel Fits some terminal shapes that End-Loaded will not 1,400 1,200 1, Side-Loaded - 0% TS - WS and LS Handling Capacity Three - Shift Gate Demand Waterside Handling Capacity Total ASC Handling Capacity LS Handling Demand Total ASC Handling Capacity WS Handling Capacity 36
37 0.00% 25.00% 50.00% 75.00% % 0.00% 25.00% 50.00% 75.00% % US$ x 1.0M Equipment cost is equal at about 75% Transshipment Equipment Cost End-Loaded vs Side-Loaded? Total Equipment Capital Cost - Yard Cranes plus AHT $450 $400 $350 $300 $250 $200 $150 $100 $50 $0 $273 $273 $273 $273 $273 $400 $359 $317 $273 $225 End-Loaded Twin Percent Transshipment Side-Loaded 37

38 Example Where End-loaded Does Not Work Well Algeciras - 95% Transshipment Phase A End-Loaded Twin Proposed Phase B Side-Loaded 38

39 Example Where End-Loaded Would Not Work Well Pier J - 3.5M TEU Side Loaded ASC s 12W x 6 H 1-22,000 TEU Berth Landside Transfer Landside Transfer Rail Bridge AHTS Serving Berths, Rail & LS Transfer 1-18,000 TEU Berth Wide-Span Gantries 39
40 Annual TEU x 1M / 22k Service Equivalents How Many 22K Services Might There Be in San Pedro Bay? In 2030 at 3% growth rate, SP Bay throughput might be 25M TEU equal to 12-22,000 TEU weekly vessel equivalents So, we might actually have as many as 6 of them SP Bay Projected Throughput & 22K Service Equivalents - 3% Growth SP Bay Throughput 22K TEU Service Equivalents 40
41 Where Can We Put Them? 22,000 TEU service at 90% aver. full generates throughput of 2.0 M annual TEU s Requires about 43,500 TEU storage slots ~ 85 net acres of end- or side-loaded ASC stacking area ~100 net acres of RTG area Which terminals have 100 net CY acres to serve one vessel per week? 41
42 Conclusions? SP Bay will continue into the future as a port complex of regional and national significance Larger vessels and higher throughput are coming New technologies and processes need to be applied For terminals, it is somewhat basic business as usual Adequate capacity Required productivity Predictable cost Weekly reliability But all on a larger and leaner scale Strive for Optimization There is no standard plan that will work for every terminal 42
43 43