FLORIDA SEAPORT SYSTEM PLAN
|
|
|
- Phillip Goodwin
- 5 years ago
- Views:
Transcription


1 FLORIDA SEAPORT SYSTEM PLAN JULY 2016
2

3 ` TABLE OF CONTENTS 1. Introduction & History Introduction Statement of Purpose Vision of the Florida Seaport and Waterway System Plan Overview and Approach Related Plans and Resources The Florida Seaport System Today Success of the Florida Seaport System Florida Seaports by The Numbers A History of The Florida Seaport System Conclusion Seaport System and Individual Seaport Profiles Introduction to the Florida Seaport System Seaport Governance and Structure Florida s Position Top Five States: Rankings and Numbers Cruise Containers Tonnage Automobiles Petroleum Florida Seaport Metrics Cruise Passengers Containerized Cargo Bulk Cargo Seaport Profiles Conclusion Florida Seaport & Intermodal Freight Systems: Statisticts, Trends, and Conditions Florida Seaport Cargo and Cruise Trends Florida s Total Waterborne Commerce Florida Seaport Cargo Volumes Florida Seaport Volumes by Cargo Type Container Lines Serving Florida Seaports Florida Seaports Cruise Business FDOT 2015 Florida Seaport System Plan i
4 Table of Contents Florida Cruise Industry Trends Florida Cruise Industry Provisioning Florida s Strategic Intermodal System Establishing a Strategic Intermodal System The Strategic Intermodal System (SIS) Florida s SIS Seaports and Waterways Florida s Future Corridor Planning Process Highways, Connectors and Motor Carriers Highway Connections at Florida Ports Recent Road Connector Improvement Projects at Florida Seaports Florida s Motor Carrier System Commodities by Truck The Trucking Industry in Florida Fuel Taxes Railroads, Connectors and Terminal Operators Recent Rail Improvement Projects at or Near Florida Ports Intermodal Logistic Centers and Distribution Centers Foreign-Trade Zones and Freight Logistics Zones Foreign-Trade Zones Freight Logistics Zones U.S. Waterborne international Trade Florida s International Waterborne Trade Florida s Top International Trade Commodities Florida s International Trade by Value of Imports and Exports Global and Regional Waterborne Trade Trends and Patterns Expansion of the Panama Canal Increased Use of the Suez Canal Expansion of Trade With Cuba Florida s U.S. Seaport competition Florida s Primary Competitors U.S. Southeast Atlantic Seaports U.S. Gulf of Mexico Seaports Harbor Deepening Competitive Summary Conclusion Seaport and Stakeholder Perspectives Advantages, Constraints to Growth, and Issues Affecting the Florida Seaport System Stakeholder Outreach Stakeholder Outreach Summary Matrix Advantages of Florida s Seaport System Constraints to Growth Identified Issues and Needs of Florida s Seaport System Summary of Stakeholder Responses By Catgories ii 2015 Florida Seaport System Plan FDOT
5 Table of Contents Conclusion Seaport Infrastructure Funding and Investments Seaport Infrastructure Funding Seaport Revenues Public-Private Partnerships (P3s) FDOT Statutorily Mandated Seaport Investment Programs Florida Seaport Transportation and Economic Development (FSTED) Council Strategic Port Investment Initiative (SPII) Seaport Bond Programs Intermodal Logistics Center (ILC) Support Program FDOT Discretionary Programs used for Seaport Investments Strategic Intermodal System (SIS) FDOT District Funds State Infrastructure Bank (SIB) Loans Federal Programs Available to Seaports U.S. Army Corps of Engineers (USACE) Department of Homeland Security Federal Emergency Management Agency (FEMA) Grants United States Maritime Administration (MARAD) Transportation Infrastructure Finance and Innovation Act (TIFIA) Credit Assistance Transportation Investment Generating Economic Recovery (TIGER) Discretionary Grant Program Fixing America s Surface Transportation (FAST) Act Florida s Seaports Capital Improvement Program (CIP) FDOT Seaport Work Program Recent FDOT Seaport Investments Conclusion FDOT Seaport Focus Areas and Strategies to Support Florida Seaports Florida Seaport System Plan Structure Prior & Current Planning Efforts Florida Seaport System Plan Florida Freight Mobility and Trade Plan (FMTP) Analysis Of Global Opportunities and Challenges for Florida Seaports Florida s Transportation Plan Update SIS Policy Plan Update Strategic Characteristics of Florida s Seaport System Florida Seaport Development: Strategic Considerations FDOT Seaport Strategies, Focus Areas, and Initiatives Conclusion and Outlook FDOT 2015 Florida Seaport System Plan iii
6 Table of Contents LIST OF APPENDICIES A-1 Plan Integration Cross Walk... A-1 A-2 FDOT Transportation Plans, Goals, and Objectives... A-2 B History and Details... B-1 C Definitions and Descriptions... C-1 D-1 Seaport and Waterway System Plan Questionnaire... D-1 D-2 Stakeholder Respondent List... D-5 D-3 Stakeholder Response Table... D-6 iv 2015 Florida Seaport System Plan FDOT
7 LIST OF TABLES Table 2-1: Summary of Florida Seaport Containers, Tonnage, Trade Direction, and Passengers Table 2-2: Florida Seaport Governance Structure and Related Membership Table 2-3: Florida Seaport Operational Structures Table 2-4: Florida Seaport Taxing Authority Table 2-5: Employment and Direct Purchase Comparison of the Top Five Cruise States (2014) Table 3-1: Summary of Florida Seaport Containers, Tonnage, Trade Direction, and Passengers Table 3-2: Imports, Exports, and Domestic Waterborne Tonnage at Florida Seaports, and Statewide Tonnage Totals (2010 to 2015) Table 3-3: Waterborne Tonnage at Florida Seaports (2010 to 2015) Table 3-4: Tonnage by Cargo Type at Florida Seaports and Statewide Tonnage Totals (2010 to 2015) Table 3-5: Containers in TEUs at Florida Seaport (2010 to 2015) Table 3-6: Container Shipping Line Companies that Call Florida on Seaports Table 3-7: Annual Multi-Day, One-Day, and Total Revenue Cruise Passengers at Florida Seaports (2010 to 2015) Table 3-8: Cruise Lines, and the Florida Seaports at which they Homeport Table 3-9: Designated SIS and Emerging SIS Facilities Table 3-10: Fuel Taxes by State Table 3-11: On Port Rail Service Table 3-12: U.S. Waterborne Foreign Trade Tonnage, in thousands (2010 to 2015) Table 3-13: U.S. Waterborne Foreign Trade Value (2010 to 2015) Table 3-14: U.S. Petroleum Imports and Exports, Thousand Barrels (2010 to 2015) Table 3-15: Florida s Top 10 Waterborne International Trade Partners in U.S. Dollars (2013 to 2015) Table 3-16: Florida s Top 10 Waterborne International Commodities in U.S. Dollars (2013 to 2015) Table 3-17: Distance from Hong Kong, China, to Gulf and East Coast Ports through the Panama Canal Table 3-18: Distance from Dubai, UAE to Gulf and East Coast Ports through the Suez Canal Table 3-19: Florida's Competitor Container Ports on the Gulf Coast and East Coast, Table 4-1: Stakeholder Outreach Summary Matrix Table 4-2: Identified Advantages of Florida s Seaport System Table 4-3: Identified Constraints to Growth Table 4-4: Identified Issues or Needs Table 4-5: Response by Port CIP Category Rank by Number of Responses Table 4-6: Response by Issues Category Rank by Number of Responses Table 5-1: Florida s Seaports Five Year Capital Improvement Programs (By Year) Table 5-2: Summary of Current FDOT Seaport Work Program for All Funding Types FY2015-FY Table 5-3: Top Investment Projects in the FY2015-FY2021 Seaport Work Program (Over $10 million) Table 6-1: Florida Seaport Diversity of Cargo and Facilities FDOT 2015 Florida Seaport System Plan v
8
9 LIST OF FIGURES Figure 1-1: Florida s 15 Public Seaports Figure 1-2: Timeline of Florida's Seaport Development Milestones Figure 1-3: Total TEUs for All Florida Seaports, FY1992/ FY2014/ Figure 1-4: Total Tonnage for All Florida Seaports, FY1990/ FY2014/ Figure 1-5: Total Revenue Cruise Passengers for All Florida Seaports, FY1990/ FY2014/2015, shown by Multi-Day, Single-Day, and Total Revenue Passengers Figure 2-1: Top Five Seaport States in the United States by Revenue Passengers (2014) Figure 2-2: Top Five U.S. States for TEUs (2014) Figure 2-3: Top Five U.S. States and Florida - Total Tonnage (2014) Figure 2-4: Top Five United States Ports for Automobile Imports and Exports (2014) Figure 2-5: Top Five Seaport States in the United States for Petroleum (2013) Figure 2-6: Types of Florida Seaports Figure 2-7: Revenue Cruise Passengers at Florida s Cruise Seaports FY2014/ Figure 2-8: TEU Counts at Florida s Container Seaports FY2014/ Figure 2-9: Dry Bulk, Liquid Bulk, and Break-Bulk Cargo Comparisons at Florida s Cargo Seaports for FY2014/ Figure 3-1: Import, Export, and Domestic Waterborne Tonnage at Florida Seaports (2015) Figure 3-2: Waterborne Tonnage at Florida Seaports (2010 to 2015) Figure 3-3: Waterborne Container vs. Non-Container Imports and Exports, Figure 3-4: Florida Ports Containers in TEUs (2010 to 2015) Figure 3-5: Annual Total Revenue Cruise Passengers at Florida Seaports (2010 to 2015) Figure 3-6: Strategic Intermodal System (SIS) Seaports, Railroads and Highways and Waterways Figure 3-7: Florida s Future Corridors Initial Study Area Figure 3-8: Florida s Strategic Intermodal System (SIS) Highways Figure 3-9: Florida Department of Transportation Motor Carrier Office Fast Facts Figure 3-10: Florida Freight Rail Network Connections to Florida s Seaports Figure 3-11: U.S. Waterborne Foreign Trade Tonnage (2010 to 2015) Figure 3-12: U.S. Waterborne Foreign Trade Value (2010 to 2015) Figure 3-13: Florida Waterborne International Trade Imports and Exports by Value (2010 to 2015) Figure 3-14: Florida Seaport Waterborne International Trade Imports and Exports by Value (2015) Figure 5-1: Five Year Cumulative Seaport CIPs by Year (FY2015/2016 FY2019/2020) Figure 5-2: Collective Florida Seaport Five-Year Capital Improvement Programs (By Project Category) FY2015/ FY2020/ Figure 5-3: Total FDOT Seaport Work Program by Year from FY2011-FY Figure 5-4: Specific Project Categories in the FDOT Seaport Work Program from FY2015-FY FDOT 2015 Florida Seaport System Plan vi
10
11 1. INTRODUCTION & HISTORY 1.1 INTRODUCTION This chapter provides an overview of the process used to develop this plan and lays a foundation of information from which the remaining chapters of this plan build upon. First, the purpose, organization, resources used, and vision of this plan are presented. Next, major highlights and statistics are provided as a platform to describe Florida s current seaport system, followed by a dive into the history and evolution of the seaport system. 1.2 STATEMENT OF PURPOSE This 2015 Florida Seaport System Plan was prepared in accordance with the statutory requirements of Section (1), Florida Statutes (F.S.). The development of this plan, along with other modal plans developed under the Freight, Logistics, and Passenger Operations (FLP) Office at the Florida Department of Transportation (FDOT), provides FDOT with a cohesive planning process for all the modal offices. Highlights of this plan and the Florida Waterways System Plan are presented in an Executive Summary, illustrating the seaport and waterways conditions, challenges, trends, visions, goals, and areas of focus for the FDOT Seaport and Waterways Office. This plan also provides a look back at the history of the Florida Seaport System and insight into the economic contribution and partnerships which have spurred the dynamic growth of seaport development, waterborne commerce, international trade and the cruise industry in Florida VISION OF THE FLORIDA SEAPORT AND WATERWAY SYSTEM Florida is a Global Gateway. Florida provides world-class facilities and services to enhance domestic and international trade and tourism through partnered investments in waterways, seaport facilities, and intermodal transportation networks. These infrastructure improvements lead to public and private sector investments, new and continued partnerships, job growth and increased efficiency, productivity, and prosperity. Florida s seaports continue to grow as efficient and attractive global gateways for passengers and freight. Florida s cruise ports continually strengthen and expand their leadership role as the largest passenger cruise market in the world. Florida s container ports consistently increase their share of Florida goods moving through competing trade routes. Furthermore, Florida s waterways, seaport system, and intermodal network continue to attract large-scale manufacturing and logistics services, as well as marine commercial and recreational activities to further strengthen and diversify Florida s economy. FDOT 2015 Florida Seaport System Plan 1-1
12 Chapter 1: Introduction & History PLAN OVERVIEW AND APPROACH The plan is organized into six chapters: 1. Introduction & History 2. Florida Seaport System and Individual Seaport Profiles 3. Florida Seaport & Intermodal Freight Systems: Statistics, Trends, and Conditions 4. Seaport and Stakeholder Perspectives 5. Seaport Infrastructure Funding and Investments 6. FDOT Seaport Focus Areas and Strategies to Support Florida Seaports Methods used to prepare this plan included review of past seaport and waterway plans; review of past and current FDOT policy and planning documents; interviews with the leadership and senior staff of each of the seaports; interviews with port tenants and users, maritime related organizations, and other intermodal entities; discussions with the Florida Ports Council (FPC); review of the past 25 years of Florida Seaport Mission Plans; review of seaport strategic master plans; compilation and analysis of trade data and cruise industry information; examination of the FDOT Five-Year Work Program funding; and, research of federal and state freight data and regulations related to the seaport industry RELATED PLANS AND RESOURCES As noted above, a series of plans and studies have contributed to the body of literature supporting this plan update, including: Florida Transportation Plan (FTP) FDOT o Vision and Policy Elements (2015) o Implementation Element (2015) Strategic Intermodal System (SIS), Plan Policy Element (2015) FDOT Seaport Master Plans Individual seaports Seaport Strategic Plans Individual seaports Seaport Capital Improvement Programs and Plans Individual seaports Analysis of Global Opportunities and Challenges for Florida Seaports (2015) FPC for the Florida Seaport Transportation and Economic Development (FSTED) Council Seaport Transportation and Logistics Educational Needs Assessment (2014) FDOT Seaport Mission Plans (1990/1991 through 2015/2016) FSTED Council Florida Freight Mobility and Trade Plan (FMTP) FDOT o Policy (2013) Element o Implementation (2014) Element Trade and Logistics Study, 1.0 (2010) and 2.0 (2013) Florida Chamber Foundation and FDOT Florida s Cruise Industry, A Statewide Perspective (2013) FDOT 2060 Florida Transportation Plan (2010) FDOT Florida s Strategic Intermodal System Strategic Plan (2010) FDOT Florida Seaport System Plan (2010) FDOT Florida Waterway System Plan (2008) FDOT Florida Waterway System Plan (2003) FDOT Florida Seaport System Plan FDOT
13 Chapter 1: Introduction & History 1.3 THE FLORIDA SEAPORT SYSTEM TODAY Florida is home to over 20 million residents and they share the state s resources with nearly 105 million visitors in Continuing to provide the goods, services, and jobs required to sustain this growth and plan for the future presents a tremendous challenge for state leaders, businesses, and communities. Florida s 15 public seaports, shown below in Figure 1-1, are recognized as significant contributors to the dynamic growth of the state s economy and as facilitators of the movement of goods and cruise passengers. Figure 1-1: Florida s 15 Public Seaports 1 Visit Florida, Estimated Visitors 2015, FDOT 2015 Florida Seaport System Plan 1-3

14 Chapter 1: Introduction & History SUCCESS OF THE FLORIDA SEAPORT SYSTEM There are many factors that contribute to the success of the Florida Seaport System. These factors include: Geographical location in the middle of the North-South and East-West trade lanes, Proximity to Caribbean and Mid-Atlantic island markets, A large and growing consumer and visitor population, Length of shoreline on both the Atlantic Ocean and Gulf of Mexico Coasts, The professional management of the seaports and local government boards, Significant state, local, and private sector transportation industry investments on-port and off- port, Environmental stewardship of the ports and their local communities, Favorable business climate, A year-round shipping season, Strategic intermodal system of highways, interstates and Class I railroads connecting the ports, and A financial infrastructure to support the system. Source: JAXPORT Florida Seaport System Plan FDOT

 crossed the docks of Florida s ports utilizing the state s seaport infrastructure, highway and rail networks. Port of Palm Beach 15.")

15 Chapter 1: Introduction & History FLORIDA SEAPORTS BY THE NUMBERS Florida seaports facilitate the flow of over 103 million tons of waterborne commerce, and 15.2 million cruise passengers, supporting over 700,000 jobs throughout the state. 2 Port Canaveral 2015 SEAPORT SYSTEM HIGHLIGHTS 15 public seaports supporting cargo, cruise and other industry sectors. 10 container seaports with service to Mexico and the Caribbean, Central and South America, Africa, Europe, the Middle East, Australia, and Asia. 10 of the top 12 ocean carriers call on Florida ports. 3.5 million TEUs (twenty-foot equivalent units - containers) crossed the docks of Florida s ports utilizing the state s seaport infrastructure, highway and rail networks. Port of Palm Beach million revenue cruise passengers which embarked and disembarked through 7 cruise ports. Home to the 3 busiest cruise ports in the world and the largest passenger cruise market in the world. Carnival, Disney, Royal Caribbean, and Norwegian Cruise Lines are all headquartered in Florida. 3 9 bulk cargo ports, handling 84.7 million tons of dry and liquid bulk cargos. JAXPORT 103 million tons of total cargo including dry bulk such as cement, aggregate, and fertilizers; liquid bulk such as petroleum, fuels, and oils; breakbulk such as lumber, bananas, and steel; general cargo such as motor vehicles; and, project cargo such as generators and containerized cargos. 4 4 Florida ports were listed in the top 10 of fastest growing export ports - Miami and Palm Beach tied for 2 nd, Everglades was 7 th, and JAXPORT was 8 th. 5 Miami is ranked as the fastest growing large U.S. Container Port for all of Source: Photos provided by individual Florida Seaports 2 Florida Ports Council, The Florida System of Seaports, Florida s Cruise Industry, A Statewide Perspective, Statistics from FPC and Individual Seaports. 5 The Journal of Commerce, September 16, 2015, for first half of The Journal of Commerce, May 16, 2016, for laden containers in FDOT 2015 Florida Seaport System Plan 1-5


16 Chapter 1: Introduction & History Source: JAXPORT, Port Manatee, PortMiami, Port of Palm Beach, Port Tampa Bay, Port Canaveral, and FPC Florida Seaport System Plan FDOT


17 Chapter 1: Introduction & History 1.4 A HISTORY OF THE FLORIDA SEAPORT SYSTEM This section provides a closer look at the history of port development in the state, and provides insight into the many challenges, opportunities, visions, and political good fortunes which helped shaped today s seaport system. Individually, Florida seaports have served commerce for most of the state s modern history. Yet, prior to the 1990 s, local government public seaports very rarely interacted with each other or the state of Florida in a cohesive, cooperative manner. Several legislative initiatives served to facilitate a change in port perspectives and prompted ports to meet as the Florida Ports Council (FPC) in the 1970s and 1980s to address state and federal actions which were being imposed upon their local governing bodies. 7 The following sections describe the initial legislation that created the FSTED Program, highlights several of the FSTED and other programs which have shaped the path of success, provide metrics which illustrate the growth of seaport investments and activities from 1990 to 2015, and depict a timeline of important programmatic events and milestones. The important milestones described below illustrate the development of the Florida seaport system. Yet, with all stories there must be a main theme. For the Florida seaports, it has been the individual seaport visions and planning, developing a one-voice consortium through the FSTED Council, gaining access to funding resources, and the partnership with the state of Florida all of which have driven the history of seaport development and more recently began to institutionalize the importance of their existence. Connecting Florida to the global marketplace and creating efficiencies and connectivity at home, through efficient transportation infrastructure and operational expertise, have and will continue to be most important facets of Florida seaports contribution to economic prosperity. The following infographic, Figure 1-2, is a compilation of historic programmatic milestones in Florida s seaport development from the early years through most recent activities. 7 Florida seaports are local governmental entities and are constituted as independent special districts, or dependent special districts of counties or cities, or departments of counties or cities. See Chapter two, the Seaport Governance and Structure section, for additional information. FDOT 2015 Florida Seaport System Plan 1-7


18 Chapter 1: Introduction & History Figure 1-2: Timeline of Florida's Seaport Development Milestones Notes: Port of Key West was established as part of the City of Key West and dates back to 1828 when Florida s Territorial Government incorporated the City of Key West. Other key events that occurred with respect to Florida ports include growth management legislation and the expansion of international and U.S. trade. More detailed information on related topics and events listed above can be found in Appendix B Florida Seaport System Plan FDOT


19 Chapter 1: Introduction & History FDOT 2015 Florida Seaport System Plan 1-9
20 Chapter 1: Introduction & History LAND USE PLANNING The 1975 Florida Local Government Comprehensive Planning Act required all local governments to have comprehensive land use plans. For the first time, all counties and cities were required to prepare plans that addressed the same statewide issues and elements, including water quality. 8 The 1985 Growth Management Act updated the 1975 Act and was based upon the successes and failures of previous years planning efforts experienced by the state and local governments since the adoption of the original planning legislation. 9 One of the major revisions was the requirement that all local government plans and plan amendments be adopted by ordinance and that all plans and amendments must be reviewed and approved by the state. Future Land Use Maps (FLUMs) were to be included with the plans and the effect was to require developers, including the ports, to take into consideration the impact of their projects on the community and the environment. In accordance with Chapter 311, F.S, Florida ports participate in multiple planning efforts. Since 1990, the Florida Department of Economic Opportunity (DEO) and its predecessor, the Florida Department of Community Affairs (DCA), as the state s land planning agency, have had the responsibility as a member of the FSTED Council to review FSTED Program grant applications for consistency with state, regional, and local plans. Each port develops and periodically updates a Seaport Master Plan. Each Master Plan is then incorporated as part of the updates to the appropriate local comprehensive plan(s), which have a review process that follows a local public involvement and state review path. In addition, the ports also prepare a Seaport Strategic Plan with components and planning horizons, which reflect state economic development goals. The participation in these planning efforts allows the ports to respond to the ever-changing, dynamic business opportunities inherent to the maritime industry. ENVIRONMENTAL STEWARDSHIP & EARLY COORDINATION Ports became the focus of water quality concerns and issues as they needed to perform maintenance dredging and new construction dredging. On the federal level, the Clean Water Act was amended in the 1970s and again in In 1986, the Port Trust Fund was established by law and funded by the interest earnings above the statutorily-mandated cap on the funds collected on barrels of imported petroleum product and placed in the Florida Coastal Protection Trust Fund. 10 The purpose was to provide 50/50 matching funds for requirements imposed by the Department of Natural Resources on a port as a condition of a permit or other form of approval; or for environmental mitigation required by a state, federal or local environmental permit; or for the acquisition of or improvements to existing or future dredged material sites. 11 Approximately $1 million was allocated over the life of the funded program. Environmental stewardship became an important guiding principle which ports have maintained and imbedded in their missions. This early unified effort, led the two major ports, PortMiami and Port Everglades, allowed the ports to reevaluate their competitive issues and review their balance sheets. Along with other ports, both ports had limited options remaining for assuming additional debt to expand their facilities and grow their market share. 8 Chapter , Laws of Fla. (1975). 9 Chapter 85-55, Laws of Fla. (1985). 10 Chapter , Laws of Fla. (1986), created Section (i), F.S. 11 Now the Department of Environmental Protection Florida Seaport System Plan FDOT
21 Chapter 1: Introduction & History PortMiami was experiencing growing opportunities with the cruise industry and Port Everglades was looking beyond petroleum as a major source of revenue to developing additional cargo facilities. Other ports like Port Canaveral, Port Tampa Bay, and JAXPORT were also looking for expansion opportunities. FLORIDA SEAPORT TRANSPORTATION AND ECONOMIC DEVELOPMENT (FSTED) PROGRAM In late 1989, 12 seaports joined together in recognition of a common purpose to further the economic and social goals of the state of Florida and the nation. 12 For the first time, as a group, these seaports asked the state of Florida to: Acknowledge their unique role as statewide economic generators; and, Provide a dedicated revenue source for the essential but costly port expansion projects needed to maintain and grow Florida s competitive position in the global marketplace. The result was the 1990 creation of the FSTED Program within FDOT, through Chapter 311, F.S. Each year, $8 million was to be allocated from the State Transportation Trust Fund (STTF) to the seaports through the FSTED Program on a 50/50 matching basis. 13,14 At the same time, the FSTED Council, comprised of the 12 seaport directors or their designees and the Secretaries of the Florida Departments of Commerce, Community Affairs, and Transportation, or their designees, was created and served to identify port transportation and infrastructure projects meeting statutorily eligibility and agency review requirements. 15 Chapter 311 recognized that long-term port planning was essential in making sustainable investments and required each seaport to develop a comprehensive Seaport Master Plan which would be incorporated into the appropriate local government s comprehensive plan pursuant to Section (2)(k), F.S., in order to obtain any FSTED Program funding. A legislative appropriation of $10,000 per port was provided to assist each port in preparing the required plans. 16 The 25-years of Seaport Mission Plans provide a record of opportunities, challenges, and achievements of the Florida Seaport System. To guide the investment partnership with the state, the FSTED Council was to prepare annually a Five-Year Florida Seaport Mission Plan defining the goals and objectives of the Council concerning the development of port facilities and an intermodal transportation system consistent with the goals of the Florida Transportation Plan (FTP). 17 The Seaport Mission Plan (Mission Plan) was to be provided annually to the President of the Senate, Speaker of the House of Representatives, FDOTm and the state s land planning agency, at the time, the Department of Community Affairs (DCA), and now the Department of Economic Opportunity (DEO), to provide benchmarks, investment strategies, challenges, and opportunities. 12 A Five-Year Plan to Accomplish the Mission of Florida s Seaports (1990), for fiscal years 1990/91 through 1994/95. Port Canaveral, Port Everglades, Port of Fort Pierce, Port of Jacksonville, Port Manatee, Port of Miami, Port of Palm Beach, Port Panama City, Port of Pensacola, Port of Port St. Joe, Port of St. Petersburg, and Port of Tampa. Note: The Ports of Key West and Fernandina were added in 1994, and Port Citrus was added in 2011, with conditional membership. 13 Chapter , Laws of Fla. (1990). 14 In 1994, Section , F.S., was amended to read that a minimum of $8M shall be made available for FSTED Program funding. This provided the authorization for FDOT to increase funding for FSTED projects, if supplemental funds were available and identified projects were a priority. 15 Commerce and Community Affairs were dissolved and their functions rest now with the Florida Department of Economic Opportunity. 16 This was a onetime discretionary fund allocation provided by Department of Community Affairs (DCA). 17 Section (3), F.S. (2015). FDOT 2015 Florida Seaport System Plan 1-11
22 Chapter 1: Introduction & History The Mission Plan would include specific recommendations for the construction of transportation facilities connecting any port to another transportation mode and for the efficient, cost-effective development of transportation facilities or port facilities for the purpose of enhancing trade, promoting cargo flow, increasing cruise passenger movements, increasing port revenues, and providing economic benefits to the state. Beginning with the first publication of A Five-Year Plan to Accomplish the Mission of Florida s Seaports 1990/ /95 and for the next 25 years, the seaports have: Outlined their goals and objectives, Provided strategies to grow international trade, Highlighted opportunities and challenges on-port, off-port, landside and waterside, Listed and prioritized infrastructure needs, and, Documented each port s contribution to the economic prosperity of the state. 18 Additional factors impacted the development of Florida seaports. The phenomenal growth in the state s population created a significant market of consumers needing food, shelter, and manufactured goods. Strong cultural ties and the nearness to growing markets in the Caribbean Basin and Central and South America supported enhanced trade opportunities. More than 1,350 miles of coastline offered each of the ports different geographic opportunities and commodity mixes to pursue. Florida agricultural products and phosphate resources offered export opportunities. The growing containerization of cargo into Twenty-Foot Equivalent Units (TEUs) for more uniform transporting supported the diversification of port business lines. Favorable weather, airport capacity expansion, and the proximity to desirable destinations made PortMiami, Port Everglades, and Port Canaveral the top three cruise ports in the world. 19 The airports, highways, and railroads supported the intermodal movement of goods and passengers. In addition, the hospitality services and financial industries expanded to support the tourism and trade industries. The creation of the FSTED Program in 1990 unified the ports, began to focus the state on the economic impact and diversity of the seaports, and established a funding platform which continues to evolve. In 1994, the ports of Fernandina and Key West were added to Section , F.S., as members of the FSTED Council, and once each of these ports conformed with statutory requirements, they became eligible for allocation of FSTED Program funds. 20 As discussed in the early Mission Plans, three specific issues became apparent: The need for lump sum investment in on-port equipment and facilities in amounts much larger than the annual $8 million funding, The need for flexibility to respond to business opportunities; and, The need to address the increasing congestion and lack of connectivity between the seaports and the air, highway, and rail networks. 18 The Seaport Mission Plans can be found here: 19 Throughout the years, these three cruise ports have swapped first, second, and third positions. 20 Chapter , Laws of Fla. (1994) Florida Seaport System Plan FDOT

23 Chapter 1: Introduction & History As described below, these issues have been addressed through three bond issuances, Legislative funding increases in 2012 and 2016, and a series of intermodal initiatives. A major milestone in the history of the development of Florida s seaport system is the story of how ports partnered with the Legislature, the Governor, state agencies, and the private sector to develop on-port, offport, and intermodal projects, and connectivity to the air, rail, and highway networks. The FSTED Program is inextricably tied to the success of the ports and served as a critical financial catalyst which enabled the ports to build terminals and facilities, deepen channels and harbors, purchase cranes and equipment, address environmental and security concerns, acquire trade data and analysis, and reach to the corners of the globe drawing business opportunities to Florida. FLORIDA PORTS FINANCING COMMISSION ISSUES INFRASTRUCTURE BONDS FOR SEAPORTS In 1996, Florida Governor Lawton Chiles and the Legislature authorized the seaports to create, by interlocal agreement, a financing entity to issue infrastructure bonds. 21,22 The Florida Ports Financing Commission (FPFC) was established and authorized to issue debt for which the state would provide $15 million a year from the STTF for debt service for 30-year bonds to fund seaport infrastructure development. The rationale was that this long term commitment would be more than offset by the increase in state and local taxes, job growth, and economic impact generated from the new construction and port expansion. In December 1996, $ million in Florida Ports Financing Commission Revenue Bonds (State Transportation Trust Fund), Series 1996, were issued. The ports provided a 50% match to these funds. Port Panama City Source: Panama City Port Authority, 2015 During this period of time, landside access was becoming a critical issue, as was the increasing cost and regulatory process of harbor deepening and maintenance dredging. 21 Section , F.S. (2015). 22 Section (3), F.S. (2015). FDOT 2015 Florida Seaport System Plan 1-13

24 Chapter 1: Introduction & History In the mid-1990s, the seaports, in partnership with the FDOT, various consultants, and the FSTED Council, engaged in a Landside Access Study, which depicted off-port bottlenecks and transportation connectivity issues identified by the seaports. 23,24 In 1997, a second infrastructure bond issue was authorized to address the on-port and off-port intermodal access issues, and $10 million was committed by FDOT from the STTF for debt service beginning in In 1999, the Legislature amended Section (4), F.S., and moved the beginning date of the 30-year financial commitment to The ports were to provide a 50% or 25% match depending on the type of project funded. In October 1999, $150 million in Florida Ports Financing Commission Revenue Bonds (State Transportation Trust Fund), Series 1999, were issued. The nearly $750 million of infrastructure built with the proceeds from these two bond issues when matched by the ports catapulted Florida s seaports into the 21 st century of global trade and tourism. In 2011, both of the above bond issues were eligible to be refinanced to reduce the interest on the debt service which in-turn produced significant savings to the FDOT s bond repayment. These savings were approximately $5 million, allocated by FSTED to eligible seaport infrastructure projects. 26 SEAPORT ENVIRONMENTAL MANAGEMENT COMMITTEE The Seaport Environmental Management Committee (SEMC) was created in 1996 as a formal committee under the direction of the FSTED Council. 27 The SEMC provided a forum for ports to discuss and better understand federal, state, and local regulatory issues related to permit compliance. Environmental issues including maintenance dredging and dredgedmaterial management; environmental mitigation; air Source: Visit Florida, 2015 and water quality permitting; and, the maintenance of navigation channels, port harbors, turning basins, harbor berths, and associated facilities formed the topics of discussion. Membership included the Secretary of the Department of Environmental Protection (DEP); a designee from the United States Army Corps of Engineers (USACE); a designee from the Florida Inland Navigation District (FIND); the Executive Director of DEO, or their designees, as ex officio, nonvoting members; and, five or more port directors, as voting members, appointed to the Committee by the chair of the FSTED Council, who also would designate one voting member as Committee chair Strategic Investment Plan to Implement the Intermodal Access Needs of Florida s Seaports (Landside Access Study), prepared for the FDOT and the FSTED Council by PBS&J and J.D. Sanchez Consulting, Inc., March 1998, as amended in June and October Chapter , Laws of Fla. (1997), added seaport intermodal access projects identified in the Five-Year Seaport Mission Plan as eligible projects for FSTED Program funds. 25 Section (4), F.S. (2015). 26 FPFC Refunding of Series 1996 Bonds, Refunding Revenue Bonds (State Transportation Trust Fund), Series 2011A & B; FPFC Refunding of Series 1999 Bonds, Refunding Revenue Bonds (State Transportation Trust Fund) Intermodal Programs, Series A & B. 27 Section , F.S. (2015). 28 Department of Community Affairs (DCA) transitioned to become Department of Economic Opportunity (DEO) in fall Florida Seaport System Plan FDOT

25 Chapter 1: Introduction & History This Committee continues today as constituted on the previous page. As previously noted, environmental stewardship is one of the guiding principles in which ports have imbedded into their missions. The SEMC and its partnerships, especially with the USACE and DEP, has encouraged dialog and coordination amongst entities which often have differing responsibilities and perspectives. The SEMC has been a catalyst for proposing solutions, both administrative and legislative, for environmental compliance issues, problems, and concerns. ACQUISITION OF TRADE DATA AND ANALYSIS In 1994, the Legislature authorized the use of FSTED Program funds for the acquisition of economic benefit and trade data information in Section (3)(a), F.S. This Section has been modified many times over the years, but current language continues to reflect the connection between understanding trade flows, conditions, and trends and strategic planning, business development, and wise, prudent investments in infrastructure and equipment. SEAPORT SECURITY The number one mission of port management is protection of the physical assets and cargo at a seaport, along with the responsibility to provide a safe and secure facility for the personnel working at a port and the crew and passengers of the ships which sail in and out of their harbors. The role which seaport security has played in port development since the mid-90s cannot be understated. However, the strong focus on security has sometimes created rules and regulations that make efficiency and productivity more difficult. New, Source: JAXPORT, 2016 costly and often duplicative planning, implementation, and enforcement processes sometimes put federal and state laws and regulators at odds; and, placed port management squarely in the center of a law enforcement responsibility. Learning how to balance the protection and security of the public domain with the demands of efficiently providing for the movement of freight and passengers became an everyday challenge. The Florida Legislature created Section , F.S., in 2000, requiring individual seaports to begin credentialing all port workers, developing security planning documents, working to develop an assessment of seaport security risks based upon a recently completed statewide security assessment, and identifying costs and funding mechanisms. This prompted the FSTED Council to establish a Seaport Security Advisory Committee to focus collective expertise on security issues and to review the implementation of security legislation. 29 After the terrorists attacks of September 11, 2001, Florida s seaports took national prominence and a leadership role because of the previous statutory requirements, practices, assessments, plans, and domain awareness programs in place or already underway. 29 Developed in 2000 and was an informal committee created by FSTED to discuss security issues directly impacting Florida Seaports. In 2016, the Florida Legislature passed HB7061 which statutorily created the Seaport Security Advisory Committee and Security Grant Program, by amending Section , F.S., FSTED program. FDOT 2015 Florida Seaport System Plan 1-15
26 Chapter 1: Introduction & History Activities shifted from prevention of illicit drug smuggling, money laundering, and cargo theft to prevention of anti-terrorism activities and the protection of the cruise industry and movements of hazardous materials. Seaports ensured the presence of additional law enforcement personnel and identified additional access control/security infrastructure and technology requirements. In 2002, the Transportation Security Administration (TSA) of the U.S. Department of Homeland Security (DHS) issued the first round of competitive federal seaport security grants for the newly created Port Security Grant Program. 30 Due to the groundwork laid by the seaports, port users, security professionals, and state partners, Florida seaports successfully garnered 21%, or $19.1 million in funding during the first year of the grant program. For the next several years, and until the rest of the nation s seaports gained experience and completed security risk assessments and plans, Florida continued to fare well in obtaining federal funding. Florida s predominance in the cruise industry also focused attention on the potential risk to passengers and vessels of a terrorist attack and elevated the security needs of those ports, as well as strategic military deployment ports. Investment in seaports reflected this enhanced focus on seaport security, effectively postponing other seaport infrastructure development by diverting funding to security projects. The 2002 Legislature revised the FSTED Program eligibility requirements to include seaport security operational and infrastructure projects. 31 The legislation contained a sunset clause deleting this eligibility as of June 30, 2004, which was later modified to June 30, More than $60 million of seaport FPFC bond proceeds and FSTED Program money moved to security initiatives to augment funds provided by the ports themselves. In response to 9/11, the United States Congress enacted the Maritime Transportation Security Act (MTSA) of 2002, (which has been amended over the years) casting an extensive federal regulatory fabric over seaports and the international movement of goods and passengers. As federal agencies such as the U.S. Coast Guard in their role as Captain of the Port, DHS Customs and Border Protection, DHS Immigration and Customs Enforcement, the U.S. DOT Maritime Administration, and many other federal partners elevated their expertise and readiness, it was difficult to manage the duality of both federal and Florida state laws governing seaport security policies, procedures, plans, and requirements. Florida became the only state in the nation with specific security laws aimed at the 14 public seaports and this situation created competitive issues with other states. Maritime terminals located in another state, even adjacent to or near a Florida seaport were governed only by the MTSA (and other federal rules, etc.), yet those terminals and facilities located inside a Florida port operated under both sets of rules; and this situation often created duplicative, and often conflicting, requirements and costs. Florida also required the development of a Florida Uniform Port Access Credential (FUPAC) for all seaport users needing unescorted access to restricted areas of the ports as defined in their security plans. This conflicted with and potentially duplicated the federal Transportation Worker Identification Credential (TWIC) implementation, which is in place today. 30 The Federal Port Security Grant Program has been modified numerous times with varying levels of funding over the years. See for more information. 31 Chapter , Laws of Fla. (2002). 32 Chapter , Laws of Fla. (2004) Florida Seaport System Plan FDOT
27 Chapter 1: Introduction & History During the 2000s decade, the security provisions of Chapter 311 were amended many times. A very strained and contentious atmosphere permeated the decade, often pitting seaport economic development strategies against a range of security scenarios. Striking a balance between commerce and security proved challenging to achieve for most ports. In 2007, Florida realized that the states of Georgia and South Carolina were heavily investing in their port systems and putting Florida at a competitive disadvantage. Leaders in the Florida Senate proposed replacing the $60 million shifted to security measures and projects with either a new bond program with debt service pledged similar to the previous two bond issues or a direct appropriation from the state s General Revenue Fund. The result was $50 million in non-recurring funds allocated to the seaports from the General Revenue Fund to be allocated and distributed in the same manner as the FSTED Program funds. This capital influx, when matched by strong seaport investments, allowed the ports to refocus their efforts. As a result, JAXPORT, one of the beneficiaries of those funds, was able to develop the Dames Point Marine Terminal and become a major conduit for Asian trade. In 2011, the passage of HB 283 (Chapter ) repealed the duplicative security provisions and supported the uniform efforts of the federal agencies and their guiding regulations. Each seaport still must have a security plan approved by the U.S. Coast Guard in place with ongoing review and assessments. A safe and secure environment is a central focus of every seaport, and a more cost-efficient, balanced, harmonized security process now exists. In 2016, the Florida Legislature created a new Seaport Security Advisory Committee and Seaport Security Grant Program within the FSTED program. DEVELOPMENT OF A COLLABORATIVE INVESTMENT STRUCTURE Authorization of FDOT s Strategic Intermodal System (SIS) funding allocations began in 2004, with $100 million for FY2004/2005 to be used for intermodal projects across the state. Over the ensuing years, FDOT SIS funds have become a significant resource for seaport development and a primary tool for enhancing intermodal connectivity. 33 In addition, SIS Growth Management funds have also been instrumental in providing funds for seaport projects. 34 Funding resources are more fully explored in Chapter five. FDOT s Seaport Office was formed in Yet, the FSTED Council and FPC remained the primary forums for leadership on seaport issues. In 2010, a more direct working relationship between FDOT and Florida's seaports was forged as FDOT established an increased focus on Florida s broader intermodal transportation systems. With the development of the 2010 Florida Seaport System Plan, staff were able to more widely collaborate in an information exchange. Seaport staff identified challenges, needs and opportunities and FDOT was able to identify available resources and solutions. Between 2010 and 2015, FDOT and seaport staff continued to develop strong working relationships. When examining the timeline depicted in the beginning of this Chapter, along with a more the detailed history of the Florida seaport system included in Appendix B, the past five years have seen an exponential raise in the discussion of the future of Florida s economy and the role and needs of the state s seaports to generate good-paying jobs, to create valueadded movements of cargo and cruise passengers, and to enhance a more-balanced flow of imports and exports. Freight mobility and telling the freight story have become a coordinated effort of both the state of Florida and its seaports. 33 See Chapter three for a more detailed exploration of FDOT s SIS program. FDOT 2015 Florida Seaport System Plan 1-17

, and in FY2013/2014, the Seaport Investment Bond Program allocated $150 million in bond proceeds to 14 Florida port projects.")
28 Chapter 1: Introduction & History During the same period, Florida s Governor, Rick Scott, and the Legislature proactively allocated PortMiami an additional $55.8 million in SIS funds to deepen the port s channel and harbor, in preparation for the expansion of the Panama Canal, bringing the state s total funding on that project to $108 million. 34 Three more very important resources were added to the state s investment toolkit: in 2012, a minimum threshold requirement was established which guarantees an annual $35 million of SIS funds to Strategic Port Investment Initiatives (SPII), and in FY2013/2014, the Seaport Investment Bond Program allocated $150 million in bond proceeds to 14 Florida port projects. In 2016, the Legislature increased the minimum annual FSTED program funding by $10 million to $25 million. These initiatives have solidified the current funding base for growing the Florida seaport system to a minimum of $60 million in annual seaport project funding. In addition to history presented above, there are several other programs established and policy decisions made throughout the years which have supported and enhanced the development of the Florida seaport system. These programs and decisions are outlined below. SEAPORT EMPLOYMENT AND TRAINING PROGRAMS Recognizing the need to have a skilled workforce available to perform jobs in the growing maritime industry, Chapter 311 was amended in 1992 to create the Seaport Employment and Training Program (STEP). 35 This grant program was administered through the Florida Department of Commerce and provided matching funds to the seaports on a 50/50 matching basis. 36 Contributions from the seaports and the private sector included in-kind services such as training instructors, equipment usage, and training Source: JAXPORT, 2016 facilities, as well as direct matching funds. The STEP training program was amended in 1997, with clarification of program goals by the Legislature, by requiring that the successor to the Department of Commerce, the Governor s Office of Tourism, Trade, and Economic Development (OTTED), shall grant funds appropriated by the Legislature to the program for the purpose of stimulating and supporting seaport training and employment programs which would seek to match state and local training programs with identified job skills associated with employment opportunities in the port, maritime, and transportation industries, and for the purpose of providing such other training, educational, and information services as required to stimulate jobs in these industries. 37 After 1992, JAXPORT developed a STEP training awareness program. Grant funds, coupled with seaport and local funds, were used to convert a shipping container into a traveling exhibit with maritime-related educational materials. 34 PortMiami s allocation was approved for allocation in FY2011/ Section , F.S. Note: Program was called STEP even though name would suggest SETP. 36 Reorganized in 2011, now duties are managed through a partnership between DEO and Enterprise Florida (EFI). 37 Section , F.S., Seaport Employment Training Grant Program Florida Seaport System Plan FDOT
29 Chapter 1: Introduction & History This container visited high schools, job fairs, and community events, predominately in the northeast Florida region, but also around the state, to educate a potential workforce about the job opportunities and salaries available in the maritime and transportation industries. Under Governor Jeb Bush s administration, all workforce training programs were consolidated under OTTED, and no additional funding for the program has been allocated. In Section (3), the FSTED Council is tasked with developing training programs, based on an examination of existing programs in Florida and other states, for the training of minorities and secondary school students in job skills associated with employment opportunities in the maritime industry, and reporting on progress and recommendations for further action to the President of the Senate and the Speaker of the House of Representatives annually. There has been no funding provided for this program to date. SMALL COUNTY DREDGING PROGRAM In 2005, the Legislature passed legislation in three different bills which required the FSTED Council to establish a program later named the Small County Dredging Program to fund dredging programs in counties having a population of fewer than 300,000 residents. 38,39 The funds could be used for the dredging or deepening of channels, turning basins, or harbors on a 50/50 matching basis (later modified to a 25/75 matching basis) with any port authority meeting eligibility requirements. The FSTED Council was instructed to adopt rules and an administrative review process similar to the FSTED Program project review process, but which also included a review for consistency by DCA, FDOT, and OTTED. These rules are now part of the Florida Administrative Code. 40 Three small counties utilized this program. Hernando County dredged an access channel to the Gulf of Mexico for their commercial fishing fleet; St. Lucie County dredged Taylor Creek to benefit the Port of Ft. Pierce; and, Gulf County dredged an area to benefit the Port of Port St. Joe. Future funding for this program is dependent on state appropriations. ADDITIONAL PROGRAM ELEMENTS A key provision of the FSTED Program s original enabling legislation required the ports to provide a 50% match in order to receive FSTED Program funds. The purpose was to ensure that a local commitment was made to develop a project and that the state funds were used wisely. As the years ensued, maintenance and rehabilitation projects were put on the back burner in favor of those with the greatest return on investment (ROI). In 2010, Chapter 311 was amended to lower the match to a 25% match for the seaport projects which involve the rehabilitation of wharves, docks, berths, bulkheads, or similar structure to address the aging infrastructure at all ports. The 1999 bond issue had permitted this reduced match, and this amendment to Chapter 311 steered ports back to shoring up deteriorating infrastructure, aiming to protect seaport and state investments. In addition, for those seaports located in areas designated by the state as Rural Areas of Opportunity, the match was waived in FY2012/ Chapters , 261, and 281, Laws of Fla. (2005). 39 Section , F.S., Population thresholds for eligibility are determined by the most recent official census. 40 Small County Dredging Program, FAC 14b For more information on Rural Areas of Opportunity (RAO), please visit DEO s programmatic website. FDOT 2015 Florida Seaport System Plan 1-19

30 Chapter 1: Introduction & History The 15 seaports differ in size, revenues, governing structure, and ability to engage in economic opportunities within their local communities. In all instances, they are viewed as local and regional economic engines. In 2000, it was recognized that if a definition of a seaport project could be expanded to include those economic development projects allowable for financing in Chapter 315, the Port Facilities Financing Chapter, ports could utilize a more expansive list of eligible projects in which to engage. Chapter 311 was amended to permit those ports with less than $5 million in annual revenues to develop projects which were defined in Chapter The Port of St. Petersburg currently is using this FSTED Program funding provision to develop facilities for marine and scientific research vessels to access the University of South Florida marine research complex. Providing services to mega-yachts is also an element of the Port s business plan. HISTORICAL METRICS The three most common metrics cited describing the progress of port development and the economic contribution they make to the national and state economies are the number of twenty-foot equivalent units, or TEUs, traversing the port docks; tonnage moved; and the number of revenue cruise passengers embarking and disembarking from cruise ships. The following three Figures, 1-3, 1-4, and 1-5, depict these measurements for Florida ports. Source: Port Tampa Bay, Delivery of New Post Panamax Gantry Cranes, Projects defined in Chapter 315 may include public landings, markets, public buildings and plazas, bridges, tunnels, roads, and causeways (Section (6), F.S.), provided that such projects create economic development opportunities, capital improvements, and positive financial returns to the specific port. Parks and recreational facilities are specifically excluded from receiving FSTED Program funds pursuant to Section (3)(b)(10), F.S Florida Seaport System Plan FDOT
31 Chapter 1: Introduction & History CONTAINERS AND TEUS In his book, The BOX, Marc Levinson chronicles the revolutionary development of containerized cargo, which began in 1956 when a retrofitted oil tanker carried 58 shipping containers from Newark, New Jersey to Houston, Texas. The transportation of cargo around the globe in a standard-sized form simplified onboard ship handling, dockside loading and unloading, equipment, terminal storage and stacking, truck and rail carriage, and distribution systems. Container sizes and types have changed and grown over the years from 20 feet long to 40 feet, to 45 feet, to 48 feet, with now full length 53 feet long containers. A twentyfoot long container still remains the industry standard to quantify containers. A twenty-foot equivalent unit or TEU represents a single measurement of 20 feet which is then coupled with a multiplier based upon the actual length of the container. Newer container types include reefer (insulated and refrigerated), tank containers for liquid bulk, open top or hoppers for dry bulk, and flat bed for miscellaneous goods like lumber or automobiles. The introduction of these additional types of containers has been a contributor to the growth in containerization. The Florida ports handled very few containers 25 or so years ago, and only began tracking the movement of containers in FY1992/1993, when a total of 867,013 TEUs were reportedly handled by PortMiami, Port Everglades, JAXPORT, and the Port of Palm Beach. 43 A steady growth in containers reflected the landside improvements made to terminals, equipment, and landside road and rail connections supported by the state/seaport financing partnership. From FY1996/1997 through FY2002/2003, total Florida TEUs hovered around 2.5 million, annually. From FY2003/2004 through FY2007/2008, total Florida TEUs ranged from 2.6 million to almost 2.9 million, annually. A dip in FY2008/2009 reflects the great recession and its impact on trade and the consuming public. From FY2010/2011, TEUs continue to climb to a record 3.54 million TEUs in FY2014/2015, with Port Everglades, JAXPORT, and PortMiami handling over 1 million TEUs each. The overall growth in TEUs from FY1992/1993 through FY2014/2015 is over 300%. 4,000,000 3,500,000 3,000,000 2,500,000 Figure 1-3: Total TEUs for All Florida Seaports, FY1992/ FY2014/2015 TEUs 2,000,000 1,500,000 1,000, ,000 0 Source: Data compiled from Florida Seaport Mission Plans, FSTED Council, A Five-Year Plan to Accomplish the Mission of Florida s Seaports, 1993/ /1998. FDOT 2015 Florida Seaport System Plan 1-21

32 Chapter 1: Introduction & History TONNAGE Other methods of transporting cargo include: dry bulk such as cement, aggregate, and fertilizers; liquid bulk such as petroleum, fuels, and oils; breakbulk such as lumber, bananas, steel; and, general cargo such as motor vehicles and project cargo such as generators. Tonnage volumes and sometimes units measure these types of cargos. Florida ports, especially Port Tampa Bay, Port Everglades, and JAXPORT, handled a record million tons of Source: Port Everglades, Chiquita containers, 2016 cargo in FY2005/2006. Fairly steady growth up to that point once again reflects the investments made in port infrastructure. Volumes declined in the economic downturn, leveling out at about 98.7 million tons. Several factors appear to contribute to these numbers. The major hurricanes that hit Florida in 2004 and 2005 required construction materials shipped in bulk, such as lumber, steel, and cement to repair the significant damages. The great recession followed, depressing the housing market, especially new construction. As noted above, the continued utilization of containers in which to ship cargo has altered the manner in which bulk goods are being shipped. Cargo such as bananas which usually were shipped as bulk are beginning to come as imports in containers. This factor does contribute to an increase in container use and an observed decrease in other tonnage. 140,000,000 Figure 1-4: Total Tonnage for All Florida Seaports, FY1990/ FY2014/ ,000, ,000,000 Tons 80,000,000 60,000,000 40,000,000 20,000,000 0 Source: Data compiled from Florida Seaport Mission Plans, Both TEUs and tonnage will be further discussed in Chapters two and three Florida Seaport System Plan FDOT
33 Chapter 1: Introduction & History CRUISE PASSENGERS As noted, PortMiami, Port Everglades, and Port Canaveral are the three busiest cruise ports in the world, contributing significantly to the state s economic growth and tourism industry. In FY1990/1991, 3.96 million passengers came in and out of Florida s cruise ports, sailing on multi-day cruises. Another 2.51 million passengers traveled in and out of Florida s ports on one-day cruises, often to the Bahamas or on Cruises-to- Nowhere which sailed into international waters where casino gaming onboard was not regulated by the U.S. or Florida governments. A steady growth in multi-day cruising has continued to the present even through the great recession of In FY2014/2015, 15.2 million passengers sailed in and out of Florida s ports. The single-day cruise market saw a steady decline from 2004 to 2010, then leveled-off. The FY2014/2015 one-day cruise total was 500,406 passengers, down dramatically from the almost 4 million in FY2004/2005. One-day cruises, largely based on gambling entertainment, have seen strong competition from land-based venues in the southeast Florida market, such as the Hard Rock Café which offers gaming on the Seminole Indian Reservation in Broward County, Florida. As a result of this competition, the share of the market taken by one-day cruises has declined. The cumulative total for both multi-day and one-day revenue cruise passengers coming in and out of Florida ports from FY1990/1991 through FY2014/2015 is 289,482,390 revenue passengers. Chapter three includes a discussion of the positive impact of the cruise industry on Florida s economy. Figure 1-5: Total Revenue Cruise Passengers for All Florida Seaports, FY1990/ FY2014/2015, shown by Multi-Day, Single-Day, and Total Revenue Passengers 18,000,000 16,000,000 14,000,000 Revenue Passengers 12,000,000 10,000,000 8,000,000 6,000,000 4,000,000 2,000,000 0 Multi Day Single Day Total Source: Data compiled from Florida Seaport Mission Plans, FDOT 2015 Florida Seaport System Plan 1-23

34 Chapter 1: Introduction & History 1.5 CONCLUSION This chapter focused on the history of Florida s seaport system. The previous pages discuss many milestones and key activities that contributed to the development of Florida s seaports as a statewide system. To summarize and augment this discussion, a timeline was provided to illustrate the evolution of Florida s seaports from 1900 to This timeline fills in many of the more notable programmatic events which have shaped the progression of the ports. In Chapter two, profiles are provided for each of the 15 public Florida seaports. Additionally, the Chapter will highlight the specific metrics of revenue cruise passengers, containers, and bulk cargo by port; as well as offer a status report of where Florida ranks in comparison with other states in trade and cruise passengers. Source: Port of Key West, Florida Seaport System Plan FDOT
35 ` 2. SEAPORT SYSTEM AND INDIVIDUAL SEAPORT PROFILES 2.1 INTRODUCTION TO THE FLORIDA SEAPORT SYSTEM Florida s 15 public seaports are huge economic drivers for the state. As a system, Florida s seaports contribute nearly $100 billion to the state s economy and support 700,000 jobs throughout the state. 1 They each are unique with a wide range of cargo crossing their docks, including automobiles, steel, petroleum, copper, cement, lumber, paper, furniture, computer technology and electronics, and fresh fruit and produce products. Currently, the world s top three busiest cruise ports are in Florida. Each seaport is different, varying in size, location, and capability; however, collectively, all 15 seaports significantly enhance the state s economy by facilitating the movement of people and freight in an efficient and secure manner. They serve as a network of transportation hubs, linking Florida to the markets across the globe. Florida is poised for future growth in waterborne trade and commerce, with a unique geography, growing population of over 20 million people, a huge visitor population, and well-developed transportation infrastructure. 2 These statewide trends, coupled with the recent opening of the expanded Panama Canal in 2016; the completion of both PortMiami s deep dredge to 50 feet and the Miami Access Tunnel; the development of the Intermodal Container Transfer Facilities (ICTF) at Port Everglades and JAXPORT; and, construction of major interstate and connector projects, all point to the fact that the FDOT and the state s seaports are preparing for growth. Table 2-1 is an annual summary showing all of the major seaport volume metrics for Florida seaports from 2010 to 2015, including containers, tonnage, international trade by direction, and cruise passenger data. It provides an overarching view of the state of Florida s seaports from 2010 to The Florida Ports Council, The Florida System of Seaports, Visit Florida, 2015, FDOT 2015 Florida Seaport System Plan 2-1

36 Chapter 2: Seaport System and Individual Seaport Profiles Table 2-1: Summary of Florida Seaport Containers, Tonnage, Trade Direction, and Passengers TEUs Total TEU's 2,844,224 3,025,356 3,094,445 3,215,701 3,343,194 3,541,526 TONNAGE Total Tons 106,361, ,300, ,637,049 99,414,541 98,741, ,012,059 IMPORT, EXPORT, AND DOMESTIC TONNAGE Imports 39,604,650 35,932,270 37,336,914 36,376,367 36,594,914 40,458,288 Exports 18,581,630 19,796,557 20,143,671 19,539,122 18,656,294 18,989,078 Domestic 47,817,210 44,224,029 43,156,464 43,499,053 43,498,295 43,564,694 Total 106,003,490 99,952, ,637,049 99,414,541 98,749, ,012,060 PASSENGERS Multi Day 12,328,196 13,171,199 13,763,532 13,654,048 14,922,455 14,745,913 Single Day 682, , , , , ,406 Total 13,010,477 13,659,229 14,148,238 14,070,396 15,551,339 15,246,319 Note: Cruise counts are revenue passengers including embarkations and disembarkations. Values represented in current year U.S. dollars. Source: Individual Florida Seaports, FSTED Council Five-Year Seaport Mission Plans, and U.S. Census Bureau, Foreign Trade Division, 2015 As a system, Florida s seaports contribute nearly $100 billion to the state s economy and support 700,000 jobs throughout the state. The following sections will explore the governance and structure of each seaport; highlight the specific metrics of revenue cruise passengers, containers, and bulk cargo by port; offer a status report of where Florida ranks in comparison with other states in trade and cruise standings; and provide an overview of each seaport in a Seaport Profile. Port Canaveral Welcomes a new Cruise Ship in 2016, the Carnival Magic Source: Canaveral Port Autority, Florida Seaport System Plan FDOT

37 Chapter 2: Seaport System and Individual Seaport Profiles 2.2 SEAPORT GOVERNANCE AND STRUCTURE Across the globe, seaport governance and operational structure take on a multitude of models and forms reflecting a variety of political, historic, and geographical considerations. In an effort to better understand what might be the most effective governance model and operational structure to maximize seaport costs and efficiencies, Florida TaxWatch and the Florida Ports Council (FPC) engaged in a joint study: Seaport Governance Models, How Florida s Seaports Compare to U.S. and International Models. The study reviewed U.S. and European ports, concluding that no one governance model or operational structure provided a clear and commanding superiority over other models and structures. 3 The models included multi-port and single-port governance models and operational structure, and also compared Florida with California, Louisiana, and Texas, noting great similarities in outcomes. In Florida, the governance of the 15 public seaports falls into the following categories: An independent special district with an elected or appointed board 4 A dependent special district of a city or county with an elected board 5 A department of county government under the mayor or administrator of the county A department of city government under the mayor or administrator of the city The seaport governing boards reflect the following membership: Three ports have specifically elected Port Commission board members, Two ports have county commissioners serving as Port Commission board members, Six ports are divisions of county or city government, and Four ports have a board appointed by the Governor and/or local officials. The Florida seaport governance and governing board breakdowns are illustrated in Table 2-2, on the following page. 3 China s ports were not included in the study because of significant differences in regulations and the governance structure of the nation as a whole. 4 Section , F.S. (2015). 5 ibid. FDOT 2015 Florida Seaport System Plan 2-3
38 Chapter 2: Seaport System and Individual Seaport Profiles Table 2-2: Florida Seaport Governance Structure and Related Membership Governance Structure INDEPENDENT SPECIAL DISTRICT DEPENDENT SPECIAL DISTRICT OF A COUNTY DEPENDENT SPECIAL DISTRICT OF A CITY DEPARTMENT OF COUNTY GOVERNMENT DEPARTMENT OF CITY GOVERNMENT Port Canaveral Port of Fernandina Port of Palm Beach Port of Port St. Joe Port Tampa Bay Port Citrus Port Governance Members Port Manatee Port Panama City JAXPORT Port Everglades Port of Ft. Pierce PortMiami Port of Key West Port of Pensacola Port of St. Petersburg Canaveral Port Authority (The Canaveral Harbor Port District) The Ocean Highway and Port Authority, Nassau County Port of Palm Beach District Port Commission Port of Port St. Joe Port Authority Tampa Port Authority (Hillsborough County Port Authority) Citrus County Port Authority Manatee County Port Authority Port Panama City USA Jacksonville Port Authority Port Everglades Department - Broward County St. Lucie County Board of County Commissioners Seaport Department - Miami-Dade County City of Key West, Port Operations Department Port of Pensacola is a department of city government Port of St. Petersburg is a department of city government Five Commissioners elected from districts in central and northern Brevard County. Five Commissioners elected from separate districts. Five elected Commissioners elected at large by voters within the district. Five Commissioners appointed by the Governor to four-year staggered terms. Seven Port Commissioners, five appointed by the Governor, two ex officio including the city of Tampa Mayor and one Hillsborough County Commissioner. Five elected County Commissioners also serve as Port Authority. The County Administrator serves as Port Director. Seven County Commissioners elected from county districts serving four-year staggered terms. Five appointed board members by the City Commission serving four-year terms. Seven member appointed Board of Directors, four members are appointed by the Mayor of Jacksonville and three by the Governor to four years terms. Nine elected County Commissioners appoint County Administrator to administer county government and the Port Director reports to County Administrator. Five elected County Commissioners appoint a County Administrator to manage county departments. Elected Mayor is appointed Administrative Officer and all county departments including 13 Commissioners report to Strong Mayor. City Manager administers city departments and reports to the Mayor and six elected City Commissioners. Nine City Commissioners, seven district elections and two at large. The city is administered by a Strong Mayor who manages all city departments. Department of City of St. Petersburg and Port Director reports to Strong Mayor. A port also may be a landlord port leasing its facilities to maritime users or an operating port providing maritime services to its users or a combination. Of the 15 seaports, 9 utilize the landlord/tenant model, 1 uses the operational model, 2 are a blend of both, and 3 are currently inactive. 6 These operational structures can be seen in Table Port Citrus is not currently operational Florida Seaport System Plan FDOT
39 Chapter 2: Seaport System and Individual Seaport Profiles Table 2-3: Florida Seaport Operational Structures PORT Port Canaveral Port Citrus Port Everglades Port of Fernandina* Port of Ft. Pierce JAXPORT Port of Key West Port Manatee PortMiami Port of Palm Beach Port Panama City Port of Pensacola Port of Port St. Joe Port of St. Petersburg Port Tampa Bay LANDLORD/TENANT NA NA NA OPERATING PORT NA NA NA Notes: *Landlord/Tenant - management agreement with Nassau Terminals LLC to manage port Primary Activity Secondary Activity In their enabling legislation, Florida ports may be specifically granted ad valorem taxing authority; be the beneficiary of another government who is authorized to levy an ad valorem tax for the benefit of the port; or, be specifically prohibited from levying ad valorem taxes for operating expenses and capital investments. Based upon the authority and powers granted to the 15 seaports in their enabling state legislation, only 2 ports, Port Canaveral and the Port of Palm Beach, have direct ad valorem taxing authority, but do not currently exercise its use. There are 11 ports that have boards which have taxing authority by virtue of being a city or a county, and of those 11, 9 cities or counties provide funding at varying levels for seaport operations or capital costs. Port Tampa Bay benefits from the authority of Hillsborough County to annually levy a 0.5 millage ad valorem tax throughout Hillsborough County to defray port expenses. The City of Port St. Joe and/or Gulf County may elect to provide funding to the Port of Port St. Joe. JAXPORT through an interlocal agreement with the City of Jacksonville receives appropriations annually from several different sources. The taxing authority for each Florida seaport can be seen in Table 2-4. FDOT 2015 Florida Seaport System Plan 2-5
40 Chapter 2: Seaport System and Individual Seaport Profiles Table 2-4: Florida Seaport Taxing Authority PORT Port Canaveral Port Citrus Port Everglades Port of Fernandina Port of Ft. Pierce JAXPORT Port of Key West Port Manatee PortMiami Port of Palm Beach Port Panama City Port of Pensacola Port of Port St. Joe Port of St. Petersburg Port Tampa Bay DIRECT TAXING AUTHORITY Yes No No No No No No No No Yes No No No No No TAXING AUTHORITY EXERCISED Not since 1986 NA NA NA NA NA NA NA NA Not since 1975 NA NA NA NA NA HOST TAXING AUTHORITY NA Yes Yes NA Yes Yes Yes Yes Yes NA Yes Yes Yes Yes Yes HOST TAX/SUPPORT RECEIVED NA Yes No NA Yes Yes Yes No Yes NA No Yes No Yes Yes While the governing structures of the local government ports may differ, and the port directors have different levels of authority and available resources; the port directors of the 15 ports sit as equals on the Florida Seaport Transportation Economic Development (FSTED) Council along with state agency partners, including the Florida Department of Transportation (FDOT) and the Department of Economic Opportunity (DEO). Collectively, they chart a course for Florida s economic future based upon a statewide view which incorporates the professional experience, judgment, and perspectives of seaport management and the responsibilities and leadership of the state agency partners Florida Seaport System Plan FDOT

41 Chapter 2: Seaport System and Individual Seaport Profiles 2.3 FLORIDA S POSITION In 2015, Florida became the third most populous state in the U.S., surpassing New York. Currently, there are over 20 million residents living in Florida. 7 This, combined with the 105 million visitors that come each year, has made the Florida gross domestic product 19 th among the world s largest economies. 8 According to Enterprise Florida, Inc., one out of every five U.S. companies that export goods is located in Florida, exporting nearly $60 billion in goods made in the U.S. This puts Florida at number seven among the nation s top exporting states. 9 To compliment this, Florida has the second largest foreign trade zone network in the nation. 10 These activities are supported by an outstanding multimodal network, including 19 commercial service airports, 2 spaceports, 3,000 miles of freight rail track, over 12,000 miles of highway, and 1,540 miles of waterways. In 2014, Florida was ranked 2 nd for infrastructure by the U.S. Chamber of Commerce Foundation. The Florida seaport system boasts several impressive business metrics and rankings. In 2014, Florida was ranked as the number one state for cruise and was home to the top three cruise ports in the world. It was the state with the 5 th most port container traffic, and the state with the 5 th highest amount of overall tonnage going through the ports. It had the 3 rd busiest port in the nation for automobile imports and exports, and is ranked 4 th in tonnage for petroleum and petroleum-related products. Section 2.4 will further explore these rankings and comparisons to other states. United Arab Shipping Company (UASC) Container Vessel at PortMiami Source: Florida Ports Council and PortMiami, U.S. Census Bureau, Enterprise Florida, Why Florida Fast Facts. July Florida Ports Council, Florida Seaports Fast Facts Freight Moves Florida, International Trade Sector, Industry Infrastructure, FDOT 2015 Florida Seaport System Plan 2-7
42 Chapter 2: Seaport System and Individual Seaport Profiles 2.4 TOP FIVE STATES: RANKINGS AND NUMBERS This section will explore how Florida ranks compared to other top tier states, when it comes to cruise, containers, tonnage, and other specific areas, like automobiles and petroleum. For this data, the information from all Florida ports was aggregated to form a statewide number for comparison CRUISE Florida is home to seven cruise ports: six homeports and one port-of-call port. These ports primarily serve the Caribbean/Bahamas markets, which are easily accessible by many Gulf Coast and East Coast ports, and which accounted for nearly 40% of the cruise industry s global bed day capacity in ,12 In 2014, Florida accounted for 62% of all U.S. cruise traffic with 15.5 million revenue passengers, which means that Florida s seaports had more revenue passengers than any other state, and in fact, any country outside of the United States. 13 Alaska, New York, Texas, and California round out the top five states with the highest number of revenue passengers in the U.S., respectively. Though 2015 numbers are available for Florida cruise ports, 2014 was used, as it is the most up-to-date information available for state comparisons. Figure 2-1 shows the state-by-state comparison. Figure 2-1: Top Five Seaport States in the United States by Revenue Passengers (2014) 16,000,000 14,000,000 14,682,567 12,000,000 Revenue Passengers 10,000,000 8,000,000 6,000,000 4,000,000 3,232,423 2,000,000 1,629,854 1,396,527 1,004,986 0 Florida Alaska New York Texas California Source: CLIA - The Contribution of the International Cruise Industry to the U.S. Economy in Passenger bed days are the number of days that all berths could be occupied at 100% occupancy. For more information, please see the CLIA report The Global Economic Contribution of Cruise Tourism Florida-Caribbean Cruise Association, Economic Contribution of Cruise Tourism to the Destination Economies Florida Seaport Transportation and Economic Development Council, Florida s Seaports: Gaining Momentum FY2015-FY2019, Five-Year Florida Seaport Mission Plan Florida Seaport System Plan FDOT


43 Chapter 2: Seaport System and Individual Seaport Profiles Table 2-4 compares the economic impact of the top five cruise states, showing how Florida s related employment and direct purchases far exceed the numbers of the other states. Table 2-5: Employment and Direct Purchase Comparison of the Top Five Cruise States (2014) Employment Direct Purchases Florida 146,401 $7.9 billion Alaska 18,583 $953 million New York 15,890 $1.2 billion Texas 22,689 $1.3 billion California 44,369 $2.2 billion Source: CLIA - The Contribution of the International Cruise Industry to the U.S. Economy in 2014 Cruise Ships at Port Everglades Source: Florida Ports Council and Port Everglades, 2015 FDOT 2015 Florida Seaport System Plan 2-9
44 Chapter 2: Seaport System and Individual Seaport Profiles CONTAINERS To compare Florida s container traffic with other ports, data and rankings from the American Association of Port Authorities for the year 2014 was used. This is the most current data available for comparison purposes. 7 of Florida s 10 container ports are currently ranked in the top 50 container ports in the NAFTA region by AAPA Florida s 2014 volume of more than 3.3 million TEUs puts Florida closely behind the states of Washington and Georgia. California ports combined to make it the largest container port state, with 17.8 million TEUs handled, and New York had the second highest container volume, recording 5.8 million TEUs. 14 The comparison of the top five U.S. states for TEUs can be seen in Figure 2-2, below. Figure 2-2: Top Five U.S. States for TEUs (2014) 20,000,000 18,000,000 17,761,433 16,000,000 14,000,000 12,000,000 TEUs 10,000,000 8,000,000 6,000,000 4,000,000 2,000,000 5,772,303 3,456,161 3,346,048 3,343,194 0 California New York Washington Georgia Florida Source: NAFTA Region Top 50 Rankings In the 2014 NAFTA region top 50 rankings, Port Everglades enters the field at number 15. However, in a comparison of only U.S. ports, Port Everglades comes in at number 11, with JAXPORT and PortMiami following in the 12 th and 13 th spots. 14 American Association of Port Authorities, NAFTA Region Container Traffic 2014 Port Ranking by TEUs, Florida Seaport System Plan FDOT
45 Chapter 2: Seaport System and Individual Seaport Profiles TONNAGE In 2014, Florida had 10 ports handling waterborne tonnage, which together moved 98.7 million tons. Three ports made up the majority of tonnage, with Port Tampa Bay handling over 36 million tons in 2014, followed by Port Everglades with 23.9 million tons, and JAXPORT with 16.9 million tons. 15 The newest data for nationwide comparisons comes from the U.S. Army Corps of Engineers (USACE) Waterborne Commerce Statistics Center, and is reported for 2014 in short tons. In 2014, Louisiana, Texas, California, New Jersey, and Washington made up the top five states for cargo tonnage, by short tons. Florida was ranked 8 th. Texas and Louisiana both reported over 500 million short tons of import, export, and domestic tonnage. California had 230 million short tons, and New Jersey 147 million short tons. Washington rounded out the top 5 with a reported 119 million short tons. Florida reported almost 100 million short tons. The comparison between the top five U.S. ports for tonnage, and Florida, can be seen in Figure 2-3, below. Figure 2-3: Top Five U.S. States and Florida - Total Tonnage (2014) 600,000, ,000, ,774, ,602, ,000,000 Short Tons 300,000, ,228, ,000, ,000, ,237, ,249,000 98,747,000 0 Louisiana Texas California New Jersey Washington Florida Source: USACE Waterborne Commerce Statistics Center, Florida Seaport Transportation and Economic Development Council. Florida s Seaports: Gaining Momentum 15-19, Five-Year Florida Seaport Mission Plan. FDOT 2015 Florida Seaport System Plan 2-11
46 Chapter 2: Seaport System and Individual Seaport Profiles AUTOMOBILES Many of Florida s seaports handle automobile trade, including JAXPORT, Port Tampa Bay, and Port Everglades. In 2014, JAXPORT was ranked 1 st for vehicle exports in the United States and was one of the busiest ports in the nation for total vehicle handling. In addition to several top carmakers utilizing JAXPORT, in 2015 Volkswagen and Porsche began using JAXPORT as an import hub for the southeast U.S. The Port of Baltimore was ranked 1 st in the U.S. for vehicle handling overall with 693,000 total units handled in 2014, followed by the Port of Brunswick, JAXPORT, the Port of New York/ New Jersey, and the Port of San Diego. 16 The comparison of the top five ports can be seen in Figure 2-4, below. Figure 2-4: Top Five United States Ports for Automobile Imports and Exports (2014) 800, , , ,209 Automobile Units 600, , , , , , , , ,500 0 Port of Baltimore Port of Brunswick Jaxport Port of New York/New Jersey Source: Automotive Logistics Annual Survey, 2014 Port of San Diego 16 Anthony Coia, Automotive Logistics, North American Ports: Ebbs and Northbound Flows, July Florida Seaport System Plan FDOT
47 Chapter 2: Seaport System and Individual Seaport Profiles PETROLEUM Florida had 10 ports that handled petroleum products in 2014, according to the USACE, for a total of over 37 million short tons. Port Tampa Bay and Port Everglades reported the highest numbers, with Port Tampa Bay reporting 14.1 million short tons, and Port Everglades reporting 13.7 million short tons. This makes sense, as petroleum and petroleum-related products represent the largest volume commodity sector at Port Tampa Bay, and make up one-fifth of the total revenues of Port Everglades. 17,18 These numbers include both domestic and foreign imported and exported petroleum products, with the majority made up of domestic inbound. JAXPORT and Port Canaveral also reported large volumes of petroleum and petroleum-related products, with 4.8 million short tons and 1.9 million short tons, respectively. According to 2013 USACE data, which is the most current data for state-by-state comparison, Florida ranks 4 th in the U.S. for petroleum and petroleum-related products, behind Texas, Louisiana, and New Jersey. Texas and Louisiana rank 1 st and 2 nd, both with over 100 million short tons of petroleum products. New Jersey ranked 3 rd, with a little over 60 million short tons of petroleum products. Florida and California are 4 th and 5 th, with 37 million and 36 million short tons of petroleum products, respectively. The comparison between the top five states can be seen in Figure 2-5, below. Figure 2-5: Top Five Seaport States in the United States for Petroleum (2013) 200,000, ,000, ,750, ,000, ,000, ,428,408 Short Tons 120,000, ,000,000 80,000,000 60,000,000 40,000,000 20,000,000 60,062,604 37,110,777 36,357,058 0 Texas Louisiana New Jersey Florida California Note: Figure 2-5 does not include unrefined crude oil products. Source: Waterborne Commerce Statistics Center, Port Tampa Bay, Bulk Cargo Information Port Everglades, Petroleum Information. FDOT 2015 Florida Seaport System Plan 2-13


48 Chapter 2: Seaport System and Individual Seaport Profiles 2.5 FLORIDA SEAPORT METRICS There are several ways in which to compare Florida s 15 public seaports. This section compares revenue cruise passengers, the number of containers moved, and the tonnage crossing seaport docks. It should set the stage for the seaport profiles provided in the following section, and allow a comprehensive comparison of each port s strengths and key practices. Figure 2-6 shows the different types of Florida seaports: cruise, cargo, and other. 19 Figure 2-6: Types of Florida Seaports 19 Some seaports do not currently move cargo or cruise passengers, such as Port Citrus, the Port of Ft. Pierce, and the Port of Port St. Joe. The Port of St. Petersburg also does not handle cargo, and primarily focuses on accommodating oceanic research vessels which often are partnering with the University of South Florida Marine Research facilities in St. Petersburg and also on supporting the mega-yacht industry Florida Seaport System Plan FDOT
49 Chapter 2: Seaport System and Individual Seaport Profiles CRUISE PASSENGERS Florida is home to the top three busiest cruise ports in the world and ranks as the number one state in the country serving the cruise industry. In 2015, passengers who embarked from Florida seaports accounted for 62% of all U.S. cruise embarkations. 20 Florida s seven cruise ports, Port Canaveral, Port Everglades, JAXPORT, the Port of Key West, PortMiami, the Port of Palm Beach, and Port Tampa Bay, served 15.5 million revenue cruise passengers in 2014, a more than 10% increase from In 2015, these ports served over 15.2 million passengers. The top three cruise ports, PortMiami, Port Canaveral, and Port Everglades, each served close to, or more than, 4 million revenue passengers. According to Florida s Cruise Industry Statewide Perspective, approximately 92 cruise ships homeported at 6 Florida ports. 21 These ports offer multi-day cruises with itineraries spanning the globe, as well as one-day cruises to the nearby islands of the Bahamas. The Port of Key West is a popular port-of-call for the cruise lines. Florida cruise ports are projected to see significant passenger increases in the next five-year period. The revenue passenger counts of each seaport for 2015 can be seen in Figure 2-7, below. 6,000,000 Figure 2-7: Revenue Cruise Passengers at Florida s Cruise Seaports FY2014/2015 5,000,000 4,915,576 Revenue Passengers 4,000,000 3,000,000 2,000,000 4,168,666 3,773,386 1,000, , , , ,114 0 Port Canaveral Port Everglades JAXPORT Port of Key West PortMiami Port of Palm Beach Port Tampa Bay Note: Revenue Cruise Passengers include embarkations and disembarkations and the data summarizes single day and multi-day cruises. Source: Individual Florida Seaports 20 Cruise Line International Association, The Contribution of the International Cruise Industry to the U.S. Economy in 2014, FDOT, Florida s Cruise Industry Statewide Perspective, FDOT 2015 Florida Seaport System Plan 2-15
50 Chapter 2: Seaport System and Individual Seaport Profiles CONTAINERIZED CARGO Ten Florida seaports handled containerized cargos in 2015, handling a statewide total of 3.5 million twentyfoot equivalent units (TEUs). JAXPORT, Port Everglades, PortMiami, and the Port of Palm Beach are the top 4 container ports in the state and are ranked in the top 25 container ports in the U.S. according to a 2014 American Association of Port Authorities (AAPA) report on container movements. These four ports moved 3.4 million of the 3.5 million containers flowing through Florida s ports in Port Tampa Bay, Port Panama City, and Port Manatee show the next highest TEU counts. It should be noted that Port Canaveral just opened its first dedicated container terminal in late Each seaport s 2015 TEU count can be seen in Figure 2-8, below. 1,200,000 1,000,000 Figure 2-8: TEU Counts at Florida s Container Seaports FY2014/2015 1,060,507 1,076,252 1,007, ,000 TEUs 600, , , , Port Canaveral Port Everglades 8,059 Port of Fernandina JAXPORT 25,778 Port Manatee PortMiami Port of Palm Beach 34,304 Port Panama City 74 Port of Pensacola 56,742 Port Tampa Bay Source: Individual Florida Seaports BULK CARGO Ten of Florida s ports handle dry bulk, liquid bulk, or break-bulk cargo and in 2015, this cargo comprised more than 81.5 million tons of imported, exported, and domestic cargo. For Florida, dry bulk encompasses fertilizers, cement, and aggregates; liquid bulk primarily consists of petroleum products; and, break-bulk comprises all non-containerized general cargo, including vehicles. Port Tampa Bay, Port Everglades, and JAXPORT lead the state in bulk cargo. Port Tampa Bay reported more than 21.5 million tons of liquid bulk cargo, with Port Everglades coming in second reporting 15.7 million tons the tonnage for both ports is primarily made up of petroleum products. Port Tampa Bay also reported the highest tonnage for dry bulk, with nearly 14.7 million tons, with JAXPORT reporting the second highest total at nearly 4.8 million tons. JAXPORT led the state with 3.77 million tons of break-bulk products, and Port Panama City reporting almost 1 million tons followed next Florida Seaport System Plan FDOT
51 Chapter 2: Seaport System and Individual Seaport Profiles Several Florida seaports cater to certain niches, such as Port Panama City and the Port of Pensacola. Port Panama City is the most active port in the country for handling imported copper, and is designated as a copper port by the London Metal Exchange. 22 It also has two major manufacturing tenants that produce industrial goods, including pipe for major pipeline projects around the globe and deep sea utility umbilical cables that support underwater drilling efforts. The Port of Pensacola is active in several niches which are hard to show using typical metrics because they are not measured in tons or TEUs. One of the niches is the provisioning of off-shore oil and gas industry platforms in the Gulf of Mexico. These vessels are tracked in terms of vessel dockage but have low tonnage volumes. Another niche is the export of locally produced wind turbine nacelles, which are oversized, high-value cargo. 23 These turbine nacelles are tracked by number of units instead of tonnage because they are relatively lightweight. The FY2015 breakdown of dry bulk, liquid bulk, and break-bulk cargo, by port, can be seen in Figure 2-9. Figure 2-9: Dry Bulk, Liquid Bulk, and Break-Bulk Cargo Comparisons at Florida s Cargo Seaports for FY2014/ ,000,000 35,000,000 30,000,000 Tons 25,000,000 20,000,000 15,000,000 10,000,000 5,000,000 0 Port Canaveral Port Everglades Port of Fernandina JAXPORT Port Manatee PortMiami Dry Bulk Liquid Bulk Break-bulk Port of Palm Beach Port Panama City Port of Pensacola Port Tampa Bay Source: Individual Florida Seaports 22 Jason Dehart, Northwest Florida s Ports See a Bright Future on the World Stage, Nacelles are the housing that contain all of the generating components of the wind turbine, including the generator, gearbox, drive train, and brake. FDOT 2015 Florida Seaport System Plan 2-17
52 Chapter 2: Seaport System and Individual Seaport Profiles 2.6 SEAPORT PROFILES As the saying goes, If you ve seen one port, you ve seen one port, -- and that is especially true for Florida s diverse seaports. While Florida seaports serve similar overall purposes of moving goods and passengers to and from markets, they differ in many ways, from types of commodities, to methods of handling cargo, and scale of cruise and cargo operations. Each seaport in Florida has a niche unique to its tenants, customers, and its geographic region within the state. As a statewide system, Florida s seaports provide world class facilities necessary to compete in international and domestic markets. With a large and growing consumer population and increasing number of annual visitors, Florida is a global hub for international trade and tourism. The profiles presented in this section offer an overview of each port s facilities and capabilities, as well as commodity and cruise information, trading partners, connectivity to the freight network, and recent investment information. The profiles provide a look at each port individually and will help paint a picture of the larger Florida Seaport System. The profiles are presented in the following order: Port Canaveral; Port Everglades; Port of Fernandina; Port of Jacksonville; Port Manatee; PortMiami; Port of Palm Beach; Port Panama City; Port of Pensacola; Port Tampa Bay; Port Citrus; Port of Key West; Port of Fort Pierce; Port of Port St. Joe; and, Port St. Petersburg Florida Seaport System Plan FDOT


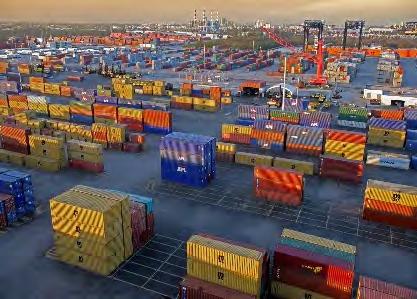
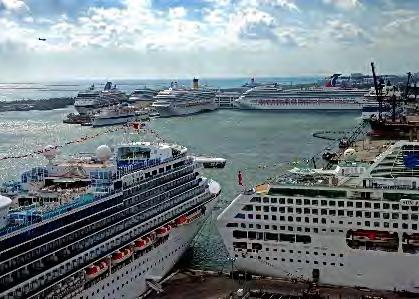
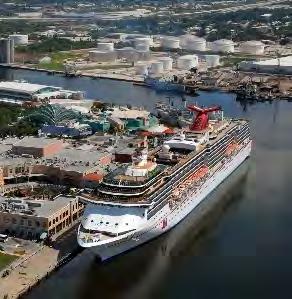
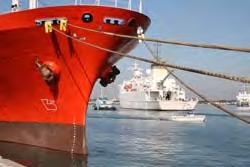
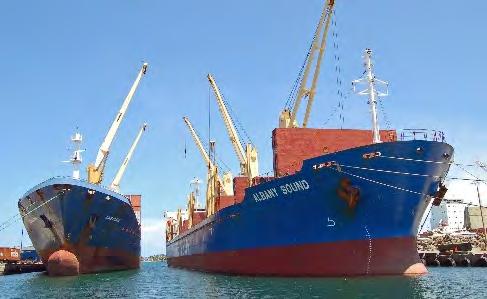
53 Chapter 2: Seaport System and Individual Seaport Profiles Source: Florida Ports Council and individual Florida Seaports, 2016 FDOT 2015 Florida Seaport System Plan 2-19

54 Chapter 2: Seaport System and Individual Seaport Profiles Florida Seaport System Plan FDOT

55 Chapter 2: Seaport System and Individual Seaport Profiles FDOT 2015 Florida Seaport System Plan 2-21


56 Chapter 2: Seaport System and Individual Seaport Profiles Florida Seaport System Plan FDOT

57 Chapter 2: Seaport System and Individual Seaport Profiles FDOT 2015 Florida Seaport System Plan 2-23

58 Chapter 2: Seaport System and Individual Seaport Profiles Florida Seaport System Plan FDOT

59 Chapter 2: Seaport System and Individual Seaport Profiles FDOT 2015 Florida Seaport System Plan 2-25

60 Chapter 2: Seaport System and Individual Seaport Profiles Florida Seaport System Plan FDOT

61 Chapter 2: Seaport System and Individual Seaport Profiles FDOT 2015 Florida Seaport System Plan 2-27


62 Chapter 2: Seaport System and Individual Seaport Profiles Florida Seaport System Plan FDOT
63 Chapter 2: Seaport System and Individual Seaport Profiles FDOT 2015 Florida Seaport System Plan 2-29


64 Chapter 2: Seaport System and Individual Seaport Profiles Florida Seaport System Plan FDOT

65 Chapter 2: Seaport System and Individual Seaport Profiles FDOT 2015 Florida Seaport System Plan 2-31
66 Chapter 2: Seaport System and Individual Seaport Profiles Florida Seaport System Plan FDOT

67 Chapter 2: Seaport System and Individual Seaport Profiles FDOT 2015 Florida Seaport System Plan 2-33

68 Chapter 2: Seaport System and Individual Seaport Profiles Florida Seaport System Plan FDOT


69 Chapter 2: Seaport System and Individual Seaport Profiles FDOT 2015 Florida Seaport System Plan 2-35

70 Chapter 2: Seaport System and Individual Seaport Profiles Florida Seaport System Plan FDOT

71 Chapter 2: Seaport System and Individual Seaport Profiles FDOT 2015 Florida Seaport System Plan 2-37

72 Chapter 2: Seaport System and Individual Seaport Profiles Florida Seaport System Plan FDOT
73 Chapter 2: Seaport System and Individual Seaport Profiles FDOT 2015 Florida Seaport System Plan 2-39


74 Chapter 2: Seaport System and Individual Seaport Profiles Florida Seaport System Plan FDOT

75 Chapter 2: Seaport System and Individual Seaport Profiles FDOT 2015 Florida Seaport System Plan 2-41
76 Chapter 2: Seaport System and Individual Seaport Profiles Florida Seaport System Plan FDOT
77 Chapter 2: Seaport System and Individual Seaport Profiles FDOT 2015 Florida Seaport System Plan 2-43


78 Chapter 2: Seaport System and Individual Seaport Profiles Florida Seaport System Plan FDOT
79 Chapter 2: Seaport System and Individual Seaport Profiles 2.7 CONCLUSION Chapter two highlighted the governance and structure of each seaport and specific metrics of revenue cruise passengers, containers, and bulk cargo by port; provided insight into where Florida ranks in comparison with other states in trade and cruise standings; and gave a detailed profile on each of the 15 Florida seaports. The following Chapter will discuss in more detail the global, domestic, and regional trade trends and market analysis, as well as provide an overview of Florida s competitors to more fully underscore the opportunities and challenges facing Florida seaports. FDOT 2015 Florida Seaport System Plan 2-45
80
81 3. FLORIDA SEAPORT & INTERMODAL FREIGHT SYSTEMS: STATISTICTS, TRENDS, AND CONDITIONS Florida s seaports are critical links in the state s freight supply chain and have consistently ranked among the nation s top cargo ports and lead the nation in cruise passengers. As Florida strengthens its position as a global hub for international trade, it is important to understand both national and state trade-related data, and conditions that impact these trends. Chapter three discusses cargo and trade through tonnage, monetary value, and mode of transportation outlining seaport volumes and cruise passengers and also the role of the inland intermodal networks including highways, rail, the Strategic Intermodal System (SIS), Intermodal Logistics Centers (ILC s), Foreign- Trade Zones and Freight Zones. This Chapter also provides an overview of U.S. and Florida International Trade along with cargo type break-outs, top commodities, and top international trading partners. Florida s primary container shipping companies and cruise lines calling on Florida seaports are also identified. 3.1 FLORIDA SEAPORT CARGO AND CRUISE TRENDS Waterborne trade impacts Florida seaports and the communities that they serve. 1 This section will provide insight into the trends that cause fluctuations in trade, and how these trends affect cargo and cruise business at Florida s ports. There are 10 Florida seaports that handle cargo, collectively handling a wide variety of imports, exports, and domestic cargo, with their total tonnage numbers growing since 2013 to over 103 million tons. This cargo is diverse, made up of a mixture of dry bulk, liquid bulk, break bulk, and container tonnage. In addition, Florida s seaports are world leaders in the cruise market, holding the distinction of the top three cruise seaports in the world. Seven of Florida s seaports serve cruise passengers, and in 2015 they had a combined total of 15.2 million revenue cruise passengers. These statistics will be further explored in the following subsections FLORIDA S TOTAL WATERBORNE COMMERCE Florida is poised for future growth in waterborne trade and commerce, with a unique geography, growing population of almost 20 million people, a huge visitor population, and well developed transportation infrastructure. 2 1 When discussing international trade, national sources like the U.S. Census Bureau are essential in tracking the value of goods and service, so that figures remain constant and comparable annually. Values of commodities can fluctuate from economic factors unrelated to trade or transportation. These types of value changes skew data, shifting overall trade indicators. This skewing is another reason to use a constant national source when reviewing data, and to look at long term trends, not single year outputs alone. 2 Visit Florida, 2015, FDOT 2015 Florida Seaport System Plan 3-1
82 Chapter 3: Florida Seaport & Intermodal Freight Systems: Statistics, Trends, and Conditions These statewide trends, coupled with the recent opening of the expanded Panama Canal in 2016; the completion of both PortMiami s deep dredge to 50 feet and the Miami Access Tunnel; the development of the Intermodal Container Transfer Facilities (ICTF) at Port Everglades and JAXPORT; and construction of major interstate and connector projects, all point to the fact that the FDOT and the state s seaports are preparing for growth. Before delving into the details, we will look at Florida s totals over the past six years to better understand the trends related to trade and the significant role that waterborne commerce plays in state freight movements. Table 3-1 is an annual summary showing all of the major seaport volume metrics for Florida seaports from 2010 to 2015, including containers, tonnage, international trade by direction, and cruise passenger data. Table 3-1: Summary of Florida Seaport Containers, Tonnage, Trade Direction, and Passengers TEUs Total TEU's 2,844,224 3,025,356 3,094,445 3,215,701 3,343,194 3,541,526 TONNAGE Total Tons 106,361, ,300, ,637,049 99,414,541 98,741, ,012,059 IMPORT, EXPORT, AND DOMESTIC TONNAGE Imports 39,604,650 35,932,270 37,336,914 36,376,367 36,594,914 40,458,288 Exports 18,581,630 19,796,557 20,143,671 19,539,122 18,656,294 18,989,078 Domestic 47,817,210 44,224,029 43,156,464 43,499,053 43,498,295 43,564,694 Total 106,003,490 99,952, ,637,049 99,414,541 98,749, ,012,060 PASSENGERS Multi Day 12,328,196 13,171,199 13,763,532 13,654,048 14,922,455 14,745,913 Single Day 682, , , , , ,406 Total 13,010,477 13,659,229 14,148,238 14,070,396 15,551,339 15,246,319 Note: Cruise counts are revenue passengers including embarkations and disembarkations. Values represented in current year U.S. dollars. Source: Individual Florida Seaports, FSTED Council Five-Year Mission Plans, and U.S. Census Bureau, Foreign Trade Division, 2015 Florida s container movements are shown in TEUs, and have been steadily increasing over the past several decades, growing almost 700,000 TEUs in just the past 6 years. Tonnage reported for Florida ports has been down for the past 4 years, but in 2015 increased to a total of 103 million tons, breaking 100 million tons for the first time in three years. In 2015, cruise passenger numbers exceeded 15 million for the second year in a row Florida Seaport System Plan FDOT
83 Chapter 3: Florida Seaport & Intermodal Freight Systems: Statistics, Trends, and Conditions FLORIDA SEAPORT CARGO VOLUMES Florida seaport tonnages are reported by the individual Florida seaports for the annual update of the Florida Seaport Transportation and Economic Development (FSTED) Council s Five-Year Seaport Mission Plan (Mission Plan). The Mission Plan also uses a combination of statistics reported by the ports and the U.S. Census Bureau. In Table 3-2, the top section breaks down total trade tons by Florida seaport, including imports, exports and domestic tonnage, and the bottom section includes the past six years of the totals for each column. The table is ranked largest to smallest for 2015 total tons shipped. Port Tampa Bay leads with 37.4 million tons. Port Everglades is second with 24.0 million tons, and JAXPORT is third with 17.7 million tons. Ports with strong domestic proportions include Port Tampa Bay, Port Everglades, JAXPORT, Port of Pensacola, Port Canaveral and Port of Palm Beach. Table 3-2: Imports, Exports, and Domestic Waterborne Tonnage at Florida Seaports, and Statewide Tonnage Totals (2010 to 2015) Port Imports Exports Domestic Total Port Tampa Bay 8,143,620 5,934,608 23,296,064 37,374,291 Port Everglades 9,417,910 3,563,468 11,020,285 24,001,663 JAXPORT 7,393,365 2,659,230 7,652,142 17,704,737 PortMiami 4,567,926 4,045, ,613,739 Port Manatee 6,358, , ,517,732 Port Canaveral 3,128,965 83, ,931 4,151,726 Port of Palm Beach 380,739 1,168, ,780 2,094,069 Port Panama City 975,532 1,036,552 20,342 2,032,426 Port of Fernandina 22, , ,981 Port of Pensacola 68,923 56,622 92, ,695 Current 2015 Total 40,458,288 18,989,078 43,564, ,012, Total 36,594,914 18,656,294 43,498,295 98,741, Total 36,376,367 19,539,122 43,499,053 99,414, Total 37,336,914 20,143,671 43,156, ,637, Total* 35,932,270 19,796,557 44,224, ,300, Total* 39,604,650 18,581,630 47,817, ,361,422 Note: Years represent the last year of the Seaport Mission Plan s Fiscal Year. No cargo reported for Port of Citrus, Port of Fort Pierce, Port of Key West, Port of Port St. Joe, or Port of St. Petersburg. *Totals includes other commodities like water sales. Source: Individual Florida Seaports and the FSTED Council s Five-Year Mission Plans Figure 3-1 illustrates port by port total waterborne cargo trade, with breakouts for each port for domestic cargo, shown in grey, exports in blue, and imports in green. Florida s seaport waterborne tonnage data is also reported in Table 3-3 and illustrated in Figure 3-2. This data goes back to 2010 to provide continuity of information for the six years since the 2010 Seaport System Plan was published. FDOT 2015 Florida Seaport System Plan 3-3
84 Chapter 3: Florida Seaport & Intermodal Freight Systems: Statistics, Trends, and Conditions Millions Figure 3-1: Import, Export, and Domestic Waterborne Tonnage at Florida Seaports (2015) 45.0 Imports Exports 35.0 Domestic Note: No cargo reported for Port of Citrus, Port of Fort Pierce, Port of Key West, Port of Port St. Joe or Port of St. Petersburg. Source: Individual Florida Seaports and the FSTED Council s Five-Year Mission Plan Data Table 3-3: Waterborne Tonnage at Florida Seaports (2010 to 2015) Port Port Tampa Bay 37,148,407 34,252,712 33,907,564 34,940,655 36,217,443 37,374,291 Port Everglades 21,640,144 22,087,515 21,868,900 22,452,473 23,985,882 24,001,663 JAXPORT 23,209,832 19,424,444 21,879,311 18,556,178 16,932,989 17,704,738 PortMiami 7,389,165 8,221,756 8,108,070 7,980,527 7,699,886 8,613,739 Port Manatee 8,032,392 7,247,449 6,837,811 7,197,430 6,403,414 6,517,733 Port Canaveral 3,218,144 4,547,724 3,904,986 3,874,266 3,362,282 4,151,726 Port of Palm Beach 2,548,346 1,953,893 2,005,461 2,145,864 2,150,804 2,094,069 Port Panama City 1,345,000 1,412,000 1,420,665 1,776,509 1,575,223 2,032,426 Port of Fernandina 645, , , , , ,981 Port of Pensacola 869, , , , , ,695 Port of Ft. Pierce 315, ,560 95, Total 106,361, ,300, ,637,049 99,414,541 98,741, ,012,061 Note: No waterborne cargo reported for Port Citrus, Port of Key West, Port of Port St. Joe, or Port of St. Petersburg. Source: Individual Florida Seaports and the FSTED Council s Five-Year Mission Plan Data Figure 3-2 ranks Florida seaports from highest to lowest for tonnage movements from 2010 to Almost every Florida port reporting tonnage is showing growth from 2014 to Total Florida seaport cargo tonnage grew over 4% from 2014 to Port Tampa Bay and Port Everglades have seen consistent tonnage growth each year since Florida Seaport System Plan FDOT

85 Chapter 3: Florida Seaport & Intermodal Freight Systems: Statistics, Trends, and Conditions Figure 3-2: Waterborne Tonnage at Florida Seaports (2010 to 2015) Millions Port Tampa Bay Port Everglades JAXPORT PortMiami Port Manatee Port Canaveral Port of Palm Beach Port Panama City Port of Fernandina Port of Pensacola Port of Ft. Pierce Note: No waterborne cargo reported for Port Citrus, Port of Key West, Port of Port St. Joe, or Port of St. Petersburg. Source: Individual Florida Seaports and the FSTED Council s Five-Year Mission Plan Data Bulk cargo at Port Tampa Bay s Redwing bulk-handling facilities Source: FDOT Seaport Office FDOT 2015 Florida Seaport System Plan 3-5
86 Chapter 3: Florida Seaport & Intermodal Freight Systems: Statistics, Trends, and Conditions FLORIDA SEAPORT VOLUMES BY CARGO TYPE Table 3-4 provides another way by which to break tonnage down, port-by-port, as it relates to major types of cargo and how this cargo is handled. The column showing container cargo is shown in tons for cross correlation to the other cargo types of dry-bulk, liquid bulk, and break-bulk. The bottom of the table has annual totals from 2010 to Container tonnage growth over the past six years has increased by 3.3 million tons. Break-bulk cargo also showed steady positive growth, with an increase of 1.1 million tons from 2010 to Table 3-4: Tonnage by Cargo Type at Florida Seaports and Statewide Tonnage Totals (2010 to 2015) Port Dry Bulk Liquid Bulk Break-bulk Container Total Port Canaveral 1,127,049 2,927,991 84,006 12,680 4,151,726 Port Everglades 1,234,305 15,743, ,647 6,693,446 24,001,663 Port of Fernandina 20, ,856 38, ,981 JAXPORT 4,821,778 5,035,077 3,777,683 4,070,200 17,704,738 Port Manatee 806,017 4,886, , ,032 6,517,733 PortMiami ,000 8,523,739 8,613,739 Port of Palm Beach 571, ,330 53,546 1,234,809 2,094,069 Port Panama City 862,846 22, , ,496 2,032,426 Port of Pensacola 137, , ,695 Port Tampa Bay 14,674,000 21,527, , ,410 37,374,291 Current 2015 Total 24,254,635 50,376,613 6,889,987 21,490, ,012, Total 22,148,166 49,085,267 7,354,111 20,153,958 98,741, Total 22,764,065 51,038,215 5,553,417 20,058,844 99,414, Total 22,381,524 51,661,587 5,994,114 20,599, ,637, Total 22,318,083 53,181,770 5,466,384 19,334, ,300, Total 27,301,873 55,057,465 5,755,767 18,246, ,361,422 Note: No cargo reported for Port of Citrus, Port of Fort Pierce, Port of Key West, Port of Port St. Joe or Port of St. Petersburg. Source: Individual Florida Seaports and the FSTED Council s Five-Year Mission Plan Data Florida s waterborne commerce trends for containerized and for non-containerized cargo, both imports and exports, are shown in Figure 3-3. Both containerized imports and exports and non-containerized imports and exports are trending away from each other, which illustrates growth in imports and stagnation in exports Florida Seaport System Plan FDOT
87 Chapter 3: Florida Seaport & Intermodal Freight Systems: Statistics, Trends, and Conditions Figure 3-3: Waterborne Container vs. Non-Container Imports and Exports at Florida Seaports (2009 to 2014) Tons in Millions Source: U.S. Census Bureau, Foreign Trade Division, USA Trade, 2014 Containerized Imports Non-Containerized Imports Containerized Exports Non-Containerized Exports Florida s container ports play a significant gateway role in moving goods to other modes such as trucks and rail via intermodal container transfer facilities (ICTFs). As discussed previously, over the past six years Florida ports have collectively grown container volumes, adding almost 700,000 TEUs, as illustrated in Table 3-5 and Figure 3-4. Table 3-5: Containers in TEUs at Florida Seaports (2010 to 2015) Port JAXPORT 826, , ,660 1,028,541 1,081,528 1,076,252 Port Everglades 793, , , ,572 1,013,344 1,060,507 PortMiami 847, , , , ,708 1,007,782 Port of Palm Beach 213, , , , , ,277 Port Tampa Bay 44,827 39,632 39,882 42,198 47,265 56,742 Port Panama City 40,000 41,900 41,456 39,716 37,310 34,304 Port Manatee 30,431 14,576 12,610 9,621 14,078 25,778 Port of Fernandina 32,885 22,005 14,092 11,239 9,652 8,059 Port Canaveral Port of Pensacola Port of Ft. Pierce 15,080 11,853 6, Total 2,844,224 3,025,356 3,094,445 3,215,701 3,343,194 3,541,526 Note: No container cargo reported for Port Citrus, Port of Key West, Port of Port St. Joe, or Port of St. Petersburg. Source: Individual Florida Seaports and the FSTED Council s Five-Year Mission Plan Data JAXPORT, Port Everglades, and PortMiami combined for an increase of 677,485 TEUs from 2010 to 2015, and contributed over 90% of the total observed growth. The next largest container port, Port of Palm Beach, grew by almost 60,000 TEUs, or 27%, during this observation period. Since 2013, Port Manatee has increased by over 16,000 TEUs, or 38% increase in that 2-year period. Port Tampa Bay has reached an alltime high in 2015, with a total of 56,742 TEUs. FDOT 2015 Florida Seaport System Plan 3-7
88 Chapter 3: Florida Seaport & Intermodal Freight Systems: Statistics, Trends, and Conditions Figure 3-4: Florida Ports Containers in TEUs (2010 to 2015) 1,200,000 1,100,000 1,000, , , , , , , , , , JAXPORT Port Everglades PortMiami Port of Palm Beach Port Tampa Bay Port Panama City Port Manatee Port of Fernandina Port Canaveral Port of Pensacola Port of Ft. Pierce Note: No container cargo reported for Port Citrus, Port of Key West, Port of Port St. Joe, or Port of St. Petersburg. Source: Individual Florida Seaports and the FSTED Council s Five-Year Mission Plan Data The figures in this section do not yet reflect the total impact of major infrastructure investments that have occurred at several ports in the past two-to-three years, or improvements that are currently on-going. For example, the completion of the Intermodal Container Transfer Facilities (ICTFs) at Port Everglades and JAXPORT; and the completed deep dredge project at PortMiami and those underway at Port Everglades and JAXPORT have not yet fully impacted TEU numbers. Several of Florida s other container ports, including Port Canaveral, Port Manatee, Port Panama City, Port of Palm Beach, and Port Tampa Bay, have also been investing in capacity improvements and new equipment. In 2015, Port Tampa Bay completed major site development work at their container terminal and received two new post Panamax gantry cranes in April of Port Manatee has a new container shipping line service calling at the port since early 2015, and Port Panama City added a Mobile Harbor Crane in early 2015, refurbished an older crane, and has added new reefer plug stacks. Port Panama City s container line, Linea Peninsular, also purchased newer vessels with higher capacity. Port Canaveral recently completed a brand new container terminal with two refurbished gantry cranes. These investments in container handling equipment and added capacity are expected to have significant impacts on the total container volumes handled by Florida ports Florida Seaport System Plan FDOT
89 Chapter 3: Florida Seaport & Intermodal Freight Systems: Statistics, Trends, and Conditions CONTAINER LINES SERVING FLORIDA SEAPORTS In 2015, Florida s seaports moved over 3.5 million TEUs, with Florida s ports serving many of the world s top container shipping lines. The 24 primary container shipping lines calling Florida are listed in Table 3-6, which shows the total number of ports around the globe at which these lines call and the number of Florida seaports that are a destination along their routes. Table 3-6: Container Shipping Line Companies that Call Florida on Seaports Container Shipping Line Company Ports of Call Number of Florida Ports of Call Alianca 58 2 Antillean Marine Shipping Corporation 5 1 APL Bernuth Lines 22 1 China Shipping 35 1 Crowley Liner Services 30 2 CSAV Dole Ocean Cargo Express 21 1 Evergreen Marine Corp FESCO 53 1 Great White Fleet 19 1 Hamburg Sud Hapag-Lloyd Kent Line International 22 1 King Ocean Services 12 2 Libra Linea Peninsular 4 1 Maersk Line MOL NYK OOCL Seaboard Marine 36 2 Tropical Shipping 29 1 ZIM Source: World Port Source, Some shipping lines call on several ports in Florida; some only call on one, often for a specific commodity or because of proximity to a specific trade route. It is common for the lines to call both at a port in the southern part of the state, such as PortMiami or Port Everglades, and a port in the northern part of the state, such as JAXPORT or Fernandina, allowing that particular line to serve markets and customers in various population centers. FDOT 2015 Florida Seaport System Plan 3-9
90 Chapter 3: Florida Seaport & Intermodal Freight Systems: Statistics, Trends, and Conditions FLORIDA SEAPORTS CRUISE BUSINESS Florida s seaport system is the cruising capital of the world. In December of 2013, FDOT published Florida s Cruise Industry: A Statewide Perspective which provides a detailed analysis of the seven Florida ports that have cruise-related activity. The study also provides a detailed description of the cruise lines that homeport in Florida. 3 As mentioned in Chapter two of this plan, Florida is a global leader in annual cruise passenger embarkations and disembarkations. In addition to the overview in Chapter two, this section will provide a brief description of current industry trends and conditions related to the primary cruise lines serving Florida. Some current trends are related to the number of new cruise vessels on order, the number of vessels homeporting at Florida ports, as well as how provisioning and supplying cruise vessels relate to the movement and sourcing of goods in Florida Florida Cruise Industry Trends Figure 3-5 and Table 3-7 show the annual multi-day, one-day, and total revenue cruise passengers at Florida cruise ports from 2010 to Although there was a slight dip in the total number of revenue cruise passengers in 2015, the number has been on the rise since ,000,000 4,500,000 Figure 3-5: Annual Total Revenue Cruise Passengers at Florida Seaports (2010 to 2015) Revenue Passengers 4,000,000 3,500,000 3,000,000 2,500,000 2,000,000 1,500,000 1,000,000 PortMiami Port Canaveral Port Everglades Port Tampa Bay Port of Key West JAXPORT Port of Palm Beach 500, Note: Florida currently has seven seaports that provide cruise line services with either homeported vessels or port-of-call vessel service. Source: Individual Florida Seaports and the FSTED Council s Five-Year Seaport Mission Plan Data 3 Florida s Cruise Industry: A Statewide Perspective, Florida Seaport System Plan FDOT
 2010 2011 2012 2013 2014 2015 PortMiami Port Canaveral Port Everglades Port Tampa Bay Port of Key West JAXPORT Port of Palm Beach Total all Cruise Ports MULTI-DAY 4,145,043 2,722,751 3,314,208")
91 Chapter 3: Florida Seaport & Intermodal Freight Systems: Statistics, Trends, and Conditions Table 3-7: Annual Multi-Day, One-Day, and Total Revenue Cruise Passengers at Florida Seaports (2010 to 2015) PortMiami Port Canaveral Port Everglades Port Tampa Bay Port of Key West JAXPORT Port of Palm Beach Total all Cruise Ports MULTI-DAY 4,145,043 2,722,751 3,314, , , , ,438 12,328,196 ONE-DAY 0 80, , , , ,281 TOTAL 4,145,043 2,802,951 3,674, , , , ,884 13,010,477 MULTI-DAY 4,018,161 3,100,199 3,644, , , , ,000 13,171,199 ONE-DAY 0 44, , , ,030 TOTAL 4,018,161 3,144,668 3,932, ,611 1,007, , ,000 13,659,229 MULTI-DAY 3,774,452 3,761,056 3,689, , , , ,004 13,763,532 ONE-DAY 0 243,227 68, , ,706 TOTAL 3,774,452 4,004,283 3,757, , , , ,004 14,148,238 MULTI-DAY 4,030,356 3,717,586 3,509, , , , ,969 13,654,048 ONE-DAY 48, ,408 90, , ,348 TOTAL 4,078,529 3,986,994 3,600, , , , ,827 14,070,396 MULTI-DAY 4,771,983 3,863,606 3,880, , , , ,744 14,922,455 ONE-DAY 167, , , , ,884 TOTAL 4,939,062 4,193,005 4,001, , , , ,829 15,551,339 MULTI-DAY 4,875,313 3,860,225 3,622, , , , ,387 14,745,913 ONE-DAY 40, , , ,406 TOTAL 4,915,576 4,168,666 3,773, , , , ,932 15,246,319 Note: Florida current has seven seaports that provide cruise line services with either homeported vessels or port-of-call vessel service. Source: Individual Florida Seaports and the FSTED Council s Five-Year Seaport Mission Plan Data Cruise Ship Sailing from Port Canaveral past Jetty Park Source: Port Canaveral, 2016 FDOT 2015 Florida Seaport System Plan 3-11

92 Chapter 3: Florida Seaport & Intermodal Freight Systems: Statistics, Trends, and Conditions There are 94 vessels from 22 cruise lines that homeport in Florida. Of the 22 cruise lines that homeport at a Florida port, several use more than one Florida port, with one line, Carnival, calling at five of Florida s six homeports, and Royal Caribbean having four homeports. Other lines call at two or three of the ports. Thirteen of the 22 lines only homeport at one Florida port. These cruise lines and the ports at which they homeport are depicted in Table 3-8, below. Table 3-8: Cruise Lines, and the Florida Seaports at which they Homeport Seaport Port Canaveral Port Everglades JAXPORT PortMiami Port of Palm Beach Port Tampa Bay Azamara Club Cruises Bahamas Paradise Balearia Bahamas Express Blue Horizon Carnival Cruise Lines Celebrity Cruises Costa Cruises Crystal Cruises Cunard Cruise Line Cruise Line Disney Cruise Line Fathom Cruises Holland America Line MSC Cruises Norwegian Cruise Line Oceania Cruises Princess Cruises Regent Seven Seas Cruises Resorts World Bimini Royal Caribbean International Seabourn Cruise Line Silversea Luxury Cruises Victory Casino Cruises Source: FDOT Seaport Office, Florida Seaport System Plan FDOT

93 Chapter 3: Florida Seaport & Intermodal Freight Systems: Statistics, Trends, and Conditions Florida Cruise Industry Provisioning Florida has been a global leader in the cruise industry for many decades. In recent years, FDOT has taken a more interactive role with the development of the Freight, Logistics and Passenger Operations (FLP) Office. As mentioned previously, in December 2013, the FDOT Seaport Office produced the first statewide cruise overview, Florida s Cruise Industry: A Statewide Perspective. The state has historically tracked passenger data through the FSTED Council s Five-Year Seaport Mission Plans; however, certain metrics such as the goods consumed by the cruise industry, have never been fully explored. In 2015, FDOT s Seaport and Waterways Office began a study to conduct a comprehensive analysis of the activities, industries, commodities, tonnages, and values associated with provisioning cruise vessels when docked at one of Florida s cruise ports. The purpose of the study is to gain an understanding of the six cruise home ports, cruise lines, stevedores, operators, port tenants, and other related industries and their roles in the Florida economy and goods movement sectors. Having reviewed the recent history of Florida s seaport cargo and cruise trends, the next section will provide an overview of Florida s freight and seaport system network. 3.2 FLORIDA S STRATEGIC INTERMODAL SYSTEM This section, and the subsections that follow, describe Florida s networks of seaports, highways, roads, rail lines, logistics and distribution centers, Foreign-Trade Zones (FTZ s), and freight logistics zones that support the multi-modal flow of freight and people throughout the state, and to and from Florida s seaports ESTABLISHING A STRATEGIC INTERMODAL SYSTEM In 2003, Florida s Governor and Legislature established the Strategic Intermodal System (SIS) with a goal to enhance the state s economic competitiveness by directing transportation resources towards infrastructure that meets the critical needs for citizens, industries, and businesses to travel effectively and efficiently within and through the state. Over the past twelve years, Florida s demographic and economic portraits have changed; however, the initial concept of the SIS remains the same. In Section , F.S., the Legislature defines the SIS, stating: The designation of a strategic intermodal system, composed of facilities and services of statewide and interregional significance, will efficiently serve the mobility needs of Florida s citizens, businesses, and visitors and will help Florida become a worldwide economic leader, enhance economic prosperity and competitiveness, enrich quality of life, and reflect responsible environmental stewardship. To that end, it is the intent of the Legislature that the Strategic Intermodal System consist of transportation facilities that meet a strategic and essential state interest and that limited resources available for the implementation of statewide and interregional transportation priorities be focused on that system. 4 4 Sections , F.S., describe other aspects of the SIS. FDOT 2015 Florida Seaport System Plan 3-13

94 Chapter 3: Florida Seaport & Intermodal Freight Systems: Statistics, Trends, and Conditions Port Everglades is a Strategic Intermodal System (SIS) Hub Source: Florida Ports Council and Port Everglades, 2015 Concurrently to this Florida Seaport System Plan, the FDOT Offices of System Planning and Policy Planning are updating the SIS Policy Plan. This plan is a product of collaboration between FDOT and state, regional, and local partners and stakeholders and will specifically address the statutory intent stated above THE STRATEGIC INTERMODAL SYSTEM (SIS) The SIS includes the state s largest and most significant commercial service and general aviation airports, spaceports, public seaports, intermodal freight terminals, interregional passenger terminals, urban fixed guideway transit corridors, rail corridors, waterways, and highways. SIS facilities are the workhorses of Florida s transportation system and account for a dominant share of the people and freight movements to, from, and within Florida. 5 The SIS includes three types of facilities hubs, corridors, and connectors: HUBS: CORRIDORS: Airports, spaceports, seaports, rail terminals, and other types of freight and passenger terminals moving goods or people between Florida regions or between Florida and other states and nations. Highways, passenger and freight rail lines, urban fixed guideway transit, and waterways connecting regions within Florida or connecting Florida and other states or nations. CONNECTORS: Highways, passenger and freight rail lines, urban fixed guideway transit, and waterways linking hubs to corridors, linking hubs to other hubs, or linking corridors to major military facilities. 5 For additional SIS resources, see Florida Seaport System Plan FDOT
95 Chapter 3: Florida Seaport & Intermodal Freight Systems: Statistics, Trends, and Conditions The SIS includes transportation facilities owned by FDOT, local governments, independent authorities, and the private sector. To be designated as part of the SIS, transportation facilities must meet specific criteria related to transportation or economic activity, as well as screening factors related to potential community and environmental impacts. SIS facilities are generally the largest and most strategic facilities in the state. The SIS also includes facilities that are emerging in importance, such as those located in fast growing areas or rural areas, and planned facilities anticipated to meet these criteria once operational. All facilities designated on the SIS are eligible for state transportation investments consistent with the policy framework defined in the SIS Policy Plan FLORIDA S SIS SEAPORTS AND WATERWAYS There are currently seven SIS ports, four emerging SIS ports, and one emerging SIS planned add, as shown in Table 3-9, below, and also in Figure 3-6 on the following page. 6 Table 3-9 depicts over 2,300 track miles of SIS, emerging SIS, and SIS connectors, which provide connections to most of Florida s SIS seaport hubs. Also shown in the table below are 2,232 miles of SIS/emerging SIS waterways and over 4,600 centerline miles of SIS/emerging SIS, connector, and planned add highways that provide intermodal connectivity to the Florida Seaport System. Table 3-9: Designated SIS and Emerging SIS Facilities Facility Type SIS Emerging SIS SIS Connector Planned Add Seaports Rail (Miles) 1, Highway (Centerline Miles) 3, Waterway (Miles) 1, The SIS network has multiple hubs, corridors and connectors. Figure 3-6 provides a brief illustration of the statewide SIS network including hubs (seaports), corridors, and connectors (rail, highways and waterways). The FDOT Systems Planning Office provides an annual atlas, which is a more comprehensive version of the SIS map shown below. 7 6 SIS Planned Add is a designation for a hub, corridor or connector that is working toward SIS designation criteria eligibility SIS Atlas, FDOT 2015 Florida Seaport System Plan 3-15
 Seaports, Railroads and Highways and Waterways 3-16 2015 Florida Seaport System Plan FDOT")
96 Chapter 3: Florida Seaport & Intermodal Freight Systems: Statistics, Trends, and Conditions Figure 3-6: Strategic Intermodal System (SIS) Seaports, Railroads and Highways and Waterways Florida Seaport System Plan FDOT
97 Chapter 3: Florida Seaport & Intermodal Freight Systems: Statistics, Trends, and Conditions FLORIDA S FUTURE CORRIDOR PLANNING PROCESS Florida seaports are planning and implementing expansion programs that will vastly increase freight movements across the state s highways and rail lines over the next 5 to 10 years. It is essential that Florida seaports remain engaged in the planning of current and future landside corridors. To engage modal stakeholders, including the seaports, in this long-term planning effort, the Future Corridors Planning Process was created by FDOT and designed to be the primary tool in identifying Florida s future transportation corridors over the next 50 years. This is a large-scale approach to making decisions about transforming existing corridors and developing new corridors in the context of environmental, economic development, and community goals. FDOT has on-going collaboration with state, regional, and local agencies and entities; environmental stakeholders; businesses; 75 economic development organizations; private landowners; and public citizens to develop the guiding principles for corridor planning and recommendations on where future corridors should be located. The impact of mapping future corridors will be dramatic and deserves careful study and consideration. For a better understanding of the current planning process, included below is an edited excerpt from the FDOT Future Corridors website. 8 Why Consider Future Statewide Corridors? In addition to an expected population increase of 37% by 2040, it is also anticipated Florida will experience a 44% increase in visitors by 2040, and a 39% increase in freight tonnage by This means Florida, as a state, will need to: Better coordinate long-range transportation and development plans and visions to identify and meet a growing demand for moving people and freight. Identify long-range solutions that support statewide and regional goals for economic development, quality of life, and environmental stewardship. Provide solutions for or alternatives to major highways that already are congested. Improve connectivity between Florida and other states and nations and among Florida's regions to better support economic development opportunities consistent with regional visions and the Florida Department of Economic Opportunity's (DEO s) Strategic Plan for Economic Development. What Types of Corridors Are Being Planned? A statewide transportation corridor is one that connects Florida to other states or connects broad regions within Florida, generally by high-speed, high-capacity transportation facilities such as interstate highways or other limited-access roadways, major rail lines, and major waterways. These corridors may also involve multiple modes of transportation, as well as other linear infrastructure such as pipelines and telecommunications or utility transmission lines. This initiative focuses on two approaches to plan for future corridors: Transforming existing facilities in a corridor to serve a new function, such as adding tolled express lanes, truck-only lanes, or bus rapid transit systems to an existing highway, or adding passenger service to an existing freight rail line. 8 Florida Future Corridors, Office of Policy Planning, 2015 FDOT 2015 Florida Seaport System Plan 3-17

98 Chapter 3: Florida Seaport & Intermodal Freight Systems: Statistics, Trends, and Conditions Identifying study areas for potential new parallel facilities to provide alternatives to existing congested highways or potential new corridors for multimodal facilities in regions not well-served by statewide corridors today. When Will Future Corridors Be Developed? FDOT conducted Concept Studies on priority study areas in 2012 and Figure 3-7 shows all the identified future corridor study areas that were identified in the FDOT technical report released in October of FDOT is currently focusing its attention on two Future Corridor Study Areas, including Tampa Bay to Central Florida, shown in baby blue and Tampa Bay to Northeast Florida, shown in orange. These two study areas have completed the Concept Stage and are currently in the Evaluation Stage of the Future Corridors Planning Process. Figure 3-7: Florida s Future Corridors Initial Study Area Source: FDOT Future Corridors, Active Study Areas 9 FDOT Future Corridors Technical Report, October Florida Seaport System Plan FDOT

99 Chapter 3: Florida Seaport & Intermodal Freight Systems: Statistics, Trends, and Conditions 3.3 HIGHWAYS, CONNECTORS AND MOTOR CARRIERS Florida s transportation system supports a substantial volume of freight that moves into, out of, and through the state by various modes. While many of these freight movements may begin and end at one of Florida s public seaport terminals or a rail yard, highways are the most significant corridors by both tonnage and value. The state is not only a producer, but also a major consumer, of goods, and serves a very large residential population of 20 million people, as well as a visitor population of over 105 million people. The majority of these freight movements serve the consumption needs of these populations The following subsections provide an overview of the role of trucking in Florida s transportation system and economy, the metrics of trucking in Florida, as well as issues facing the trucking industry. As the leading mode of transportation of freight within Florida, the trucking industry depends on a safe and uncongested highway system to efficiently deliver goods to market. Florida has over 121,759 centerline miles of public roads, with 12,076 of those miles on the Truck Leaving Security Check Point at PortMiami, Florida State Highway System, and over 4,549 miles designated as the highway portion of the Strategic Intermodal System (SIS). The designated SIS Highways make up the primary structure of the overall SIS, linking major hubs, like seaports, with other intermodal/freight facilities. FDOT plays a principal role in planning, funding, and developing the strategic freight network of highways, interstates, connector roads, and bridges that give seaports a competitive edge when freight Source: PortMiami, 2015 is moved by truck HIGHWAY CONNECTIONS AT FLORIDA PORTS Florida s seaports utilize the network of highways and interstates to connect freight from their facilities to distribution centers or directly on to final destinations. The most strategic roads related to freight have been incorporated into Florida s Strategic Intermodal System (SIS). Figure 3-8 illustrates the vast network of Interstates and highway corridors and connector roads that provide access to the seaports. Of the 15 Florida seaports, 11 are located on a SIS Interstate or Highway Corridor, two seaports are on a SIS Highway Connector, one seaport is on an emerging SIS Highway, and two ports are not connected to a SIS Corridor or Highway Network. FDOT 2015 Florida Seaport System Plan 3-19
 Highways 3-20 2015 Florida Seaport System Plan")
100 Chapter 3: Florida Seaport & Intermodal Freight Systems: Statistics, Trends, and Conditions Figure 3-8: Florida s Strategic Intermodal System (SIS) Highways Florida Seaport System Plan FDOT

. This provides unrestricted access to Heckscher Drive to accommodate anticipated increases in commercial truck traffic.")


101 Chapter 3: Florida Seaport & Intermodal Freight Systems: Statistics, Trends, and Conditions RECENT ROAD CONNECTOR IMPROVEMENT PROJECTS AT FLORIDA SEAPORTS The following projects are examples of FDOT highway projects that support seaport connectivity. The costs of these projects are not reflected in the FDOT seaport work program, rather they are part of the highways system work program. JAXPORT HECKSCHER DRIVE AND I-295 The project includes widening New Berlin Road south of Heckscher Drive and constructing new southbound ramps from I- 295 with direct access to the TraPac Container Terminal and the new Intermodal Container Transfer Facility (ICTF). This provides unrestricted access to Heckscher Drive to accommodate anticipated increases in commercial truck traffic. 10 PORTMIAMI TUNNEL (PORTMIAMI) This project connects SR A1A/MacArthur Causeway to Dodge Island and provides direct access between the seaport and highways I-395 and I-95. Additionally, it creates another entry to PortMiami and alleviates traffic congestion entering and exiting the port, as well as improves traffic flow in downtown Miami by reducing the number of cruise-related vehicles and cargo trucks on the downtown streets. The Tunnel was completed and opened to traffic in PORT EVERGLADES ELLER DRIVE OVERPASS Completed in 2015, the Eller Drive Overpass allows vehicles entering Port Everglades to travel over two new rail tracks put in place at the new Intermodal Container Transfer Facility (ICTF) at the Port. Work included reconstruction of several ramps at the I-595/US 1/Eller Drive interchange and reconstructing Eller Drive intersections at Northeast 7th Ave., Northeast 14th Ave., and McIntosh Road. 12 PORT TAMPA BAY SELMON EXPRESSWAY The I-4/Lee Roy Selmon Expressway Connector, also known as the Crosstown Connector, was constructed to carry traffic between Interstate I-4, Interstate I-75, the Selmon Expressway (SR 618), and Port Tampa Bay. This connector allows direct access to the Port entrance, and was completed in January Four project photos are from FDOT and FDOT District Offices. Heckscher Drive and I-295 at JAXPORT, 11 PortMiami Tunnel at PortMiami, 12 Eller Drive Overpass at Port Everglades, 13 Lee Selmon Expressway at Port Tampa Bay, FDOT 2015 Florida Seaport System Plan 3-21

102 Chapter 3: Florida Seaport & Intermodal Freight Systems: Statistics, Trends, and Conditions FLORIDA S MOTOR CARRIER SYSTEM Historically, FDOT has been responsible for trucking industry regulations and enforcement on the state and federal highway system, but under new freight initiatives brought forth by the state, FDOT s role has changed. While FDOT remains in charge of issuance of heavy vehicle permits, the Florida Highway Patrol (FHP) has taken over the responsibility of compliance. In FDOT s Central Office in Tallahassee resides the Rail and Motor Carrier Operations Office, which is part of the Office of Freight, Logistics and Passenger Operations (FLP). This office is responsible for developing policies and projects, and addressing issues that arise related to the trucking industry. The Rail and Motor Carrier Operations Office has established an inhouse Motor Carrier Working Group that is committed to coordinating with industry stakeholders. In 2016, the office is developing a Motor Carrier System Plan to further identify statewide issues and needs that were identified in the Department s 2014 Freight Mobility and Trade Plan. Fast facts from the Motor Carrier office are shown in Figure 3-9. Figure 3-9: Florida Department of Transportation Motor Carrier Office Fast Facts FAST FACTS 46.7% DECREASE in fatal crashes involving commercial motor carriers from GREATER THAN 70% Florida Total Freight Tonnage was by Truck in 2011 Trucks are 8.6% OF VMT Vehicle Miles Traveled on the State Highway System in % MOTOR TAX AND were paid by the trucking industry in FEES % FEWER HARMFUL are produced by new diesel truck EMISSIONS engines than models prior to 1990 FDOT coordinates and administers funding for motor carrier operations through a number of federal and state programs, including Transportation Investment Generating Economic Recovery (TIGER) grants, Transportation Innovation and Finance (TIFIA) loans, State Infrastructure Bank (SIB) loans, and Strategic Intermodal System (SIS) and Growth Management Revenue (GMR) funds COMMODITIES BY TRUCK Florida s domestic and inbound landside commodity flow by truck accounts for over 71% of all Florida freight traffic flows in tonnage. Inbound commodities are identified to be significantly higher in total tonnage and value than cargo leaving the state. With so much more freight entering Florida than leaving Florida in 2011, the data helps to solidify the perception of the state s population as a consumption culture, both with visitors and residents Florida Seaport System Plan FDOT
103 Chapter 3: Florida Seaport & Intermodal Freight Systems: Statistics, Trends, and Conditions Florida s trucking industry provides a wide range of commodities inbound and outbound. The FMTP research points out the top 10 commodities destined to Florida by truck in tons made up over 40% of the total inbound tonnage by truck, and included: warehouse and distribution; liquefied gases, coal, and petroleum; distilled or blended liquors; lumber; fertilizers; misc. food preparations; prepared can goods; industrial organic chemicals; iron and steel; and, plastic products. Florida s top 10 outbound commodity tonnage that left the state via truck accounted for 62% of the total in The top 10 commodities in terms of total tons were: citrus fruit; concrete; warehouse and distribution; primary forest products; processed milk; chemicals for fertilizer; miscellaneous fresh vegetables; industrial inorganic chemicals; soft drinks or mineral water; and, gravel and sands. Citrus fruits, processed milk, and miscellaneous fresh vegetables were identified among the top 10 outbound commodities by truck, but are not within the top 10 of inbound, owing to the strength of Florida s agricultural industry. Warehouse and distribution centers appear in the top 10 for inbound and outbound commodities and illustrates the valuable role that manufacturing, value-added industries, distribution centers, intermodal logistics centers, and foreign-trade zones play for the state THE TRUCKING INDUSTRY IN FLORIDA The Rail and Motor Carrier Operations Office, with stakeholder coordination and outreach, has assembled some of the critical issues and trends that provide opportunities and identified challenges for the trucking industry. A sample of these include funding and impact on trucking costs, urban congestion, bottlenecks, driver shortages, security requirements, load restrictions, hours of service laws, tolls and facilities, intelligent transportation systems, exclusive truck facilities, seaport connectors, and intermodal logistics centers. Most trucking-oriented projects qualify for funding sources that focus on highway improvements and are based on diesel fuel taxes, tire fees, truck and trailer sales taxes, and heavy vehicle use taxes. This revenue stream helps fund the federal Highway Trust Fund and the State Transportation Trust Fund FUEL TAXES With respect to the trucking industry, fuel costs are a significant cost factor and the table below, Table 3-10, itemizes the various taxes imposed by competing states. State Gasoline Diesel Table 3-10: Fuel Taxes by State Gasoline Total State Plus Federal cpg Diesel Total State Plus Federal Excise 24.4 cpg Alabama Florida Georgia Lousiana Mississippi South Carolina Texas American Petroleum Institute, October FDOT, Freight Mobility and Trade Plan Investment Element, September FDOT 2015 Florida Seaport System Plan 3-23

104 Chapter 3: Florida Seaport & Intermodal Freight Systems: Statistics, Trends, and Conditions 3.4 RAILROADS, CONNECTORS AND TERMINAL OPERATORS Rail is a key link in the logistics chain, providing an intermodal connection for port and truck transfers to move goods to/from Florida s seaports. Florida s freight rail system consists of 2,758 route miles, excluding leases and trackage rights. The rail network is operated by two Class I railroads, CSX Transportation (CSXT) and Norfolk Southern Railway (NS); one Class II railroad, Florida East Source: JAXPORT CSXT Interchange, FDOT Seaport Office, 2015 Coast Railway (FEC); and 16 smaller local, switching, and terminal railroads, often called Class III railroads, or short lines. These freight railroads carried over 89.2 million tons of freight that originated in, terminated in, or traveled through Florida in 2013, including 8.3 million tons made up of shipping containers. Rail connections are integral parts of moving freight through Florida s seaports. Of the 15 seaports, 11 have rail connections, and one is currently exploring options to add rail service in the future. To emphasize the importance of rail to freight movements, of the 10 seaports that handled cargo in 2015, nine of them have on-port rail connections, and the sole active cargo seaport without direct rail connectivity, Port Canaveral, is considering rail alternatives. Additionally, five ports, Port Everglades, JAXPORT, Port Manatee, Port Panama City, and the Port of Palm Beach, have their own railroads or rail equipment to perform switching, on-port car movements, and on-dock-loading and off-loading. It should be noted that while the Port of Fort Pierce and the Port of Port St. Joe do have rail connections, these connections are currently inactive. Florida s rail system provides essential links to and from Florida s seaports, connecting them to the national freight rail system. These links can be seen in Table 3-11, below, and in Figure 3-10, on the adjacent page. Table 3-11: On Port Rail Service Port Port Everglades Port of Fernandina Port of Fort Pierce JAXPORT Port Manatee PortMiami Port of Palm Beach Port Panama City Port of Pensacola Port of Port St. Joe Port Tampa Bay Service Provider PERR, FEC, CSXT FCRD, FEC, NS, CSXT FEC, CSXT TTR, NS, CSXT MAUP, CSXT FEC, CSXT PPBD, FEC, CSXT BAYL, NS, CSXT AGR, BNSF, CSXT AN, CSXT CSXT Florida Seaport System Plan FDOT


105 Chapter 3: Florida Seaport & Intermodal Freight Systems: Statistics, Trends, and Conditions Figure 3-10: Florida Freight Rail Network Connections to Florida s Seaports In recent years, several of Florida s major container ports, such as PortMiami, Port Everglades and JAXPORT, have diversified their container throughput options with plans and projects to move a larger percentage of containers by rail. Projects have been undertaken by these ports in partnership with FDOT to develop onport and near-port Intermodal Container Transfer Facilities (ICTFs). These facilities enable the efficient transfer of container cargo to trains and allow for the efficient loading and handling of double stacked unit trains. Today, several of Florida s seaports have operating ICTFs and multipurpose rail terminals. Some of these facilities are highlighted in the next section. FDOT 2015 Florida Seaport System Plan 3-25

, invested $50 million to reconnect the Port to the national rail network through FEC s Hialeah rail yard.")


106 Chapter 3: Florida Seaport & Intermodal Freight Systems: Statistics, Trends, and Conditions RECENT RAIL IMPROVEMENT PROJECTS AT OR NEAR FLORIDA PORTS PORTMIAMI INTERMODAL CONTAINER TRANSFER FACILITY This on-dock ICTF reintroduced rail access to the port in FDOT, in partnership with PortMiami, Florida East Coast Railway (FEC), and the U.S. Department of Transportation (USDOT), invested $50 million to reconnect the Port to the national rail network through FEC s Hialeah rail yard. Restoration of this service provides the Port with the opportunity to move goods throughout Florida and into the continental U.S., supporting the Port s efforts to become a global logistics hub with access to 70% of the American population in 1-4 days. 16 PORT EVERGLADES INTERMODAL CONTAINER TRANSFER FACILITY This 42.5 acre Florida East Coast Railway ICTF facilitates the transfer of domestic and international containers, vehicles and equipment between ship and rail. It supports the Port s efforts to diversify its container handling capabilities between highway and rail. This facility has 18,000 linear feet of working track and can service trains up to 9,000 feet long. This ICTF provides shippers with viable options to move cargo to more than 70% of the U.S. population. 17 JAXPORT INTERMODAL CONTAINER TRANSFER FACILITY The JAXPORT ICTF facilitates the direct transfer of containers between vessels and trains, speeding up the shipment process. One inbound and one outbound unit train can run each day, and can carry 200 containers each. 18 PORT TAMPA BAY LIQUID BULK GATEWAY RAIL FACILITY This project provides Port Tampa Bay with a multipurpose rail terminal that has capacity for 100-car ethanol unit trains and also establishes on-dock unit train rail service to the Port s container terminal. This terminal adds 13,244 linear feet of rail infrastructure able to serve a range of general cargo needs along with major new capabilities in container handling with access to the CSXT intermodal network PortMiami Intermodal/Freight Rail Restoration, 17 Port Everglades ICTF by Florida East Coast Railway, 18 JAXPORT ICTF, 19 Port Tampa Bay, Florida Seaport System Plan FDOT
 play a key role in the logistics chain by supporting and enhancing Florida s seaports, airports, railroads,")
107 Chapter 3: Florida Seaport & Intermodal Freight Systems: Statistics, Trends, and Conditions 3.5 INTERMODAL LOGISTIC CENTERS AND DISTRIBUTION CENTERS Intermodal Logistics Centers (ILCs) play a key role in the logistics chain by supporting and enhancing Florida s seaports, airports, railroads, and highway connectors. These ILCs are defined in Florida statute as a facility or group of facilities serving as a point of intermodal transfer of freight in a specific area physically separated from a seaport where activities relating to transport, logistics, goods distribution, consolidation, or value-added activities are carried out and whose activities and services are designed to support or be supported by conveyance or shipping through one or more seaports listed in Section , F.S. Port Panama City Distribution Center ILC Project Source: Panama City Port Authority, 2015 Because these Intermodal Logistics Centers play such a significant role, Florida enacted legislation in 2012 to support ILC development, in the form of the Intermodal Logistics Center Infrastructure Support Program. The purpose of this program is to provide funds for roads, rail, or other means for the conveyance or shipment of goods through one of Florida s seaports. This enables the state to respond to private-sector market demands and meet the state s economic development goal of becoming a hub for trade, logistics, and export-oriented activities. 20 Over the course of the program, over $10 million has been allocated to ILC grant program recipients. Several different recipients have been funded, including the Port Manatee Commerce Center, South Florida Logistics Center, Prologis, Flagler Station III, Keystone, and the Port Panama City Intermodal Distribution Center. 20 Section , F.S. FDOT 2015 Florida Seaport System Plan 3-27
 are federally-designated, access-restricted, geographical areas in the U.")

108 Chapter 3: Florida Seaport & Intermodal Freight Systems: Statistics, Trends, and Conditions 3.6 FOREIGN-TRADE ZONES AND FREIGHT LOGISTICS ZONES Source: Miami Free Zone, FOREIGN-TRADE ZONES Foreign-Trade Zones (FTZ) are federally-designated, access-restricted, geographical areas in the U.S. generally located near international trade gateways, such as seaports and airports, that offer special administrative treatment of U.S. imports and exports. Commercial merchandise, both domestic and foreign, is able to receive the same U.S. Customs and Border Protection (CBP) treatment as if it were outside the U.S. The U.S. Department of Commerce s Foreign-Trade Zones Board designates specific facilities, such as industrial parks, warehouses, or factories within an FTZ, and CBP oversees the use of the facilities in the FTZs. 21 Foreign-Trade Zones are economic engines due to their ability to attract companies to manufacture, store, or move goods through facilities within the zone. Commodities may be held, assembled, repackaged, sorted, and labeled in the FTZ without being subject to CBP duties, tariffs, or other ad valorem taxes. This tax relief is designed to lower the cost of U.S. based operations engaged in international trade and create and retain employees and capital investment opportunities from those operations. Availability of FTZs boosts U.S. employment and business activity that otherwise might be located overseas. The ability to add value to goods through assembly or alteration within Florida, yet before being officially imported or after being officially exported, is one way businesses take advantage of FTZs. 21 U.S. Foreign Trade Zone Program, Florida Seaport System Plan FDOT

109 Chapter 3: Florida Seaport & Intermodal Freight Systems: Statistics, Trends, and Conditions Miami Foreign-Trade Zone Source: Miami Free Zone, 2016 The location of an FTZ may be within or adjacent to the boundaries of a port of entry, or, in some cases, individual warehouse facilities may qualify as a component of a larger multi-county or county designation. A facility is considered adjacent if it is within 60 miles/90 minutes driving time of the limits of the associated port of entry. An FTZ is able to contain up to a combined total of 2,000 acres in activated status, which may be comprised of several unrelated businesses and properties as long as they are used for FTZ activity or function as a magnet site intended to attract FTZ operators or users. Individual sites within FTZs are officially designated as subzones. To expedite FTZ designation for eligible facilities, an alternative site framework (ASF) process has been implemented which allows zones to use quicker and less complex procedures to obtain FTZ designation. The grantee of an FTZ can propose a service area and a subzone or usage-driven site can be designated anywhere in the service area within 30 days allowing any company to quickly be able to use FTZ benefits. The individual sites and their sizes within the service area of the FTZ itself have to be identified so that CBP can manage their oversight of the trade-related activity and assure that the trade-related activity is conducted in compliance with the law. To encourage their use however, the sites within an FTZ can be designated speculatively in advance of specific-trade related activity or business use, subject to sunset limits that are generally five years. This provides time to attract businesses and develop properties that will be used for FTZ activity, without any additional FTZ approval time being required. Currently, there are approximately 250 general purpose zones and over 500 subzones in the United States. Florida has 21 FTZs. The newest zone designated in Florida is FTZ No. 292, in Lake County. There are 12 Florida ports which have FTZs within their borders, adjacent, or nearby, providing value-added benefits for trade operations and include Port Canaveral, Port Everglades, Port of Fernandina, Port of Fort Pierce, JAXPORT, Port Manatee, PortMiami, Port of Palm Beach, Port Panama City, Port of Pensacola, Port of St. Petersburg, and Port Tampa Bay. FDOT 2015 Florida Seaport System Plan 3-29

110 Chapter 3: Florida Seaport & Intermodal Freight Systems: Statistics, Trends, and Conditions In 2014, the FDOT Systems Planning Office prepared a brochure entitled: Florida s Foreign Trade Zones and highlighted the following primary financial reasons for using Foreign-Trade Zones, which included: Duty Deferral - CBP duties on imports only have to be paid when the goods are transferred out of the FTZ into CBP territory (or to U.S. NAFTA partner countries Mexico or Canada). Duty Elimination - CBP duties can be eliminated entirely if goods are re-exported from the FTZ to another country (outside of the NAFTA region with Mexico and Canada). CBP duties also can be avoided for imported goods in the FTZ that are destroyed, such as duties on defective merchandise that cannot be sold but which otherwise import duties would still have had to be paid. Inverted Tariff Relief - This is when different tariff rates apply to products when transformed or incorporated into other products before entering CBP territory. The use of the FTZ for the location of the processing or transformation of the product allows the savings from use of the lower tariff rate. Ad Valorem Tax Exemption - Merchandise imported and held in an FTZ for purposes of storage, sale, exhibition, repackaging, assembly, distribution, sorting, grading, cleaning, mixing, display, manufacturing, or processing is exempt from state and local ad valorem taxes. Merchandise held in an FTZ for exportation, either in original form or altered by any of the above methods, is also exempt from state and local ad valorem taxes. 22 Businesses also benefit from having no time limits on how long goods may be kept within an FTZ, allowing entry of imports or shipment of exports to align with quota periods or tariff rate changes, or exporters to claim credits or duty draw back from shifting goods to exported status. Insurance costs may be reduced because merchandise in an FTZ is considered in the U.S. for insurance purposes. By lowering costs of activities associated with importing and exporting, there are positive impacts on Florida s employment and sales levels. Through reduced costs and improved cash flow, exporters can be more competitive selling overseas and consumers benefit through lower cost imports. 22 Florida s Foreign Trade Zones, Florida Seaport System Plan FDOT
111 Chapter 3: Florida Seaport & Intermodal Freight Systems: Statistics, Trends, and Conditions FREIGHT LOGISTICS ZONES Upon the completion of the statutorily-required FDOT Florida Freight Mobility and Trade Plan Policy (2013) and Investment Elements (2014), and with the ongoing federal discussion of freight mobility, the Florida Legislature continued exploring opportunities to enhance the movement of freight. In 2015, the Legislature created a new section in Chapter 311, F.S., entitled Designation of state freight logistics zones. In Section , F.S., freight logistics zones are defined as a grouping of activities and infrastructure associated with freight transportation and related services within a defined area around an intermodal logistics center as defined in s (2). 23 A county, or two or more contiguous counties, may designate a geographic area or areas within its jurisdiction as a freight logistics zone. The designation must be accompanied by a strategic plan adopted by the county or counties. Projects within freight logistics zones designated pursuant to this section, which are consistent with the Freight Mobility and Trade Plan, may be eligible for priority in state funding and incentive programs relating to freight logistics zones, including applicable programs identified in Parts I, III, and V of Chapter 288, F.S. 24 When evaluating projects within a designated freight logistics zone for purposes of determining funding or incentive program eligibility under this section, consideration must be given to: The presence of an existing or planned intermodal logistics center within the freight logistics zone, Whether the project serves a strategic state interest, Whether the project facilitates the cost-effective and efficient movement of goods, The extent to which the project contributes to economic activity, including job creation, increased wages, and revenues, The extent to which the project efficiently interacts with and supports the existing or planned transportation network, The amount of investment or commitments made by the owner or developer of the existing or proposed facility, The extent to which the county or counties have commitments with private sector businesses planning to locate operations within the freight logistics zone, and Demonstrated local financial support and commitment to the project, including in-kind contributions. Intermodal Logistics Centers are described in Section 3.5, and are a necessary component to freight logistics zone designation. As Section , F.S., becomes more widely known, the opportunities to utilize this designation will become more apparent. The next sections present data on international trade and discuss the factors and trends relative to international waterborne commerce and the seaport industry in the U.S. Southeast and Gulf of Mexico. 23 Chapter , Laws of Fla. (2015). 24 Chapter 288, F.S. FDOT 2015 Florida Seaport System Plan 3-31
112 Chapter 3: Florida Seaport & Intermodal Freight Systems: Statistics, Trends, and Conditions 3.7 U.S. WATERBORNE INTERNATIONAL TRADE Total U.S. Waterborne foreign trade had approximately a 2% decline in tonnage in 2015, as shown in Table 3-12, imports have seen a decline, due in part to a decline in petroleum imports, but also due to very slow bulk commodity recovery from the recession years of 2008 and Similarly, export tonnage went down slightly in 2015, but exports are still higher than the prior four years. In this same period, U.S. Waterborne trade, by value, had a significant drop of 15% in the value of exported goods. Table 3-12 and Figure 3-11 show the metric tonnage for the U.S. Waterborne trade for the years 2010 through During this period, imports saw a steady decline and exports witnessed increased activity. Table 3-12: U.S. Waterborne Foreign Trade Tonnage, in thousands (2010 to 2015) Year Imports 783, , , , , ,572 Exports 521, , , , , ,560 Total 1,304,934 1,342,588 1,292,540 1,257,036 1,287,655 1,265,132 Source: U.S. Census Bureau, U.S. Merchandise Trade, Selected Highlights (Report FT 920) In Figure 3-11, U.S. Waterborne trade displays an interesting national trend that is even more evident in Florida trade. Import and export deficit is tightening with imports declining over 112 million tons over the past six years. Exports have increased by almost 72 million tons over that same time period. Overall total waterborne international trade has remained relatively constant during the same period. 1,500,000 Figure 3-11: U.S. Waterborne Foreign Trade Tonnage (2010 to 2015) Metric Tons in Thousands 1,250,000 1,000, , ,000 Imports Exports Total 250, Source: U.S. Census Bureau, U.S. Merchandise Trade, Selected Highlights (Report FT 920) Table 3-13 displays a six-year breakout of U.S. Waterborne international trade from 2010 to 2015 in millions of current U.S. dollars. Overall, trade value is showing a major decline in 2015, after several relatively flat years from 2011 to Florida Seaport System Plan FDOT
113 Chapter 3: Florida Seaport & Intermodal Freight Systems: Statistics, Trends, and Conditions Table 3-13: U.S. Waterborne Foreign Trade Value (2010 to 2015) VALUE (Millions of Current U.S. Dollars) Year Change Imports $978,799 $1,159,096 $1,190,125 $1,148,319 $1,150,500 $1,051,960-9% Exports $455,460 $570,286 $592,122 $597,749 $602,771 $512,598-15% Total $1,434,259 $1,729,382 $1,782,247 $1,746,068 $1,753,271 $1,564,558-11% Source: U.S. Census Bureau, U.S. Merchandise Trade, Selected Highlights (Report FT 920) Figure 3-12, below, shows the decline described in the previous paragraph for imports, exports, and overall total waterborne trade by value. Figure 3-12: U.S. Waterborne Foreign Trade Value (2010 to 2015) U.S. Dollars in Millions $2,250,000 $1,750,000 $1,250,000 $750,000 Imports Exports Total $250, Source: U.S. Census Bureau, U.S. Merchandise Trade, Selected Highlights (Report FT 920) As mentioned previously, and shown in Table 3-14 below, petroleum imports experienced a decline during the period of 2010 through During the same period, U.S. petroleum exports experiences a steady increase in activity. Table 3-14: U.S. Petroleum Imports and Exports, Thousand Barrels (2010 to 2015) Year Imports 4,304,533 4,174,210 3,878,852 3,598,454 3,372,904 3,431,210 Exports 858,685 1,089,848 1,172,965 1,321,787 1,524,170 1,733,771 Note: Includes commodity grouping for crude oil, petroleum preparations, and liquefied propane and butane gas. Source: U.S. Census Bureau. FDOT 2015 Florida Seaport System Plan 3-33

114 Chapter 3: Florida Seaport & Intermodal Freight Systems: Statistics, Trends, and Conditions Petroleum Tanker Under Tow by Harbor Tugs at Port Everglades Source: Port Everglades, FLORIDA S INTERNATIONAL WATERBORNE TRADE Florida is a global hub for trade and logistics. The state s public seaports support trade partnerships with international markets all over the world. The growth in Asian trade as it relates to Florida ports shows up when you take a deeper look at Florida s total trade by waterborne value. Table 3-15 is a three-year look at total waterborne trade into and out of Florida ports and also shows the respective percent of change. According to the U.S. Census Bureau s 2015 data, Florida s largest waterborne trading partner is China, and Japan had the greatest percent of overall trade growth from 2014 to 2015, with over 8% growth in value. Venezuelan trade has plummeted, down 31% in waterborne trade in Japan, Honduras, Dominican Republic, and Costa Rica all saw positive growth in The total of the top 10 waterborne trading partners is more than 47% of the overall statewide waterborne trade total of $86.2 billion. Table 3-15: Florida s Top 10 Waterborne International Trade Partners in U.S. Dollars (2013 to 2015) Country Percent Change China $6,216,824,552 $6,570,579,602 $6,717,827, % Japan $6,057,292,984 $5,916,172,747 $6,392,213, % Dominican Republic $4,606,953,418 $4,785,828,140 $5,056,882, % Brazil $5,847,384,959 $5,711,540,645 $4,482,649, % Honduras $4,170,080,605 $4,225,504,041 $4,470,319, % Chile $4,272,881,161 $3,642,811,313 $3,510,392, % Venezuela $4,359,591,241 $3,967,266,385 $2,715,735, % Colombia $2,722,824,528 $2,833,457,415 $2,715,164, % Costa Rica $2,383,737,973 $2,582,619,368 $2,619,557, % Mexico $1,937,353,171 $2,660,484,377 $2,309,693, % Top 10 Total $40,990,437,254 Total All Countries $85,895,563,775 $86,800,474,305 $86,219,605, % Note: Values represented in current year U.S. Dollars. Source: U.S. Census Bureau, Foreign Trade Division, USA Trade, Florida Seaport System Plan FDOT
115 Chapter 3: Florida Seaport & Intermodal Freight Systems: Statistics, Trends, and Conditions FLORIDA S TOP INTERNATIONAL TRADE COMMODITIES Another metric to look at when discussing Florida s top waterborne trade is the commodities that are imported and exported via Florida s seaports. Table 3-16 describes the top 10 waterborne international commodities that transited to or from a Florida seaport during the period from 2013 to Table 3-16: Florida s Top 10 Waterborne International Commodities in U.S. Dollars (2013 to 2015) Commodity Percent Change Vehicles, except Railway or Tramway, and Parts $15,809,079,379 $15,152,669,060 $16,907,295, % Nuclear Reactors, Boilers, Machinery, and Parts Thereof $9,626,782,142 $9,512,968,176 $8,939,595, % Electric Machinery, including Sound and TV Equipment $5,456,896,163 $5,575,173,880 $5,333,625, % Mineral Fuel, Oil, Bituminous Substances, Mineral Wax $6,274,800,783 $6,640,678,567 $5,126,889, % Apparel Articles and Accessories, Knit or Crochet $4,625,223,571 $4,756,671,831 $4,927,782, % Optical, Photo, Medical or Surgical Instruments $2,123,327,389 $2,268,353,856 $2,304,791, % Fertilizers $2,082,861,020 $2,142,500,205 $2,027,963, % Plastics and Articles Thereof $1,999,354,657 $2,221,743,561 $2,013,132, % Furniture, Bedding, Lamps Not Elsewhere Specified, Prefab Buildings $1,686,703,249 $1,796,789,629 $1,966,523, % Beverages, Spirits and Vinegar $2,220,865,234 $1,865,451,766 $1,858,307, % Top 10 Total $51,405,906,698 Total All Commodities $85,895,563,775 $86,800,474,305 $86,219,605, % Note: Table includes Imports and Exports combined for total international waterborne commodity trade. Source: U.S. Census Bureau, Foreign Trade Division, USA Trade, 2015 Automotive and vehicle trade climbed more than 11% in Furniture and prefab building supplies grew as well at 9.4%. Other commodities that grew in value of total international trade through 2015 were apparel articles and optical medical imaging equipment. Plastic commodities have slowed slightly after strong growth in Mineral fuel, oil, bituminous substances, and mineral wax dropped in 2015, after experiencing almost 6% growth in FLORIDA S INTERNATIONAL TRADE BY VALUE OF IMPORTS AND EXPORTS Florida has been experiencing a major shift in international trade over the past five years, as shown in Figure Imports have been on the rise since 2011, and now account for 57.2% of all waterborne trade in Florida. In contrast, the proportion of exports relative to imports have decreased by 8 percent between the years 2011 and FDOT 2015 Florida Seaport System Plan 3-35
116 Chapter 3: Florida Seaport & Intermodal Freight Systems: Statistics, Trends, and Conditions Figure 3-13: Florida Waterborne International Trade Imports and Exports by Value (2010 to 2015) 60% 57.2% Imports 55% 52.7% Exports 51.6% 51.7% 50.5% 49.4% 50% 50.6% 48.4% 48.3% 49.5% 45% 47.3% 40% 42.8% 35% 30% Note: Imports and Exports through Florida Ports with a 2015 value basis of $149.9 billion U.S. dollars. Port Citrus, Port of Key West, Port of Port St. Joe, and Port of St. Petersburg do not have over dock cargo. Includes a miscellaneous category of $286M (2010 to 2015). Source: U.S. Census Bureau, Foreign Trade Division, USA Trade, 2015 The value of international trade for each of the Florida seaports in 2015 is shown in Figure Although there is a greater proportion of total international trade, by value, being imported rather than exported, the proportions vary for each Florida seaport. Figure 3-14: Florida Seaport Waterborne International Trade Imports and Exports by Value (2015) $30 Exports $25 $25.2 $25.0 $23.9 Imports $20 Billions of U.S. Dollars $15 $10 $5 $4.6 $3.0 $2.2 $1.1 $0.6 $0.4 $0.1 $0.0 $0 Source: Individual Florida Seaports, Florida Ports Council Florida Seaport System Plan FDOT

117 Chapter 3: Florida Seaport & Intermodal Freight Systems: Statistics, Trends, and Conditions 3.8 GLOBAL AND REGIONAL WATERBORNE TRADE TRENDS AND PATTERNS The global economy is moving but which way and how fast? This question formed the basis of the discussion at the American Association of Port Authorities (AAPA) 2015 annual Shifting International Trade Routes conference. In looking to the future, understanding what global and regional trade trends and patterns are developing and projected will guide planning, investment, and marketing efforts at home. These trends will reshape global trade flows, creating opportunities for Florida and other southeast states not seen since the Panama Canal opened more than 100 years ago. Florida is centrally positioned to reach one of the strongest and growing global markets with access to more than 1.1 billion consumers in the Western Hemisphere by Along with its position as a hub to major foreign markets, it is in one of the fastest growing U.S. business and consumer markets. The expansion of the Panama Canal, together with the growth in Latin American and Caribbean markets; the expansion and increased use of the Suez Canal; and the potential of expanded trade with Cuba create the opportunity for Florida to increase its role in linking the United States to Asia, Latin America, Europe, Africa and the Middle East. Below is a summary of the main developments highlighted in this section which will affect the Florida seaport system. Expansion of the Panama Canal Increased use of the Suez Canal Expansion of trade with Cuba EXPANSION OF THE PANAMA CANAL The expansion of the Panama Canal to accommodate the growth in the size of ships currently in service or on the order books will impact Florida seaports. 25 The question still unanswered is how and to what degree. In 2006, after a national referendum, the expansion and modernization of the Canal began. The decision to expand capacity by undergoing a $5.25 billion expansion project was viewed as a necessary undertaking to remain a competitive trade artery. Though delayed from its original completion date of 2014, the expanded Canal opened in June Container Ship Transits the Expanded Panama Canal Source: NBC News, June 26, 2016 The expanded canal will allow container ships capable of carrying more than 13,000 TEUs to transit the waterway, more than twice the vessel size that can pass through the existing locks. 25 Panama Canal Authority, Note: The Panama Canal Authority has indicated that it is seriously considering doing a study on building a fourth set of locks at an estimated cost of $17 billion to compete head-on with the Suez Canal for the world s largest ships, FDOT 2015 Florida Seaport System Plan 3-37

118 Chapter 3: Florida Seaport & Intermodal Freight Systems: Statistics, Trends, and Conditions Expanded Panama Canal, 2016 It is anticipated that Florida s container volumes will increase as a result of the expanded Panama Canal. Global trade seeks the most efficient, cost-effective routes to markets. Additional factors include access to the manufacturing centers which are located in areas based upon available resources, cost of energy, availability and cost of labor, rules and regulations, and connectivity to the shipping lanes. In recent years, the manufacturing center of Asia has moved to the south, to countries such as Vietnam. Increased costs, regulatory actions, Source: World Maritime News congestion, and work stoppages at the U.S. West Coast ports have refocused the Asian trade on a diversification of shipping alternatives. The Panama Canal expansion offers an all water route to the U.S. East Coast and the Gulf of Mexico, both providing access to the Florida market for imports and exports. Table 3-17 shows the relative distance and transit times for Florida and other U.S. East Coast and Gulf of Mexico seaports for ships utilizing the Panama Canal, and according to the SeaRates.com resource, Florida has the seven closest ports to the Panama Canal out of major Gulf and Atlantic U.S. ports. Other trends evident in the region include the development of transshipment hubs in the Bahamas, the Caribbean, and Central America, as well as in Panama, on both the Pacific Ocean and Atlantic Ocean sides of the country. Transshipment hubs are primary ports-of-call where large Post Panamax or E-Class container vessels too large for most U.S. ports (requiring 47 feet MLW drafts, larger gantry cranes to reach 18 to 21 containers wide, and air draft restrictions under major U.S. bridges) can sail to naturally deep ports like Kingston Bay, Jamaica or Freeport, Bahamas and trans load containers to smaller Panamax vessels that can navigate and berth at many U.S. ports on the Gulf of Mexico and along the Atlantic coast. New, larger class container vessels were designed to achieve greater economies of scale with the ability to carry twice as many containers, essentially utilizing less crew, fuel, and transit time than that of multiple smaller vessels. To be most profitable, these container vessels must make fewer port calls in a rotation and cut wharfage time to a minimum. From Hong Kong, China to Kingston Bay, Jamaica by ship, is 11,089 miles and 28.7 days of transit time and Freeport, the Bahamas, is 11,876 miles and 30.7 days of transit time, with both routes utilizing the Panama Canal. The utilization of these transshipment hubs and possibly others may impact Florida s role in the importation of discretionary cargo destined for the U.S. Southeast and Heartland. Florida seaports continue to invest in deeper water to accommodate the larger ships coming through the Canal, expand terminal capacity, and work with state and local entities to maximize landside connectivity in order to be a competitive alternative to other ports seeking these same trade opportunities Florida Seaport System Plan FDOT
119 Chapter 3: Florida Seaport & Intermodal Freight Systems: Statistics, Trends, and Conditions Table 3-17: Distance from Hong Kong, China, to Gulf and East Coast Ports through the Panama Canal Origin Hong Kong, China to Gulf and East Coast Ports Panama Canal Gulf and East Coast Destination Ports Distance (Miles) Transit Time (Days/Hours) Port Manatee, FL 11, PortMiami, FL 11, Port Tampa Bay, FL 11, Port Everglades, FL 11, Port of Port St. Joe, FL 11, Port Panama City, FL 11, Port Canaveral, FL 12, Mobile, AL 12, Gulfport, LA 12, Port of New Orleans, LA 12, Port of Fernandina, FL 12, JAXPORT, FL 12, Galveston, TX 12, Freeport, TX 12, Houston, TX 12, Charleston, SC 12, Savannah, GA 12, Corpus Christi, TX 12, Norfolk, VA 12, Baltimore, MD 12, NY/NJ 12, Note: Not all Florida Seaports were available from the following resource. Source: INCREASED USE OF THE SUEZ CANAL The Suez Canal provides the shortest maritime route between the Atlantic Ocean and the Indian Ocean connecting Southeast Asia and the Indian Sub-continent with Europe and the U.S. East Coast. As a crucial artery of global trade, it is a man-made, sea-level waterway with no locks running north to south across the Isthmus of Suez in Egypt and linking the Red Sea with the Mediterranean Sea. The Canal can now accommodate ships with a draft of 66 feet, accommodating 61.2% of the world s tanker fleet, 92.7% of the bulk carrier fleet, and 100% of the container ships all fully loaded. A 2014 undertaking constructed a new channel to accommodate faster two-way traffic. 27 Table 3-18 illustrates the distances from Dubai, UAE to Gulf and East Coast Ports through the Suez Canal. For Florida, developing a strategy and the infrastructure that allows Florida ports to be the first inbound port-of-call or last outbound port-of-call on the U.S. East Coast is a key factor in capturing more of the Florida-bound imports and Florida-origin exports. 27 The Suez Canal Authority, FDOT 2015 Florida Seaport System Plan 3-39
120 Chapter 3: Florida Seaport & Intermodal Freight Systems: Statistics, Trends, and Conditions Table 3-18: Distance from Dubai, UAE to Gulf and East Coast Ports through the Suez Canal Origin Dubai, UAE to Gulf and East Coast Ports Suez Canal Gulf and East Coast Destination Ports Distance (Miles) Transit Time (Days/Hours) NY/NJ 9, Norfolk, VA 9, Baltimore, MD 9, Charleston, SC 9, Savannah, GA 9, Port of Fernandina, FL 9, JAXPORT, FL 9, Port Everglades, FL 9, PortMiami, FL 9, Port Canaveral, FL 9, Port Manatee, FL 10, Port Tampa Bay, FL 10, Port of Port St. Joe, FL 10, Port Panama City, FL 10, Mobile, AL 10, Gulfport, LA 10, Port of New Orleans, LA 10, Galveston, TX 11, Freeport, TX 11, Houston, TX 11, Corpus Christi, TX 11, Note: Not all Florida Seaports were available from the following resource. Source: EXPANSION OF TRADE WITH CUBA Reaching back as far as the first Seaport Mission Plan, published in1990, the topic of resuming normal trade with Cuba has been listed as a significant issue for Florida s seaports. Due to the proximity of the state to Cuba and the cultural ties, expanded trade opportunities could be dramatic. Many U.S. companies, educational institutions, humanitarian consortiums, and public officials seek to better understand future opportunities Florida Seaport System Plan FDOT

121 Chapter 3: Florida Seaport & Intermodal Freight Systems: Statistics, Trends, and Conditions The picture of the Mariel Harbor Mariel Harbor Facilities facilities reveals a modern port which is within a Mariel Special Development Zone created in 2013, to drive foreign investment in the economic development of Cuba. The Zone is 28 miles from Havana, with modern rail and road connections to the capital city and other regions of the country. There are no restrictions on foreign ownership and a fast and agile project approval process has been developed to encourage investors to create manufacturing, production, and farming and agricultural activities. In 2015, a Logistics Activity Zone opened with both refrigerated and dry warehousing and additional projects are under construction to include a meat processing plant, industrial paints manufacturer, juice and drinks facility, heavy equipment leasing and service center, and a hotel supplies logistics provider. As the U.S. federal government continues to develop opportunities for travel and investments while still operating under the restrictions of the Helms-Burton Act, interest in trade with Cuba continues to be a prime focus of Florida seaports and the private sector. Interests also include the cruise industry, ferry and air transportation providers, the education and tourist sectors, and manufacturers of consumer goods. Though many other factors will affect the worldwide flow of trade, the above sections provide three significant determinants of Florida s role in the global and regional marketplace. To bring the picture into greater focus, the following section will provide a look into what steps Florida s competitors are taking to maintain and capture greater trade opportunities. 3.9 FLORIDA S U.S. SEAPORT COMPETITION The global and regional trends discussed above affect not only Florida, but also affect those states which compete with Florida for imports, exports, and domestic volumes. The U.S. South Atlantic and the Gulf of Mexico states from Virginia to Texas are competitors for cargo vessel calls and, in some cases, cruise passengers. They each have plans and investments aimed at growing their trade volumes. In the December 2014 study, Analysis of Global Opportunities and Challenges for Florida Seaports, it is estimated that the potential import and export market for Florida origin and destination goods available as additional containerized cargo to Florida ports is approximately 3.5 million TEUs annually. 28 Florida consumers are being serviced by trade moving by truck and rail from non-florida ports. The study continues to state that the key non-florida ports used by Florida importers of Asian cargo are Los Angeles and Long Beach California, and Savannah, Georgia. Key ports for imports from Europe include New York and Charleston. 28 FSTED Council (January 2015) Analysis of Global Opportunities and Challenges for Florida Seaports. FDOT 2015 Florida Seaport System Plan 3-41
122 Chapter 3: Florida Seaport & Intermodal Freight Systems: Statistics, Trends, and Conditions The following discussion will provide an overview of comparisons among these states and Florida, as well as highlight other activities in which these states have engaged. As mentioned previously, containers are the cargo flow that is the primary competitive element of port competition. Table 3-19 below shows the ranking of U.S. Atlantic and Gulf Container Ports by 2015 TEU counts. Table 3-19: Florida's Competitor Container Ports on the Gulf Coast and East Coast by total TEUs (2014 and 2015) Port 2014 TEUs 2015 TEUs New York/ New Jersey (NY/NJ Total) 5,772,303 6,371,720 Savannah (GA Total) 3,346,024 3,737,402 FLORIDA TOTAL 3,187,359 3,374,489 Hampton Roads (VA Total) 2,393,040 2,549,271 TEXAS TOTAL 2,043,306 2,229,448 Houston (TX ) 1,951,088 2,130,544 Charleston (SC Total) 1,791,977 1,973,204 Port Everglades (FL) 1,013,344 1,060,506 Miami (FL) 876,677 1,007,782 JAXPORT (FL) 936, ,292 Baltimore (MD Total) 770, ,314 New Orleans (LA Total) 490, ,875 Philadelphia (PA Total) 449, ,630 Wilmington (DE Total) 333, ,032 Wilmington (NC Total) 278, ,843 Palm Beach (FL) 262, ,277 Boston (MA Total) 214, ,166 Mobile (AL Total) 238, ,117 Gulfport (MS Total) 188, ,734 Freeport (TX) 92,218 98,904 Tampa (FL) 47,265 56,742 Panama City (FL) 36,624 33,790 Manatee (FL) 13,671 29,100 Source: American Association of Port Authorities, NAFTA Container Traffic, 2015 Port Ranking by TEUs Florida Seaport System Plan FDOT
123 Chapter 3: Florida Seaport & Intermodal Freight Systems: Statistics, Trends, and Conditions FLORIDA S PRIMARY COMPETITORS Statistics are an important gauge to measure progress, but at the same time, looking at what policies, strategies, and capital improvements have been implemented or are planned provides a broader understanding of where a neighboring state may be headed in comparison to Florida. The state of Florida has embraced the value of seaport activity for the jobs created by the maritime industry, the value-added components of goods movements, the economic benefits to the overall economy, and the benefits associated with providing a seamless, efficient transportation network for trade and passenger volumes. Other U.S. states also are pursuing similar goals and initiatives U.S. SOUTHEAST ATLANTIC SEAPORTS The state port authorities of Georgia (Port of Savannah) and South Carolina (Port of Charleston) have spent the past decade aggressively focusing development on their trade and logistics sectors. International and regional distribution and processing centers have been incentivized, planned and developed drawing large Beneficial Cargo Owners (BCOs) such as Home Depot and Walmart to the states. Georgia and South Carolina also are working on a transportation network to move cargo off-port to distribution centers and inland ports or Intermodal Logistics Centers (ILC s), including road and rail connections to move goods to and from the consumer markets in the U.S. Southeast and Midwest. The Atlanta freight network has established massive distribution centers which has played a significant factor for these state ports to grow their intermodal container operations. The Port of Savannah has become the fourth busiest container port in the nation just behind New York/New Jersey. As mentioned above, the Port of Savannah currently handles a significant portion of cargos originating from or destined to Florida. Perishables is an area of direct competition between Georgia and Florida. The recent successes of the Florida s ports cold treatment pilot programs have led to a new import business line of perishable fruits from Peru and Uruguay. Charleston, Corpus Christi and Gulfport also compete with Florida for this business. FDOT 2015 Florida Seaport System Plan 3-43

124 Chapter 3: Florida Seaport & Intermodal Freight Systems: Statistics, Trends, and Conditions South Carolina opened an Inland Port facility 212 miles from the Port of Charleston in The ILC is open to receive delivery of freight containers 24 hours a day and 7 days a week. South Carolina Inland Port Norfolk Southern serves the ILC through its main rail line, and the facility is positioned along the Interstate I-85 corridor between Charlotte, North Carolina and Atlanta, Georgia, where Norfolk Southern operates additional rail yards. The ILC also provides access to empty containers for regional shippers. North Carolina's Ports of Source: South Carolina Ports Wilmington and Morehead City, plus inland terminals in Charlotte and in the Piedmont Triad at Greensboro, serve as competitive alternatives to ports in neighboring states. North Carolina ports are owned and operated by the North Carolina Ports Authority (NCPA). Sprint container service via truck is available between the Port of Wilmington and Charlotte and points west and north. This matchback service is available only to customers of steamship lines with regular advertised service at the Port of Wilmington. In Virginia, two Class I railroads, CSX and Norfolk Southern, serve the Port of Virginia (Hampton Roads) via on-dock intermodal container transfer facilities at the Virginia International Gateway and Norfolk International Terminals. The Port of Virginia is a hub port, with nearly 30 international shipping lines servicing the port. In an average week, more than 40 international container, break-bulk and roll-on/roll-off vessels are serviced at the Port s marine terminals. The Virginia Inland Port (VIP) is an intermodal container transfer facility in Front Royal, Virginia (Warren County) owned by the Virginia Port Authority. VIP occupies 161 acres of land and is approximately 60 miles west of Washington, D.C U.S. GULF OF MEXICO SEAPORTS The states along the Gulf of Mexico also have taken steps to improve facilities to compete with Florida s seaports. At Mobile, the Alabama State Port Authority operates the state's full-service, deep water port, the Port of Mobile, on the Gulf of Mexico Florida Seaport System Plan FDOT

125 Chapter 3: Florida Seaport & Intermodal Freight Systems: Statistics, Trends, and Conditions Port of Mobile, Alabama Source: Alabama Power The Port of Mobile offers terminal services for shipping lines serving global trade lanes, with 41 berths, including intermodal transfer and handling, warehousing and security. The Port's container, general cargo and bulk facilities have access to two interstate systems, five Class I railroads, and nearly 15,000 miles of inland and Intracoastal Waterway connections. An air facility adjacent to the port offers air cargo freight forwarding services and two runways. The port's main channel is 45 feet deep and provides one of the deeper U.S. Gulf ports. The port's upper harbor channel is 40 feet in draft. In June of 2015, the Alabama State Port Authority announced the expansion of the APM Terminals with two new cranes and 20 additional acres at Choctaw Point. This expansion will compliment approximately $50 million invested by the Port Authority to construct an Intermodal Container Transfer Facility (ICTF) that could be serviced by five Class I railroads, including the Canadian National, CSXT, Norfolk Southern, Kansas City Southern, and BNSF. The ICTF had a first-quarter 2016 scheduled completion date. This facility provides shippers access to and from markets in the Midwest and Southeast regions. Within four miles of the APM Terminals facility, the European-based Airbus consortium is completing construction of a new $600 million final assembly line for the Airbus A320 aircraft. Major shipments of materials and equipment for the aircraft will likely come through the Port of Mobile. Mobile is expecting their freight to double and international trade to triple by The Mississippi State Port Authority owns and operates the Port of Gulfport. Located directly on the Gulf of Mexico, the port has short transit times to and from the first sea buoy marking the channel; no air draft restrictions; a Mississippi Export Tax Credit; and Foreign Trade Zone #92. FDOT 2015 Florida Seaport System Plan 3-45

126 Chapter 3: Florida Seaport & Intermodal Freight Systems: Statistics, Trends, and Conditions Geographically, the Port of Gulfport offers proximity to inland locations adjacent to the Mississippi River, as well as to Central America and a handful of South American markets. Other factors to consider include approximately 16 miles from the shipping lanes and five nautical miles from the Intracoastal Waterway; low cost available land in South Mississippi; north-south KCS Class I rail line that allows for higher speeds and double stacking of trains; geographic proximity of the crossing of three railroads in Hattiesburg, Mississippi; air cargo capacity at Gulfport-Biloxi International Airport, including capability for cold storage; and state tax incentives. Commodity types include refrigerated commodities such bananas, pineapples, other fresh produce, frozen poultry, and pork, while containerized dry cargo commodities include apparel, paper, cotton, lubricants, electrical equipment, automobiles, construction supplies and materials, and road-building machinery. Bulk commodities currently handled include ilmenite ore (used in the production of titanium dioxide) and crushed limestone, while break-bulk commodities recently included a large machinery press for the automobile industry and exported patrol boats manufactured in Mississippi destined for shipment overseas. Louisiana has a high number of ports and port-related infrastructure in large part due to its expansive waterway system. These ports provide state-owned cargo transfer facilities and equipment for many water-related industries. The majority of these ports (32) are members of Ports Association of Louisiana, a professional organization similar to the Florida Ports Council. The picture to the right illustrates the number and distribution of ports in Louisiana. The ports can be generally categorized into four broad categories: deep draft, inland, coastal, and developing. The majority of the Louisiana ports are considered shallow-draft inland or shallow-draft coastal ports. Generally, the shallow-draft inland ports are cargo- and/or industrially-based, while the coastal ports serve as industrial sites for water-related industries, for servicing the offshore oil and gas industry, and for commercial fishing in the Gulf of Mexico. The state s primary port, the Port of New Orleans is a major container port of interest and feeds the Mississippi River Valley with imports and supports the exports of bulk products. This port is also a cruise competitor of Florida Florida Seaport System Plan FDOT

127 Chapter 3: Florida Seaport & Intermodal Freight Systems: Statistics, Trends, and Conditions The most western of the Gulf Coast states is Texas, which serves two functions in the trade picture. Texas is a land bridge to Mexico, as well as a water connection to global trade. The picture to the right, shows the distribution of ports along the Texas coast. Texas has many ports both inland and developing, coastal and deep draft. The two major ports in Texas related to containers are the Port of Houston, with 2,130,544 TEU s in 2015, and Freeport, with 98,904 TEU s in The Port of Galveston handled 1,285,884 cruise passengers in 2014 according to American Association of Ports Authority (AAPA) and is the 5 th largest U.S. cruise port in revenue passengers just behind New York/New Jersey. Texas ports have closely followed Florida s example of seaport development and structure. Shortly after the FSTED Program and Council were created and the first annual Seaport Mission Plan was published, Texas transportation and port officials interviewed the staff of the Florida Ports Council. The goal was to learn how seaport infrastructure was funded in Florida, and what was the governing structure and statutory requirements of the ports. The creation of the Florida Ports Financing Commission and its subsequent issuance of infrastructure bonds also caught the attention of Texas. Texas has a Texas Ports Association with a mission to advance the development of Texas ports. Recognizing the importance of ports to the Texas economy, the Texas Strategic Economic Development Planning Commission, in 1998, recommended that ports be given due consideration in its 10-year statewide strategic plan. This included strengthening linkages between statewide transportation assets and national and international markets and developing a strategy to make Texas ports more desirable for commerce and enhance their trade development capacities. The Texas DOT has a Maritime Division which serves as a resource for state ports, works to address statewide maritime needs, and to help Texas ports remain competitive and prepare for growth. The division also participates in the Texas Freight Advisory Committee to coordinate the planning efforts of freight movement through ports and waterways. With respect to funding for port infrastructure projects, in their request to the Texas State Assembly, the Texas Ports Association supports funding what is known as the Port Access Account Fund from general revenues of the state of Texas. Chapter 55, Section of the Texas Transportation Code provides for the creation of the Port Access Account Fund as an account in the general revenue fund. The Texas Ports Association has identified the following major issues confronting Texas ports which parallel some of those frequently identified by Florida s seaport stakeholders: Dredging and dredged material management Environmental regulations Modern cargo-handling facilities needed to enhance trade More funding for port security Freight mobility to improve transportation connections to ports FDOT 2015 Florida Seaport System Plan 3-47

128 Chapter 3: Florida Seaport & Intermodal Freight Systems: Statistics, Trends, and Conditions HARBOR DEEPENING In response to the industry trend toward ever larger ships and the expansion of the Panama Canal, most major container ports are looking to deepen and widen their waterways and navigation channels. Charleston and Savannah have harbor deepening projects planned/underway as do the Florida ports of JAXPORT, Port Canaveral, and Port Everglades. Port Miami just completed (in 2015) their project to deepen the Miami cargo channel to minus 50/52 feet, making Miami one of the deepest U.S. ports. Port of Charleston, South Carolina Source: Charleston Regional Business Journal Charleston Harbor has a maintained harbor depth of -45 feet (13.7 meters) at mean low tide throughout the main shipping channel and -47 feet (14.3 m) in the entrance channel. A five-to-six-foot tidal lift provides even deeper access for several hours during the day, enabling Charleston to serve 11 post-panamax vessel calls each week. Charleston s deepening project began in 2011, when a USACE study determined that there was a federal interest in the deepening of Charleston Harbor and cited the project as eligible for public dollars. In 2012, the S.C. General Assembly set aside $300 million, the full estimated state share of the deepening construction costs, and the project was named one of President Obama s We Can t Wait initiatives, as was JAXPORT. The Port of Savannah has been seeking deeper water to make room for the supersized neo-panamax cargo ships expected to begin arriving through the expanded Panama Canal. Congress first authorized the harbor expansion in 1999, which mirrors the experience of Port Everglades. The estimated cost of the Savannah Harbor Expansion Project is $706 million, with the initial phase to deepen 17 miles of the shipping channel about half the total route between the port and the Atlantic Ocean at a cost of $134.5 million. The entire project will deepen 39 miles along the Savannah River by five feet, to minus 47 feet. The state of Georgia agreed to spend its $266 million share of the cost upfront. Most of that money is being spent on multiyear contracts beginning in As of spring 2016, Savannah has received federal funding of $42 million in fiscal years 2014 and The entire harbor expansion could be completed in 2021, at the earliest, but the construction schedule will largely depend on how quickly Congress funds its 60-percent share. If more funding is not available by mid-2016, the USACE may have to delay some upcoming contracts. The Port of Virginia currently offers 50-foot channels, inbound and outbound, and is the only U.S. East Coast port with Congressional authorization to dredge to 55 feet. The Port of Virginia harbor shelters the world s largest naval base; a shipbuilding and repair industry; an export coal trade; and the sixth largest containerized cargo complex in the U.S. The deepening efforts of Florida and its U.S. Southeast Atlantic coast competitors will continue to be a significant factor in shaping U.S. access to global trade lanes, international shipping interests, and markets across the globe Florida Seaport System Plan FDOT
129 Chapter 3: Florida Seaport & Intermodal Freight Systems: Statistics, Trends, and Conditions COMPETITIVE SUMMARY The competition for trade between seaports on the East and Gulf coasts is a prime factor in creating infrastructure investments and efficiency improvements. This competition serves to enhance the capabilities and efficiencies of the entire supply chain. Large container ships often call at multiple ports in a single route rotation, and having several viable and capable U.S. ports in a region gets the attention of the shipping industry, and over time, can serve to increase business at several ports. The sections above offer a glimpse into the competitive environment in which Florida s seaport system operates. As discussed, seaports and states are developing seaport facilities and trying to create inland intermodal networks linking seaports with the origins and destinations of cargo flows. Florida s challenge in this competitive environment is its perceived remoteness from the rest of the country; however, Florida has two very distinct advantages. The first advantage is the size and vibrancy of Florida s consumer market. This market is made up of 20 million permanent residents, 105 million out-of-state visitors, many of whom are there specifically to consume a wide variety of merchandise, as well as millions of seasonal residents who have consumption characteristics of both visitors and residents. The second advantage has to do with the peninsular geography of Florida. Florida s many seaports are served by a common inland intermodal network. Efficiency and capacity improvements to the common inland intermodal network of highways, rail lines, and distribution centers serve multiple ports along Florida s Atlantic and Gulf Coasts. These features create an environment conducive to importing and exporting both raw materials and finished products; thereby, creating opportunities for Florida-based manufacturing, as well as distribution and retail CONCLUSION Chapter three has provided seaport and intermodal freight statistics and background information on several topics including: Florida s Seaport and Strategic Intermodal System Networks, as they relate to seaports and waterways; the ILC Infrastructure Support Program; foreign-trade zones and freight logistics zones, and global, regional, and domestic trade trends and conditions; and, the activities and profiles of Florida s seaport competitors. The next Chapter recaps input from the seaports and stakeholders regarding issues, concerns, and plans for the future. FDOT 2015 Florida Seaport System Plan 3-49
130
 soughtout and")
131 4. SEAPORT AND STAKEHOLDER PERSPECTIVES 4.1 ADVANTAGES, CONSTRAINTS TO GROWTH, AND ISSUES AFFECTING THE FLORIDA SEAPORT SYSTEM To help frame this Five-Year Seaport System Plan, the Florida Department of Transportation (FDOT) soughtout and incorporated focused industry input from Florida s public seaports and stakeholders. This involvement provided a cross section of industry perspectives that were considered and incorporated in the Plan. To gather input, seaports, port tenants, stakeholder associations, and government agencies were asked to complete questionnaires regarding their views of the advantages and constraints to growth and the issues and needs affecting the Florida seaport system. The following sections include summaries and categorizations of the responses to the questionnaires, as well as interviews by phone or in-person STAKEHOLDER OUTREACH The FDOT Seaport and Waterways Office developed a list of key stakeholders and contacts from each public seaport, along with tenants and users at the ports; federal, state and local government agencies; and, related associations. A five-page Seaport questionnaire and a one page Tenants and Users questionnaire were developed for distribution to the stakeholders. Each of the key stakeholders received a personalized describing the strategic planning process and the importance of their participation. The overall response to the stakeholder outreach effort was strong, with 100% of the Florida seaports responding, along with three governmental agencies or associations, and 15 stakeholders (port tenants and users). A total of 33 stakeholders provided feedback, stakeholders participated in in-person interviews, provided feedback via conference calls, and/or sent in their written responses to the questionnaires. For a list of respondents, please see Appendix D-2. Many of the stakeholders interviewed conveyed their appreciation to FDOT for undertaking the effort to reach out to them and to discuss these key issues related to freight, logistics, and passengers at Florida s seaports. Finally, all the questionnaire responses and notes from each of the in-person and phone interviews were combined into a single stakeholder outreach summary matrix. The summary matrix was designed to show all of the identified challenges, issues, and opportunities. This input was communicated by stakeholders as either an advantages of the state s seaport system, a constraint to growth, or as an issue or need. As stakeholder input was reviewed and categorized, challenges, issues, and opportunities became apparent STAKEHOLDER OUTREACH SUMMARY MATRIX The Stakeholder Outreach Summary Matrix, grouped and subtotaled by Issue Category, can be found in Table 4-1. The subsequent sections provide various break down scenarios of stakeholder responses. FDOT 2015 Florida Seaport System Plan 4-1
132 Chapter 4: Seaport and Stakeholders Perspectives Table 4-1: Stakeholder Outreach Summary Matrix CIP Issues Category Category Identified Challenges, Issues and Opportunities Total Advantages Responses to Growth Constraints to Growth D A Deep dredge, harbor and/or channel capacity Issues Category List I A Highway Access or Bottleneck A Access C A Access to Markets CA Capacity B A Expansion of Mooring Areas EF Efficiency I A Rail Service (Terminal or On-dock Rail Access) E Environmental SS A Security Access F Funding CT A Vessel Size Increase N Navigation CT A Cruise Parking - Passenger Access R Regulatory and Governmental A Access T Trade 1 B CA Increased Bulkhead and Berthing Infrastructure C CA Cargo Handling Equipment Needs Port CIP Category List S CA Site Expansion Development Needs D Channel and Harbor Dredging and Deepening 2 C CA On-port Warehousing Improvements Needs C Cargo Terminals 3 C CA Bulk Cargo Expansion Needs B Berth Rehabilitation and Repairs I CA Rail Capacity (storage yards, sidings, passing tracks) CT Cruise Terminals C CA Reefer Cargo Needs (Warehousing or Reefer Plugs) M Miscellaneous Projects 4 O CA Off-port Distribution, ILC or Storage O Other Structures I CA Trucking Services Providers and Driver Shortages I Intermodal, Road, and Rail C CA Auto Cargo Expansion Needs RO/RO L Land Acquisition CA Capacity SS Security and Safety M EF Changing Technology I EF Rail Service Note: S EF Container Yard Densification Global Shifts, National Trends, Industry Change S EF Intermodal connections (i.e., Transloading) Including Spoil Projects SS EF Gate Operations Including New Berths and Equipment C EF Post Panamax Container Cranes Computer, Recreation, Environmental I EF Highway (Cruise and cargo traffic interaction) I EF Truck Parking (full service rest stops near ports) D EF Tidal Restrictions on Vessel Movement SS EF Bridge or Air Gap Clearance EF Efficiency C E Alternative Fuels - LNG/CNG, Ethanol, Wind Energy D E NOAA Marine Fisheries Service permit review (NMFS) S E Off-site Compensatory Stormwater Treatment E Environmental D F Local Funding (Matching Requirements) D F Federal Funding L F Land Acquisition and Purchasing B F Local Funding Match on Berth and Bulkheads D F Harbor Maintenance Tax (HMT) M F Private Sector Investments (P3) L F Funding for Freight Zones CT F Cruise Terminal Development SS F Security Funding I F Highway Trucking Tolls (Regional Movements) F Funding B N Bulkhead and Berthing Infrastructure SS N Navigation Issues (Vessel Traffic Delays) D N Maintenance Dredging SS N Bridge Issues (congestion, vessel air draft clearance) SS N Derelict Vessels N Navigation M R Educate Federal and State Lawmakers and Public I R Truck Regulations (HOS, weight limits, gate appt...) D R WRDA (Issue) D R USACE Joint Permitting Process SS R Security Regulations C R Customs and Border Protection - Cargo CT R Customs and Border Protection - Cruise R Regulatory and Governmental D T Panama Canal Expansion Project M T Studies, Plans, Economic Analysis M T Open Trade with Cuba (Helms-Burton Act) M T Data Acquisition and Technology M T Nearshoring of Manufacturing (international shift) M T Proximity to Caribbean, Central and South America M T Foreign Trade Zones (Manufacturing or Distribution) M T West Coast to East Coast Cargo Shift M T Jones Act Issues M T Container Line Alliance Issue T Trade Issues or Needs Grand Total Florida Seaport System Plan FDOT


133 Chapter 4: Seaport and Stakeholders Perspectives JAXPORT - Blount Island Terminal Berth 35 In Table 4-1, the overall Total Responses column shows the total of all responses for each item. The table is organized alphabetically by Issue Category with responses in descending order from most to least for each category. Sub-totals are shown for each Issue Category. Out of eight total Issue Categories, the top four identified Categories were Capacity with 121 responses, Efficiency with 104, Trade with 102, and Access with 91. The most often mentioned specific item was Bulkhead and Berthing Infrastructure with 21 total responses, followed by Cargo Handling Equipment and Site Expansion and Development Needs, both with 18 responses. Source: FDOT The pictures on this page depict projects that have recently been undertaken by the state s seaports, and which correspond to the two most identified challenges, issues, and opportunities: new bulkhead and berthing infrastructure and new cranes. Harbor Deepening and Channel Capacity had 17 responses, with 16 respondents identifying the topic as a constraint, issue, or need. PortMiami was the one respondent that saw Harbor Deepening as an advantage to growth after recently completing its deep dredge project. Studies and Economic Analysis were New Post Panamax Cranes at Port Tampa important to 16 respondents and Changing Technology had 15 responses. Additionally, there were five identified items that tied with 14 responses, including: Highway Access and Bottlenecks; Rail Service; Local Funding Match; Educating Lawmakers and The Public; and, Open Trade with Cuba. The stakeholder matrix can provide a variety of insights depending upon the method of subtotaling, sorting, or grouping of responses or category types. The three columns on the right side of the matrix segregate the responses into advantages, constraints to growth, and issues or needs identified by stakeholders and provide a perspective to the responses. The following sections will provide a discussion of the advantages, constraints, and issues mentioned by Source: Port Tampa Bay, 2016 the respondents. Tables 4-2 through 4-4 break down the most identified advantages, constraints, and issues and needs, both in numerical form, as well as a percentage of total respondents that identified each issue. FDOT 2015 Florida Seaport System Plan 4-3
134 Chapter 4: Seaport and Stakeholders Perspectives ADVANTAGES OF FLORIDA S SEAPORT SYSTEM This section focuses on perceived existing or future advantages that Florida s seaport system may have to leverage into growth opportunities. Table 4-2 shows the top identified global, national, or local trends or activities that may provide Florida s seaports and key stakeholders with opportunities to grow business and compete for market share. With Florida s ports being the closest U.S. mainland ports to the Panama Canal, it may come as no surprise that the number one identified opportunity for Florida ports, tenants, and users, was the Panama Canal Expansion project, which opened in June of In fact, the top six identified advantages were all related to trade or access to new or shifting markets. CIP Category Legend: D C M I A EF T Issues Category Table 4-2: Identified Advantages of Florida s Seaport System Identified Challenges, Issues and Opportunities Advantages to Growth Percentage of Total Responses D T Panama Canal Expansion Project 13 39% C A Access to Markets 12 36% M T Open Trade with Cuba 11 33% M T Proximity to Caribbean, Central and South America 10 30% M T Nearshoring of Manufacturing (International shift) 9 27% M T West Coast to East Coast Cargo Shift 9 27% M EF Changing Technology 8 24% I A Rail Service (Terminal or On-dock Rail Access) 6 18% I EF Rail Service 6 18% M T Foreign Trade Zones (Manufacturing or 5 15% Source: FDOT Seaport and Waterways Office, Florida Public Seaports, and Industry Stakeholders Channel and Harbor Dredging and Deepening (Including Spoil Projects) Cargo Terminals (Including New Berths and Equipment) Miscellaneous Projects (E.g. Computer, Recreation, Environmental) Intermodal, Road, and Rail Access Efficiency Trade (Global Shifts, National Trends, Industry Changes) The number two ranked response Access to Markets along with the number eight ranked response Rail Service were identified as A or Access under the Issues Category. Access to Markets was identified by seven seaports and five tenants or users as an advantage. Florida s unique geography, coupled with efficient landside rail and highway transport provides an advantage for North-South trade. Florida s proximity to the Panama Canal, Cuba, Caribbean, and Central and South America is another advantage to growing these markets. Advances in technology at Florida s ports, together with nearshoring of manufacturing in the Latin American basin, and the ability to utilize over 21 Foreign Trade Zones (FTZ) in Florida are major advantages. Direct access to Florida s large residential and consumer markets are also a strong advantage to Florida ports. 1 1 Florida s Foreign Trade Zones, Florida Seaport System Plan FDOT
135 Chapter 4: Seaport and Stakeholders Perspectives The results from industry interviews and questionnaires indicate that Florida s seaports, tenants, and users clearly recognize these opportunities for future growth, and that they remain intensely focused on leveraging them for future economic growth. The availability of rail access and efficiency to markets was an important advantage that has been realized with recent projects at Florida s major container and bulk ports having recently developed intermodal container transfer facilities (ICTF) and bulk transfer yards CONSTRAINTS TO GROWTH Although similar to issues or needs, constraints to growth were segmented to highlight challenges that were directly hindering the stakeholder s ability to expand or grow in one aspect or another. Table 4-3 shows the major identified Constraints to Growth. CIP Category Legend: I SS D A N EF F R Issues Category Table 4-3: Identified Constraints to Growth Identified Challenges, Issues and Opportunities Constraints to Growth Percentage of Total Responses I A Highway Access or Bottleneck 9 27% SS N Navigation Issues (Vessel Traffic Delays) 9 27% SS EF Gate Operations 8 24% D F Local Funding (Matching Requirements) 7 21% I EF Highway (Cruise and Cargo Traffic Interaction) 7 21% SS A Security Access 7 21% D A Deep Dredge, Harbor and/or Channel Capacity 6 18% D R USACE Joint Permitting Process 6 18% I R Truck Regulations (HOS, Weight Limits, Gate Appt...) 6 18% D EF Tidal Restrictions on Vessel Movement 5 15% Source: FDOT Seaport and Waterways Office, Florida Public Seaports, and Industry Stakeholders Intermodal, Road, and Rail Security and Safety Channel and Harbor Dredging and Deepening (Including Spoil Projects) Access Navigation Efficiency Funding Regulatory and Governmental The top identified constraints include Highway Access or Bottlenecks and Navigation Issues Causing Potential Vessel Traffic Delays. Gate Operations was another area identified as a constraint to efficiency and was discussed by many of the seaports and tenants. Some of the specific issues brought up during discussion included sharing gates, multiple gate access points to terminals, gate delays and backups, and a potential need for appointments or other rationalization strategies. Many of the smaller-to-medium-sized ports mentioned that providing local funding to match/leverage state grants was a constraint, especially with many ports needing to expand or repair aging bulkheads and berthing infrastructure. Some of Florida s cruise seaports and tenants discussed issues related to both vehicular and vessel traffic conflicts and/or congestion in areas where cruise and cargo operations interact. FDOT 2015 Florida Seaport System Plan 4-5
136 Chapter 4: Seaport and Stakeholders Perspectives Security measures that restrict access to terminals also were identified as constraints to growth, which is probably a contributing factor to the gate operation efficiency constraint, previously mentioned. While Deep Dredge, Harbor, and Channel Capacity was ranked seventh in the top constraints, it was ranked fourth overall, when also considering the responses from stakeholders that also saw it as an issue or need. This constraint speaks to the continuing need of Florida seaports to expand and maintain waterway access to increase efficiencies and capacities, and take advantage of opportunities to enhance growth through safely and efficiently handling larger vessels. The top two regulatory constraints identified included the U.S. Army Corps of Engineers (USACE) Joint Permitting Process and the challenges with Truck Regulations, with respect to hours of service, weight limits, and gate transaction systems. The tenth constraint mentioned was related to channel and harbor conditions that cause delays due to Tidal Restrictions or other vessel movement restrictions. The Mile Point project for JAXPORT, on the St. Johns River, is currently addressing one of these situations. 2 In addition to the constraints specifically mentioned in the above paragraphs and in Table 4-3, some of the other top constraints tied in the total number of responses. These constrains were just outside of the top 10, but were still significant to respondents. The additional responses with 15% or above included Harbor Maintenance Tax (HMT), Bulkhead and Berthing Infrastructure, Jones Act Issues, Trucking Services Providers and Driver Shortages, and Efficient Rail Service. For the complete list of responses for each response category type see Appendix D-3. 2 USACE - Jacksonville Harbor, Mile Point Project, Florida Seaport System Plan FDOT
137 Chapter 4: Seaport and Stakeholders Perspectives IDENTIFIED ISSUES OR NEEDS OF FLORIDA S SEAPORT SYSTEM Table 4-4 provides a glimpse into the top issues or needs, organized in decreasing order by the number of responses. CIP Category Issues Category Table 4-4: Identified Issues or Needs Identified Challenges, Issues and Opportunities Issue or Need Percentage of Total Responses B CA Increased Bulkhead and Berthing Infrastructure 17 52% C CA Cargo Handling Equipment Needs 15 45% M T Studies, Plans, Economic Analysis 14 42% S CA Site Expansion Development Needs 14 42% M R Educate Federal and State Law Makers and Public 13 39% B A Expansion of Mooring Areas 11 33% S EF Container Yard Densification 11 33% D A Deep Dredge, Harbor and/or Channel Capacity 10 30% C CA Bulk Cargo Expansion Needs 10 30% S EF Intermodal Connections (i.e., Transloading) 10 30% Source: FDOT Seaport and Waterways Office, Florida Public Seaports, and Industry Stakeholders Legend: B C M S D CA T R A EF Berth Rehabilitation and Repairs Cargo Terminals (Including New Berths and Equipment) Miscellaneous Projects (E.g. Computer, Recreation, Environmental) Site Improvements Channel and Harbor Dredging and Deepening (Including Spoil Projects) Capacity Trade (Global Shifts, National Trends, Industry Changes) Regulatory and Governmental Access Efficiency The top issue identified was the need for Increased Bulkhead and Berthing Infrastructure, which also falls under Berth Rehabilitation and Repairs in the port CIP categorization and is categorized as a capacity issue. There were 17 responses for this issue and 13 of them were from seaports. Some respondents also mentioned that the age and condition of this waterside infrastructure was a constraint to their growth, which makes this the number one overall identified topic. Cargo Handling Equipment Needs are a close second in the needs category, with 15 respondents identifying equipment as an issue or need, with 8 of those responses coming from tenants and users. In many of the inperson meetings with tenants and users, cargo handling equipment needs were discussed; primarily rubber tired gantries (RTG) and other container yard equipment. Some of these stakeholders were open to P3 funding opportunities to help expedite resolution of this need. More information on P3 funding can be found in the next section of this Plan. Studies, Plans and Economic Analysis was primarily identified as a need by the seaports, government agencies, and associations. This need pairs closely with the opportunity and need to educate federal, state and local lawmakers, as well as the public, on the advantages, constraints, and issues or needs of Florida s seaport system. FDOT 2015 Florida Seaport System Plan 4-7
138 Chapter 4: Seaport and Stakeholders Perspectives Out of the top identified issues or needs, four are capacity related, two were related to access, two were related to efficiency, and both trade and regulatory had one identified topic area. Areas that directly correlate with the seaports capital improvement plans included Berth Rehabilitation and Repairs, Cargo Terminals, Site Improvements, Channel and Harbor Deepening, and Miscellaneous Project Types SUMMARY OF STAKEHOLDER RESPONSES BY CATGORIES The overall picture of the stakeholder outreach responses can be shown by using various categorization methods to illustrate thematic commonalities. Table 4-5 shows responses grouped by port CIP project category subtotals. Table 4-5: Response by Port CIP Category Rank by Number of Responses CIP Category Identified Challenges, Issues and Opportunities Total Responses Advantages to Growth Constraints to Growth Issue or Need M Miscellaneous Projects (E.g. Computer, Recreation, Environmental) D Channel and Harbor Dredging and Deepening (Including Spoil Projects) C Cargo Terminals (Including New Berths and Equipment) I Intermodal, Road, and Rail B Berth Rehabilitation and Repairs SS Security and Safety S Site Improvements CT Cruise Terminals L Land Acquisition O Other Structures Grand Totals Source: FDOT Seaport and Waterways Office, Florida Public Seaports, and Industry Stakeholders The greatest area of responses overall was tied to the Miscellaneous Projects category which includes a variety of mostly trade related issues including studies, plans, and economic analysis; changing technology; education of federal, state, and local lawmakers and the public on maritime issues; open trade with Cuba; and, other trade related areas. About half of the responses for the Miscellaneous Projects category were seen as Advantages or Constraints to Growth and half were Issues or Needs. This level and breadth of response suggests that Florida s seaports are interested in, and dealing with, a wide range of issues, challenges, and opportunities. The second category, with over 100 responses, was Channel and Harbor Dredging and Deepening and included deep dredge as a topic, which had 17 total responses, 6 respondents seeing the item as a constraint, 10 as an issue or need, and 1 stakeholder saw it as an advantage. As previously mentioned, PortMiami recently completed their deep dredge to 50 feet, and therefore turned one of their limitations into an advantage. The second topic is this category was the Panama Canal expansion, with 16 total responses, including 13 as an advantage and 3 as an issue or need Florida Seaport System Plan FDOT
139 Chapter 4: Seaport and Stakeholders Perspectives The Cargo Terminals CIP category had 93 total responses and includes the topics of cargo handling equipment needs, access to markets, on-port warehousing improvement needs, bulk cargo expansion, alternative fuels, and Post Panamax cranes, with each of these topics receiving more than 10 responses each. Table 4-6 shows the responses grouped by Issues Category. The top categories identified were Capacity, Efficiency, Trade, and Access. Table 4-6: Response by Issues Category Rank by Number of Responses Issues Category Identified Challenges, Issues and Opportunities Total Responses Advantages to Growth Constraints to Growth Issue or Need CA Capacity EF Efficiency T Trade (Global Shifts, National Trends, Industry Changes) A Access F Funding R Regulatory and Governmental N Navigation E Environmental Grand Totals Source: FDOT Seaport and Waterways Office, Florida Public Seaports, and Industry Stakeholders Even though some topics may be hard to classify into a single category and almost all of the issues are interrelated, it is still helpful to distill the issues facing Florida s seaports into some general categories. Capacity as the number one issue category points to the fact that Florida Ports are experiencing and anticipating growth. The second category, Trade, represents the conditions and market opportunities that are the primary drivers of growth. The next two categories, Efficiency and Access, represent things that the ports need to accomplish in order to help create the capacity to handle growth. The next four categories, Funding, Regulatory, Navigation, and Environmental, represent the resources and complexities that must be assembled and managed to fulfill the ongoing missions of Florida s individual seaports and the seaport system as a whole CONCLUSION The above section has summarized the perspectives and the primary focuses of Florida seaports and key industry stakeholders as they plan and prepare for the future. The questionnaire and interviews synthesized the advantages, constraints, and issues and needs of the seaport system. Developing an understanding of the advantages that Florida seaports believe they have for growth, as well as the major constraints or road blocks they face, provides background and context for identifying and implementing initiatives and projects. In addition, identifying and understanding the critical issues and needs of the seaport industry as depicted by stakeholders, is integral for assisting in developing mitigation strategies and solutions. The next Chapter will focus on funding opportunities for seaports; their Five-Year Capital Improvement Programs; and the FDOT Five-Year Seaport Work Program. FDOT 2015 Florida Seaport System Plan 4-9
140
.")
141 5. SEAPORT INFRASTRUCTURE FUNDING AND INVESTMENTS Investments in seaport infrastructure support the development of jobs and the enhancement of the transportation of freight and people. Florida seaports quantify their infrastructure development goals in five-year Capital Improvement Programs (CIPs). To ensure that these investments are made, there are many different avenues that Florida s seaports can explore when looking for funding, both from the FDOT Work Program and from other local, federal, and private sources. This chapter provides an overview of several funding sources the seaports can explore; individual project details for several projects funded through the partnership between the seaports and FDOT; details each seaports five-year CIP; and, presents a look into the FDOT Five-Year Seaport Work Program. Investments in seaport infrastructure support the development of jobs and the enhancement of the transportation of freight and people. 5.1 SEAPORT INFRASTRUCTURE FUNDING This section presents a look at the resources available and/or needed to address those challenges and opportunities identified in Chapter four. The identified advantages for leveraging growth, constraints to growth, and issues or needs affecting the Florida seaports provide valuable insight and have been incorporated into the processes and considerations for garnering and focusing seaport resources into the future. Though most seaports generate the predominance of their operating and capital revenues from charges for the utilization of their facilities which include docks, wharfs, berths, warehouses, terminal facilities, commercial buildings, and land, the seaports benefit from a variety of funding authorizations and programs in partnership with the state, FDOT, and the federal government. Florida s seaports have a portfolio of available infrastructure funding resources. In addition to their own cash reserves, they have a variety of loan, bond, grants or contributions options. At the state level, FDOT currently has a statutory minimum of $100 million annually that must be allocated from the State Transportation Trust Fund (STTF) to the seaport program. This includes $25 million for the Florida Seaport Transportation and Economic Development (FSTED) Program; $35 million for the Strategic Port Investment Initiative (SPII) Grant Program; $25 million for debt service for the 1996 and 1999 bond programs; $10 million to support the 2013/2014 bond program; and, $5 million for the Intermodal Logistics Center (ILC) Support Grant Program. In addition to statutory minimums, additional funds can be provided through discretionary programs such as the Strategic Intermodal System (SIS) for eligible ports and/or projects. Generally, FDOT seaport grant funding requires that the receiving seaport provide local matching funds. Minimum local matching requirements are 50% or 25% depending on the project, type of funds, and other eligibility requirements. Ports also can apply for debt funding through the State Infrastructure Bank (SIB) loan program administered by FDOT. FDOT 2015 Florida Seaport System Plan 5-1
142 Chapter 5: Seaport Infrastructure Funding and Investments Potential federal funding can be applied for through the U.S. Army Corps of Engineers (USACE), the U.S. Department of Transportation, the Maritime Administration (MARAD), and the Department of Homeland Security (DHS). Occasionally, new federal funding programs will emerge, such as the TIFIA (Transportation Infrastructure Finance and Innovation Act) program in 1998, the TIGER (Transportation Investment Generating Economic Recovery) competitive grant program in 2009, the FAST Act in 2015, which included FASTLANE Grants and the Nationally Significant Freight and Highway Projects Program. Private funding can be found through public- private partnerships (P3s). To bring new business to Florida, Enterprise Florida, Inc., and the Department of Economic Opportunity (DEO) offer targeted industry incentives, workforce training incentives, infrastructure incentives, and special opportunity incentives. Available seaport funding can be generally sorted into the five categories listed below. The following subsections will provide detail into the funding types under each category. Seaport Revenues Public Private Partnerships (P3s) FDOT Statutorily Mandated Seaport Investment Programs FDOT Discretionary Programs Used for Seaport Investments Federal Programs SEAPORT REVENUES It is important to note that though ports may receive funds from many of the sources listed above, and outlined below, a primary source of port funding comes from revenues generated by the ports from fees charged to port customers. Florida s seaports may receive federal and state funding on a 50/50, 75/25, or other matching basis, for specific capital projects, but most of the capital improvements are made with internally generated funds. Seaports have several business models and generate revenues from a wide variety of activities and properties. Though some Florida ports receive operating funds through various local taxes, most port revenues are generated through land leases, user fees, dockage and wharfage fees, terminal operating agreements, and other fees based on cargo or passenger flows. The ports can use these revenues, as well as other local funds, as the match for state grants and loan guarantee programs PUBLIC-PRIVATE PARTNERSHIPS (P3S) Florida seaports may partner with their terminal operators, steamship lines, and other interested entities through P3 agreements to help finance, design, build, and manage major projects. This could mean the port completes port infrastructure, such as dredging and/or bulkheads, while the terminal operator invests in facilities such as needed warehousing which, in combination, yields value-added port capacity sooner than it may have been possible without the partnership. P3s also may be structured to shift risk to the private partner in return for compensation once the project is completed FDOT STATUTORILY MANDATED SEAPORT INVESTMENT PROGRAMS This section provides an overview of FDOT s seaport investment programs and statutorily mandated funding levels Florida Seaport System Plan FDOT
143 Chapter 5: Seaport Infrastructure Funding and Investments Florida Seaport Transportation and Economic Development (FSTED) Program Since 2012, the FSTED Program has been allocated a minimum of $15 million dollars annually. The 2016 Legislature increased FSTED Program annual funding by $10 million. In FY2016/2017, the FSTED Council willbegin allocating $25 million annually to Florida s seaports. The FSTED Council is made up of the port directors of the 15 publicly-owned seaports, a representative from DEO, and a representative from FDOT, and is authorized to allocate these funds to seaports. To receive funding from this program, projects must be consistent with local government comprehensive plans and port master and strategic plans, and the seaports must be able to provide a local match, usually a minimum of 50% or 25%, depending on project type and eligibility Strategic Port Investment Initiative (SPII) The SPII began in FY2012/2013, and requires that a minimum of $35 million annually be allocated to strategic port investment projects at Florida seaports. Strategic investment projects must help meet the state s economic development goal of becoming a hub for trade, logistics, and export-oriented activities, and these funds most often are used for projects that provide increased cargo capacity. SPII Projects are usually funded on a 50/50 or 75/25 matching basis, based upon project type and eligibility requirements Seaport Bond Programs There have been three primary bond issuances in the last 20 years referenced as the 1996, the 1999, and the 2014 (series 2013) bonds. The 1996 and 1999 bond proceeds were spent on projects completed by the mid-2000s and included both commerce and security projects. In 2011, these two bond Issues were refinanced, yielding more than $15 million in interest savings which have been reinvested in seaport infrastructure projects. In 2012, the Florida Legislature directed that annually, $10 million in transportation funding be made available to directly fund seaport projects, or provide debt service for bonds issued utilizing the proceeds to fund seaport projects. In FY 2014, the state allocated $150 million in bond proceeds for seaport projects. These projects fell into several general categories: channel dredging and deepening, cargo terminal expansion, berth rehabilitation, and cruise terminal improvements. The FSTED Council and FDOT developed the list of projects for allocation from projects identified by each of the ports as the top priorities needed to meet their planned goals. Projects funded under the bond program were funded on a 50/50 or 75/25 matching basis, as authorized INTERMODAL LOGISTICS CENTER (ILC) SUPPORT PROGRAM The ILC Support Program provides at least $5 million a year for intermodal logistics center projects which create or improve the movement of seaport freight along all modes of transportation. The project must show a benefit to the community, as well as demonstrate the improvement of freight movement within the affected region. No ILC applicant can request more than half of the available funding. While this program does not provide funding directly to seaport waterfront terminals, it supports the overall public freight system by requiring that the facility handle goods moved through one of Florida s 15 public seaports. Some ports have off-port intermodal distribution sites that have been eligible for ILC program funds. These funds are provided on a 50/50 matching basis. The ILC Program is scheduled to sunset in FDOT DISCRETIONARY PROGRAMS USED FOR SEAPORT INVESTMENTS This section provides an overview of some of the other financial resources FDOT may use to support seaport funding initiatives. FDOT 2015 Florida Seaport System Plan 5-3
144 Chapter 5: Seaport Infrastructure Funding and Investments Strategic Intermodal System (SIS) This is the primary state funding program used for SPII and other discretionary on-port investments. To receive these funds, seaports must meet SIS eligibility requirements and be designated as a SIS facility. These facilities represent the state s primary means for moving people and freight. Currently, 12 of the 15 public seaports are designated as either SIS facilities, emerging SIS facilities, or as planned additions to the SIS network, and; therefore, can apply for SIS funding. Projects funded by SIS are usually funded on a 50/50 or 75/25 matching basis depending on project type. FDOT also has other funding classifications that can be used for discretionary seaport infrastructure investments FDOT District Funds Each FDOT District Office has discretionary funds. These district discretionary funds can be used for funding several kinds of seaport projects. District funds also may be used to support port-related planning studies, such as seaport master plans. Projects funded through district discretionary funds are usually funded on a 50/50 or 75/25 matching basis State Infrastructure Bank (SIB) Loans The SIB is a revolving loan and credit enhancement program which offers two accounts from which to seek funding. The federally-funded account is capitalized by federal money matched with state money as required by law under the Transportation Equity Act for the 21st Century (TEA-21). All repayments are repaid to the federally-funded SIB account and revolved for future loans. Projects must be eligible for assistance under Title 23, United States Code (U.S.C.) or capital projects as defined in Section 5302 or Title 49 U.S.C. Projects must be included in the adopted comprehensive plan of the applicable Metropolitan Planning Organization (MPO) and must conform to all federal and state laws, rules and standards. The state-funded account is capitalized by state money and bond proceeds per Sections and , F.S. All repayments are repaid to the State Board of Administration where debt service is paid on any outstanding bonds with the remainder returned to the state-funded account and revolved for future loans. Projects must be on the State Highway System or provide increased mobility on the state's transportation system, or provide intermodal connectivity with airports, seaports, rail facilities and other transportation terminals. Also eligible are projects of the Transportation Regional Incentive Program (TRIP) per Section (4), F.S. Projects must be consistent, to the maximum extent feasible, with local Metropolitan Planning Organization (MPO) and local government comprehensive plans and must conform to policies and procedures within applicable Florida Statutes and other appropriate state standards for the transportation system. The state-funded account also allows for the lending of capital costs or to provide credit enhancements for emergency loans for damages incurred on public-use commercial deepwater seaports, public-use airports, and other public-use transit and intermodal facilities that are within an area that is part of an official state declaration of emergency per Chapter 252, F.S., and other applicable laws. The value of this program is to offer the ports an opportunity to finance a project, build it, and then repay the loan at a favorable interest rate and terms when the revenue stream anticipated from the project becomes a source of port funds. To date, five ports have utilized the SIB program: Port Everglades, JAXPORT, Port Panama City, and Port Tampa Bay, and Port Manatee Florida Seaport System Plan FDOT
145 Chapter 5: Seaport Infrastructure Funding and Investments FEDERAL PROGRAMS AVAILABLE TO SEAPORTS This section provides an overview of the most prevalent sources of Federal funding utilized by seaports U.S. Army Corps of Engineers (USACE) The USACE is responsible for implementing and managing a number of funding opportunities for flood and coastal storm damage reduction, commercial navigation, and ecosystem restoration. USACE is also responsible for maintaining authorized federal navigation channels such as port harbors and channels, primarily funded by the Harbor Maintenance Tax, an ad valorem tax of 0.125% on imports, domestic waterborne shipments, and cruise passengers. 1 Not only is maintenance dredging, both funding and scheduling, very important to the seaports, but to plan for future development and address the realities of larger and deeper draft ships, the ports continue to embark upon new widening and deepening projects. The USACE is the federal agency through which authorization and funding for new construction must flow. These projects require extensive reviews by the USACE and agency partners before being added to USACE s list of recommended projects which must also receive Congressional authorization. The Water Resources Development Act (WRDA) legislation is the primary congressional authorization for the USACE to implement key projects. Once authorized, in order to receive construction funding, Congress also must appropriate to USACE the federal cost-share amount before construction can begin. These funds are in addition to the local cost-share provide by the seaport. In some instances, this process has taken as long as 20 years to accomplish. With recent legislative changes, it is now possible for states and seaports to directly fund federally authorized navigation improvement projects with the possibility of future federal reimbursement. The Miami Deep Dredge project was accomplished under this scenario Department of Homeland Security Federal Emergency Management Agency (FEMA) Grants FEMA provides preparedness grants to develop and sustain capabilities at the state and local, tribal, and territorial levels in the nation s highest risk transit systems, ports, and along the nation s borders to prevent, protect against, respond to, recover from, and mitigate terrorism and other high-consequence disasters and emergencies. 2 The Port Security Grant Program within FEMA is specifically geared towards seaports and their private-sector partners and supports the building, sustainment, and delivery of core capabilities essential to achieving the National Preparedness Goal of a secure and resilient nation. 3 Florida seaports consistently have been awarded grants from this program for hardening their boundaries, purchasing security equipment, and supporting other asset assessments based upon elements of their U.S. Coast Guard approved maritime security plans. The 2016 Florida Legislature passed a bill which codifies the role of the FSTED Council Seaport Security Advisory Committee and creates a Seaport Security Grant Program. 4 Though no funding was provided for this new program in 2016, it may offer a complimentary program to the federal Port Security Grant Program. 1 American Association of Port Authorities, Water Resources FEMA, Grants FEMA, Port Security Grant Program CS/CS/HB 7061, 2016 Florida Legislature. FDOT 2015 Florida Seaport System Plan 5-5
146 Chapter 5: Seaport Infrastructure Funding and Investments United States Maritime Administration (MARAD) MARAD is a part of the U.S. DOT and promotes waterborne transportation as an integral part of the larger transportation system. Their program, America s Marine Highways, is a funding source for seaports. The vision of America s Marine Highways is the full integration of Marine Highway vessels and ports into the surface transportation system to ensure that reliable, regularly scheduled, competitive, and sustainable services are a routine choice for shippers. 5 Currently, the Marine Highway System is made up of over 29,000 nautical miles of many different waterways, such as rivers, bays, and channels, as well as coastal and open ocean routes. Florida is directly served by two Marine Highway Corridors, M-95 and M-10. Calls for Marine Highway Projects are published in the Federal Register every two years. The most current Call for Projects was published in 2014, and was open until June Transportation Infrastructure Finance and Innovation Act (TIFIA) Credit Assistance TIFIA provides credit assistance for qualified projects of regional and national significance. The TIFIA Program is administered and funded through the implementation of MAP-21, and provides federal credit assistance through secured loans, loan guarantees, and standby lines of credit to finance surface transportation projects of national and regional significance. TIFIA credit assistance provides better access to capital markets, flexible repayment terms, and potentially lower interest rates than can be obtained in private capital markets for similar instruments. Port access and intermodal freight projects, along with many seaport related highway, transit, and rail projects, are eligible for assistance Transportation Investment Generating Economic Recovery (TIGER) Discretionary Grant Program The TIGER Program invests in road, rail, transit, and port projects that aim to achieve national objectives. Since its creation in 2009, nearly $4.6 billion has been dedicated to projects that have a significant impact on the nation, a particular region, or a metropolitan area. It is a competitive grant program and applicants must detail the benefits their project would deliver for five long-term outcomes: safety, economic competitiveness, state of good repair, quality of life, and environmental sustainability. U.S. DOT also evaluates projects on innovation, partnerships, project readiness, benefit cost analysis, and cost share. 7 Florida ports have been awarded funding from this program over the years, but national competition is very strong. Program funding, requirements, and processes tend to vary from year-to-year making the investment in the grant application process a significant factor to consider when a seaport is determining if to apply. 5 America s Marine Highways. U.S. DOT. 6 U.S. DOT, Federal Highway Administration, TIFIA U.S. DOT, About TIGER Grants Florida Seaport System Plan FDOT

147 Chapter 5: Seaport Infrastructure Funding and Investments Fixing America s Surface Transportation (FAST) Act The FAST Act was signed into law in December It is unique, as it is the first law enacted in over 10 years that provides long-term funding certainty for surface transportation. The FAST Act s Nationally Significant Freight and Highway Projects Program will distribute funds to projects, including seaport projects that improve or enhance freight infrastructure through a competitive grant approach. The FASTLANE Grant program is a part of the FAST Act and was created to fund crucial freight and highway projects across the U.S. These projects must be of national or regional significance and should help promote a strong multimodal freight system. 8 This multimodal approach to federal transportation funding will facilitate funding improvement projects that affect seaports throughout the logistics supply chain. Funding of $4.5 billion is authorized for this program through CMA CGM Container Vessel Arriving at Port Canaveral Container Terminal Source: Canaveral Port Autority, U.S. DOT, FASTLANE Grants. USDOT Requests Applications for $800 Million New FASTLANE Grant Program. March FDOT 2015 Florida Seaport System Plan 5-7
148 Chapter 5: Seaport Infrastructure Funding and Investments 5.2 FLORIDA S SEAPORTS CAPITAL IMPROVEMENT PROGRAM (CIP) Florida s seaports reflect their investment priorities in their five-year Capital Improvement Programs (CIPs). The CIPs not only include anticipated funding from their own internal sources, but also include anticipated or desired funding from external public or private sources. As outlined earlier, funding sources external to the seaports can include FDOT; public and private capital markets; federal, state, and local programs; and, partnerships with port tenants, users, or other private investors. The CIPs identify the resources needed to address some of the challenges and opportunities represented by the issues discussed in chapter four. Annually, each of Florida s seaports compile a five-year CIP, which serves to identify both short-and longerterm needs. These CIPs were reviewed and summarized as a part of this Florida Seaport System Plan to provide an inclusive list of future seaport needs as defined by the individual seaports. The projects in the CIPs, for the five-year period beginning in FY2015/2016 and ending in FY2019/2020, total over $3.6 billion. The breakdown of CIPs for each seaport by each year is shown in Table 5-1. Table 5-1: Florida s Seaports Five Year Capital Improvement Programs (By Year) FY2015/ FY2019/2020 Port FY 2015/2016 FY 2016/2017 FY 2017/2018 FY 2018/2019 FY 2019/2020 Total Port Canaveral $136,938,000 $70,704,000 $142,630,000 $152,024,000 $142,992,000 $645,288,000 Port Citrus $0 $0 $0 $0 $0 $0 Port Everglades $178,516,000 $180,798,000 $187,477,000 $149,246,000 $96,515,000 $792,552,000 Port of Fernandina $475,000 $775,000 $1,000,000 $9,210,000 $8,410,000 $19,870,000 Port of Ft. Pierce $7,697,969 $0 $0 $0 $0 $7,697,969 JAXPORT $94,618,389 $277,859,490 $264,339,119 $319,446,250 $334,065,218 $1,290,328,466 Port of Key West $1,200,000 $0 $0 $0 $0 $1,200,000 Port Manatee $16,782,000 $17,477,000 $2,588,000 $7,990,000 $7,500,000 $52,337,000 PortMiami $88,855,000 $102,703,000 $55,220,000 $28,600,000 $15,600,000 $290,978,000 Port of Palm Beach $5,249,000 $5,736,000 $6,906,000 $3,200,000 $850,000 $21,941,000 Port Panama City $24,500,000 $16,550,000 $23,550,000 $6,200,000 $5,500,000 $76,300,000 Port of Pensacola $1,714,000 $4,816,145 $3,996,000 $6,304,000 $5,500,000 $22,330,145 Port of Port St. Joe $1,000,000 $35,900,000 $17,900,000 $0 $0 $54,800,000 Port of St. Pete $100,000 $615,000 $0 $0 $0 $715,000 Port Tampa Bay $47,734,000 $ 88,800,000 $66,800,000 $65,800,000 $89,300,000 $358,434,000 Total $605,379,358 $802,733,635 $772,406,119 $748,020,250 $706,232,218 $3,634,771,580 Source: Individual Seaport Capital Improvement Programs, provided by the individual Seaports and the Florida Ports Council Figure 5-1 graphically shows the year-by-year total, over the five-year period. The annual amounts increase from FY2015/2016 to FY2016/2017 by nearly $200 million, and vary between just over $605 million to $803 million. From FY2017/2018 to FY2019/2020, the forecasted CIPs decrease from $772 million down to $706 million Florida Seaport System Plan FDOT
149 Chapter 5: Seaport Infrastructure Funding and Investments Figure 5-1: Five Year Cumulative Seaport CIPs by Year (FY2015/2016 FY2019/2020) $900,000,000 $800,000,000 $700,000,000 $600,000,000 $605,379,358 $802,733,635 $772,406,119 $748,020,250 $706,232,218 $500,000,000 $400,000,000 $300,000,000 $200,000,000 $100,000,000 $0 FY 2015/2016 FY 2016/2017 FY 2017/2018 FY 2018/2019 FY 2019/2020 Source: Individual Seaport Capital Improvement Programs, provided by the individual Seaports and the Florida Ports Council The projects included in the CIPs span many different categories. Figure 5-2 illustrates how the capital improvements are broken down by project type. The top two project categories, Channel and Harbor Dredging and Deepening (including spoil projects) and Cargo Terminals (including new berths and equipment) make up over 53% of the total CIP projects. These project categories often go hand-in-hand, as the need for one affects the other. Dredging projects can be defined in several different ways, such as deepening a waterway, widening a waterway, expanding a turning basin, deepening a berth, or maintaining a channel. When a port wants to expand their waterway in order to accommodate larger ships with heavier loads, they must have federal authorization from the USACE to deepen or widen their channels and/or harbors. Additionally, ports often need to dredge to maintain their previously authorized depth (maintenance dredging). Depending on the amount of silting and natural shoaling, maintenance dredging may need to occur on a more regular basis at one port than at another. The costs of maintaining the preauthorized depth of a waterway is usually covered directly by the USACE and may not be reflected in the seaport CIPs. In the five-year time frame covered by the CIPs, JAXPORT and Port Everglades both have plans to deepen their channels. Port Canaveral is widening their turning basin, and Port Panama City is expanding into a new area that requires dredging of an additional channel to accommodate the port s expansion. The ports which are deepening their channels to accommodate larger ships are also looking to enhance or expand cargo terminals, facilities, and equipment to handle the larger ships. Miscellaneous Projects is the next largest category, and makes up 11% of the projects. Cruise Terminals and Berth Rehabilitation and Repairs each make up about 10% of project needs. FDOT 2015 Florida Seaport System Plan 5-9
150 Chapter 5: Seaport Infrastructure Funding and Investments Pertaining to Berth Rehabilitation and Repair, many of Florida s seaports have berths that were originally constructed five to six decades ago and are currently being improved or will need to be reconstructed in the next couple of years to maintain functionality and increase efficiency. Intermodal, Road, and Rail projects make up 5% of the total project needs, with Other Structures making up 4.2%. These intermodal projects and warehouse facilities are important, as several seaports are looking to grow their business and will need support infrastructure. Site Improvements, Land Acquisition, and Security combine to make up the remaining 5.5% of projects. Figure 5-2: Collective Florida Seaport Five-Year Capital Improvement Programs (By Project Category) FY2015/ FY2020/2021 $1,200,000,000 $1,000,000,000 $800,000,000 $600,000,000 $400,000,000 $200,000,000 $0 Channel and Harbor Dredging and Deepening (Including Spoil Projects): 29.4% ($1.1 billion) Cargo Terminals (Including New Berths and Equipment): 24.3% ($883.1 million) Miscellaneous Projects (E.g. Computer, Recreation, Environmental): 11.1% ($401.8 million) Cruise Terminals: 10.3% ($374 million) Berth Rehabilitation and Repairs: 10.2% ($370 million) Intermodal, Road, and Rail: 5.0% ($180.6 million) Other Structures: 4.2% ($154 million) Site Improvements: 3.7% ($136.2 million) Land Acquisition: 1.2% ($45.1 million) Security: 0.6% ($20.2 million) Source: Individual Seaport Capital Improvement Programs, provided by the individual Seaports and the Florida Ports Council Florida Seaport System Plan FDOT
151 Chapter 5: Seaport Infrastructure Funding and Investments The figures above have provided insight into the investment priorities and strategies of the Florida seaports as reflected in their five-year Capital Improvement Programs (CIPs). The cumulative total of more than $3.6 billion encompasses a multitude of projects across a wide variety of categories. The next section presents the FDOT Seaport Five-Year Seaport Work Program, which similarly reflects the focus areas of FDOT resources on seaport priorities. 5.3 FDOT SEAPORT WORK PROGRAM Through the financial support provided by FDOT s Work Program, Florida s seaports are able to capitalize on their own investments to ensure projects are funded and moving forward. FDOT s Work Program is guided by FDOT s Mission Statement: "The department will provide a safe transportation system that ensures the mobility of people and goods, enhances economic prosperity and preserves the quality of our environment and communities." Additionally, FDOT s long-and short-range goals and objectives are outlined in the Florida Transportation Plan (FTP), updated in 2016, which provides both a medium-range component that shows objectives and strategies needed over the next 25 years, and a long-term view of the future of Florida s transportation system over the next 50 years. Particular types of projects, such as the ones that are part of the Strategic Intermodal System (SIS), are FDOT s highest transportation capacity investment priority. Since 2011, FDOT s seaport investment totals nearly $940 million. Florida s Governor and Legislature have remained committed to investing in Florida s seaports. Since 2011, FDOT s seaport investment totals nearly $940 million. These investments funded many individual projects at each of Florida s seaports, including those identified in the beginning of this Chapter, such as the PortMiami Deep Dredge Project and the Southport Turning Notch Expansion at Port Everglades. Several ports received funding for intermodal container transfer facilities (ICTFs), such as those identified in Chapter three, and other ports received funding for cranes, new berths, cruise terminals, and cargo facilities. Additionally, outside of the Seaport Work Program allocations, FDOT funds roadway and intermodal projects that provide access to or from Florida s seaports. These projects are known as SIS connector (SISC) projects and include several notable projects, such as Heckscher Drive and I-295 project in Jacksonville, the PortMiami Tunnel project, the Eller Drive Overpass into Port Everglades, and the Selmon Expressway, which provides more direct highway access to Port Tampa Bay. Chapter three provides more details on these connector projects. Figure 5-3, on the next page, breaks down the statewide funding allocations specific to Seaport Work Program allocations, by year. FDOT 2015 Florida Seaport System Plan 5-11
152 Chapter 5: Seaport Infrastructure Funding and Investments Figure 5-3: Total FDOT Seaport Work Program by Year from FY2011-FY2016 $1,000,000,000 $900,000,000 $134,626,632 $800,000, $700,000,000 $132,197, $600,000, $500,000,000 $257,808, $400,000, $300,000,000 $158,845, $200,000,000 $100,000,000 $185,448,843 $0 $60,189,883 Note: Data from June 1, 2016 Snapshot. Source: FDOT Seaport Work Program, Florida Seaport System Plan FDOT
153 Chapter 5: Seaport Infrastructure Funding and Investments RECENT FDOT SEAPORT INVESTMENTS To help ensure Florida s ports stay competitive in all aspects of the trade and tourism industries, the state of Florida continues to partner with the ports and the private sector to invest in on-port capacity and infrastructure improvements, as well as off-port connectors and distribution centers such as intermodal logistics centers (ILCs). Recent major investments at Florida s seaports include dredging, terminal development, container handling equipment, new wharf construction, bulkhead redevelopment, and investment in intermodal container transfer facilities (ICTFs). Below is a brief description of the most recent five largest projects. PORTMIAMI DREDGE In 2015, PortMiami completed the Deep Dredge project, which deepened the cargo shipping channel and berths to below 50 feet. Project work included planning, permitting, design, environmental mitigation, construction for dredging, utility relocation, berth and bulkhead strengthening, and development of dredged disposal material sites. PortMiami is now among the deepest ports in the U.S. and is capable of accommodating neo Panamax vessels, which positions the port well for the newly opened Panama Canal expansion. PORT EVERGLADES SOUTHPORT TURNING NOTCH FDOT Investment: FDOT Investment: $112 million $86.8 million The Southport Turning Notch project increases the channel maneuvering area for ships using the southern portions of Port Everglades, expands the turning basin capacity, and provides for up to five additional berths. PORT TAMPA BAY HOOKERS POINT IMPROVEMENTS This project includes construction of new berths, improvements to cargo terminals, container yard expansion, and upland terminal improvements. FDOT Investment: $46.4 million JAXPORT MILE-POINT PROJECT The Mile-Point project is designed to correct strong crosscurrents that currently required local harbor pilots to place FDOT Investment: $43.5 million restrictions on large vessels during certain tidal moments. This project corrects those cross-current issues from a direct flow to a more fanned out natural movement, allowing the largest vessels calling on JAXPORT to enter the harbor without impacts from this restriction. PORT CANAVERAL CONTAINER TERMINAL The first phase of Port Canaveral s North Port Container FDOT Investment: Cargo Terminal opened in The Terminal Operator, Gulftainer USA, has made long-term investments in the infrastructure and equipment that allows Port Canaveral to efficiently handle container vessels. $21.7 million FDOT 2015 Florida Seaport System Plan 5-13
154 Chapter 5: Seaport Infrastructure Funding and Investments In addition to the five projects described on the previous page, each Florida seaport has received FDOT funding for at least one project since Example projects are highlighted below. PORT CITRUS: PORT OF FERNANDINA: PORT OF FORT PIERCE: PORT OF KEY WEST: PORT MANATEE: Port Feasibility Analysis Study of the viable options for port development. Warehouse Efficiency Improvements Update of warehouse facilities on port. Fishermans Wharf Development Acquistion of property. Mallory Square and Berthing Dolphins Improvement of mooring facilities. Berth 12 Expansion of the berth to accommodate larger vessels. PORT OF PALM BEACH: Slip 3 Repair and redevelopment of Slip 3 and berth 17. PORT PANAMA CITY: PORT OF PENSACOLA: PORT OF PORT ST. JOE: Purchase of a mobile harbor crane. Port Infrastructure Updates Improvement of port utilites. Dredging Design Project Design phase of channel and harbor dredging. PORT OF ST. PETERSBURG: Wharf Rehabilitation Repair and rehabilitiation of port wharf and terminal. The projects called out above were made possible through the funding partnership between FDOT and the individual seaports. To guide these investments, FDOT puts together a Five-Year Seaport Work Program. This Work Program is detailed on the next page. The FDOT Seaport Work Program for all funding types related to seaports is displayed in Table 5-2. This table shows a breakdown of project funding, as well as support funding for the seaport program, by year, from FY2014/2015 through FY2020/2021. For years FY2016/2017 to FY2020/2021 the programmed amount totals $683,262,891. This brings the total of Seaport Work Program allocations to over $1.5 billion for the period of FY2011 through FY2021. These projects and project types are further broken down in Table Florida Seaport System Plan FDOT
155 Chapter 5: Seaport Infrastructure Funding and Investments Table 5-2: Summary of Current FDOT Seaport Work Program for All Funding Types FY2015-FY2021 FY2014/2015 FY2015/2016 FY2016/2017 FY2017/2018 FY2018/2019 FY2019/2020 FY2020/2021 Total Port Canaveral $17,757,376 $2,000,000 $2,250,000 $5,000,000 $0 $10,000,000 $0 $37,007,376 Port Citrus $0 $0 $0 $0 $0 $0 $0 $0 Port Everglades $19,568,000 $12,000,000 $36,561,620 $6,000,000 $15,000,000 $52,750,000 $1,000,000 $142,879,620 Port of Fernandina $450,000 $0 $187,500 $3,650,000 $0 $0 $0 $4,287,500 Port of Ft. Pierce $542,500 $228,370 $255,000 $0 $0 $0 $0 $1,025,870 JAXPORT $4,100,000 $24,537,163 $20,900,000 $21,552,389 $19,943,560 $15,943,560 $39,943,560 $146,920,232 Port of Key West $762,000 $0 $0 $0 $0 $0 $0 $762,000 Port Manatee $4,214,432 $0 $0 $2,000,000 $0 $0 $0 $6,214,432 PortMiami $2,750,000 $3,563,588 $5,564,029 $6,000,000 $10,000,000 $0 $2,600,000 $29,799,777 Port of Palm Beach $5,914,005 $1,427,046 $750,000 $0 $3,000,000 $0 $0 $11,091,051 Port Panama City $1,768,500 $1,750,000 $12,565,000 $1,350,000 $1,250,000 $2,750,000 $0 $21,433,500 Port of Pensacola $1,008,381 $18,636 $840,000 $0 $0 $0 $0 $1,867,017 Port of St. Petersburg $50,000 $357,832 $0 $0 $0 $0 $0 $407,832 Port of Port St. Joe $0 $1,000,000 $0 $0 $0 $0 $0 $1,000,000 Port Tampa Bay $25,963,486 $14,671,648 $3,313,843 $6,009,064 $11,999,908 $0 $0 $61,957,949 SUBTOTAL $84,848,680 $61,554,283 $81,747,152 $51,561,453 $61,193,468 $81,443,560 $43,543,560 $465,892,156 FSTED N/A N/A N/A $25,000,000 $25,000,000 $25,000,000 $25,000,000 $100,000,000 Data and Planning $854,781 $1,307,818 $816,516 $300,000 $300,000 $300,000 $1,300,000 $5,179,115 Bond Debt Payments $33,594,388 $35,000,000 $35,000,000 $35,000,000 $35,000,000 $35,000,000 $35,000,000 $243,594,388 Potential Program Funds $0 $17,764,521 $15,729,627 $0 $0 $0 $14,302,066 $47,796,214 ILC Program $900,000 $5,000,000 $9,100,000 $5,000,000 $5,000,000 $5,000,000 $0 $30,000,000 Unallocated Seaport Funds N/A $10 $1,660,612 $964,877 N/A N/A N/A $2,625,499 SIB Loans** $12,000,000 $14,000,000 $19,000,000 $10,000,000 N/A N/A N/A $55,000,000 TOTAL $132,197,849 $134,626,632 $163,053,907 $127,826,330 $126,493,468 $146,743,560 $119,145,626 $950,087,372 Notes: Data from Work Program June 1, 2016 Snapshot. *FSTED funding was allocated to the individual ports for FY2014/2015-FY2016/2017. It has not yet been allocated to specific ports for FY2017/2018 through FY2020/2021. **SIB Loans not yet applied for or allocated for FY2017/2018 through FY2020/2021. Source: FDOT Seaport Work Program, 2016 Table 5-3 shows the largest eight projects currently programmed in the FDOT Seaport Work Program from FY2014/2015 through FY2020/2021. Each of these projects has an anticipated funding investment of over $10 million for this time period. The largest projects programmed are categorized into several project categories, with Channel and Harbor Dredging and Deepening making up 61%, Cargo Terminals (Including New Berths and Equipment) making up 34%, and Intermodal, Road, and Rail making up the final 5%. These projects make up over 67% of the project allocations in the Seaport Work Program. FDOT 2015 Florida Seaport System Plan 5-15
156 Chapter 5: Seaport Infrastructure Funding and Investments Table 5-3: Top Investment Projects in the FY2015-FY2021 Seaport Work Program (Over $10 million) Port Project Total Investment FY2014/2015-FY2020/2021 JAXPORT Channel Deepening and Widening $97,983,069 Port Everglades Deepening and Widening $94,250,000 Port Everglades Southport Turning Notch Expansion $38,999,620 JAXPORT Blount Island and Talleyrand Marine Terminal Improvements $24,187,163 PortMiami Post Panamax Cranes $17,374,189 Port Tampa Bay Container Yard Improvements $16,125,000 Port Canaveral On Port Rail Access $15,000,000 Port Tampa Bay Gantry Crane Purchase $12,000,000 Total allocation to large projects with over $10,000,000 of funding from FY2015/2021 $315,919,041 Note: Data from Work Program June 1, 2016 Snapshot. Source: FDOT Seaport Work Program, 2016 Figure 5-4 illustrates how the projects in the FDOT Seaport Work Program are broken down by project type. The top two project categories, Channel and Harbor Dredging and Deepening (Including Spoil Projects) and Cargo Terminals (Including New Berths and Equipment) make up 90% of the total Work Program projects. These projects are timely, and once their dredges are completed, JAXPORT and Port Everglades will join PortMiami as Florida seaports which will be able to handle larger ships. With the Panama Canal s expansion completed in 2016, additional neo-panamax vessels could potentially call at these Florida cargo ports more fully laden and ready to discharge a significant portion of their loads or be the first or last port-of-call headed to the global marketplace with exports. Many larger ships call at JAXPORT and Port Everglades already, but not fully loaded. Larger ships also mean that ports need to invest in larger and higher capacity container handling equipment and sturdier and more robust cargo facilities. In addition to the Panama Canal expansion, there are additional factors driving investment in cargo facilities including: shifting trade from the U.S. West Coast ports to the U.S. East Coast ports due to labor disputes, congestion, costs, and regulations; aging infrastructure which needs to be replaced or upgraded; and, also increased manufacturing and trade with South and Central America. After the first two project categories, the categorization percentages vary from the seaport individual CIPs. This is due to the fact that FDOT focuses its resources on a more limited range of projects. The seaports, on the other hand, have many different types of projects that are essential to manage operations which also need funding. This is because funding for new capacity projects and intermodal projects take precedence in the FDOT Seaport Work Program. This situation shifts financial responsibility for Berth Rehabilitations and Cruise Terminal projects to the seaports, and as such, reflects higher funding percentages in each port CIP than as shown in the Seaport Work Program. FDOT funding of Land Acquisition is also limited, currently only allowed under the FSTED Program funding, and making up 0.05% of the Seaport Work Program Florida Seaport System Plan FDOT
157 Chapter 5: Seaport Infrastructure Funding and Investments Figure 5-4: Specific Project Categories in the FDOT Seaport Work Program from FY2015-FY2021 $300,000,000 $250,000,000 $200,000,000 $150,000,000 $100,000,000 $50,000,000 $0 Channel and Harbor Dredging and Deepening (including Spoil Projects): 56.2% ($261.7 million) Cargo Terminals (Including New Berths and Equipment): 33.6% ($156.4 million) Intermodal, Road, and Rail: 5.5% ($25.4 million) Berth Rehabilitation and Repairs: 2.4% ($11.1 million) Site Improvements: 0.4% ($1.9 million) Miscellaneous Projects (e.g., Computer, Recreation, Environmental): 0.1% ($425,000) Land Acquisition: 0.05% ($255,000) Other Structures: 0.0% ($0) Cruise Terminals: 1.9% ($8.7 million) Security: 0.0% ($0) Source: FDOT Seaport Work Program, 2016 FDOT 2015 Florida Seaport System Plan 5-17
158 Chapter 5: Seaport Infrastructure Funding and Investments 5.4 CONCLUSION As shown in this Chapter, Florida s seaports have significant investment needs. These needs are addressed through each port s own resources, as well as establishing public and private partnerships for joint funding, grant allocations and awards, bond issues, and loans. FDOT s Seaport Work Program from FY2011 through FY2021 currently represents over $1.5 billion of financial support to the growth and development of Florida s seaport system. The previous Chapters have provided a history of the seaport system; a profile of the seaport system and individual seaport profiles; volume statistics and global, national and regional industry trends and patterns and market analysis; input directly from seaports and stakeholders; a survey of funding programs for seaport projects; documentation of seaport CIPs; and, a recap of FDOT s Seaport Work Program. The final Chapter highlights the strategies and focus areas that help guide the FDOT Seaport and Waterways Office in framing FDOT s seaport priorities and support programs. The final Chapter also links the FDOT Seaport strategies and focus areas to the overall mission, goals and objectives of FDOT, as well as the goals, objectives and strategies of the individual seaports and the realities and trends of the waterborne cargo industry, cruise markets, and other maritime businesses Florida Seaport System Plan FDOT
159 6. FDOT SEAPORT FOCUS AREAS AND STRATEGIES TO SUPPORT FLORIDA SEAPORTS Florida s seaports have significant investment needs. Chapter five presents a discussion of how these needs are addressed. Ports have access to a variety of funding mechanisms that include utilizing their own selfgoverned reserves and resources, engaging in public private partnerships for join funding, seeking grant allocations and awards, participating in bond series, and obtaining loans. FDOT is a primary funding partner for Florida seaports, providing over $1.5 billion of financial support to the growth and development of Florida s seaport system from FY2011 to FY2021. This Chapter provides a conceptual and strategic context for these investments and describes implementation strategies and focus areas to guide the FDOT Seaport and Waterways Office. These strategies and focus areas are the culmination of a concerted effort to address the broad aspects and trends of the seaport and trade industries outlined in Chapter three, the present realities of the Florida seaport system as described in Chapter two, the Florida specific issues raised in Chapter four, combined with the monetary realities of Chapter five. Chapter six highlights the focus areas and strategies that help guide the FDOT Seaport and Waterway Office in framing FDOT s seaport priorities and support programs. This Chapter also discusses how the strategies and focus areas relate to the characteristics of the Florida s seaport system and the realities and trends of the waterborne cargo industry, cruise business, and other maritime industries. Additionally, this Chapter describes how the Seaport and Waterways Office s focus areas and strategies seek to align with the overall planning efforts and policies of FDOT as expressed in the FTP Plan, SIS Policy Plan and FMTP Policy Element. The entirety of these goals, objectives, strategies, and focus areas provides a framework and context for implementation of Florida s Seaport program initiatives and projects that leverage advantages to growth, mitigate constraints to growth, and meet the needs of Florida s seaport system FLORIDA SEAPORT SYSTEM PLAN STRUCTURE This section outlines the 2015 FDOT Florida Seaport System Plan structure. The 2015 plan is an update of the 2010 FDOT Seaport System Plan. This plan considers the information in the 2010 plan as well as subsequent industry developments and planning efforts. This plan incorporates FDOT s prior and current planning efforts as they pertain to seaports. The focus areas and strategies presented in this plan provide insight on how the state s seaport program seeks to implement the planning policies of the Florida Transportation Plan (FTP), the Strategic Intermodal System (SIS) plan, and the Freight Mobility and Trade Plan (FMTP). FDOT 2015 Florida Seaport System Plan 6-1
160 Chapter 6: FDOT Seaport Focus Areas and Strategies to Support Florida's Seaports The goals and objectives of these prior and current planning efforts along with considerations of current industry factors and input from Florida s seaports and key stakeholders, provide the necessary foundation to develop focus areas, strategies, and initiatives to facilitate infrastructure improvements that are efficient, productive, safe, and reliable to allow the Florida seaport system to grow and develop in the near and long term. Chapter 1 Provides an introduction and history of the state seaport system Chapter 2 Provides seaport system profiles for each of Florida's fifteen public seaports describing services, infrastructure, commodities, and trade partners Chapter 3 Chapter 4 Provides a global, national, and statewide analysis of Florida seaport, intermodal freight, and industry statistics, trends, and conditions Provides an overview of the key issues impacting the Florida seaports and key stakeholders, providing direct industry related perspectives Chapter 5 Provides a summary of FDOT seaport related infrastructure investments along with Florida's seaport Capital Improvement Programs (CIPs) Chapter 6 Provides a summary of recent FDOT planning efforts and presents focus areas and strategies to address seaport issues The development of this plan relied heavily on industry research, data analysis, and stakeholder input to determine the current condition of Florida s seaports system and the critical issues that are impacting the seaports, tenants, and direct users. Interviews held with key stakeholders were instrumental in identifying the current conditions, challenges, and opportunities affecting Florida s seaports. Many of the stakeholders that participated included seaport tenants and users who have detailed knowledge of daily operations and conditions. The focus areas and strategies in this chapter are strongly based on these identified issues, trends, and conditions Florida Seaport System Plan FDOT
, FDOT s")
161 Chapter 6: FDOT Seaport Focus Areas and Strategies to Support Florida's Seaports 6.2 PRIOR & CURRENT PLANNING EFFORTS As described above, this plan is drafted to be consistent with Florida's latest planning efforts, which include the Florida Transportation Plan (FTP), FDOT s highest level policy plan, providing the long term vision and policy direction for the FDOT; the Strategic Intermodal System (SIS) Policy Plan, which provides policy objectives for the SIS on a statewide basis; and, the 2013 Freight Mobility and Trade Plan (FMTP), which provides policy and implementation direction to FDOT on matters related to the movement of freight. This current plan also continues to build upon the efforts of the 2010 Seaport System Plan. A summary of these plans as they pertain to Florida s seaport system is provided in this section FLORIDA SEAPORT SYSTEM PLAN The 2010 Florida Seaport System Plan was the first comprehensive analysis of the state s seaport system performed by the FDOT Seaport and Waterways Office. The System Plan provided background; developed an initial vision for Florida s seaport system; shared current trends and conditions; provided a performance outlook and identified needs, strategies and funding; and, provided implementation guidance to address the identified needs. Many of the needs and issues identified in the 2010 system plan are still applicable today. The five primary strategies and actions in the 2010 Seaport System Plan are outlined below: 1. Actively participate in the FSTED Program, providing a comprehensive review of on-port project applications. Develop and maintain database of seaport needs. Collect project information to support consistency reviews. Conduct consistency reviews. Engage in port allocation discussions. Participate in port planning activities. Continue to work to increase funding flexibility over time. 2. Identify, prioritize, and recommend seaport related off-port and intermodal projects. Develop and maintain database of seaport connector and intermodal needs. Collect project information to support evaluation and prioritization processes. Apply analytical tools. Engage in internal funding allocation discussions. Participate in port planning activities. 3. Develop and implement a program evaluation methodology. Develop performance measures for seaport program elements. Define protocols for implementing use of performance measures. Coordinate with seaport partners to build consensus of the program. Evaluate performance of specific projects. FDOT 2015 Florida Seaport System Plan 6-3

162 Chapter 6: FDOT Seaport Focus Areas and Strategies to Support Florida's Seaports 4. Integrate seaport planning activities with a larger state freight planning program. Develop a description of the integration of Florida s seaports in the overall freight system. Identify next steps in freight planning process and refinements. 5. Develop and implement an effective seaport specific outreach program. Develop public information material. Conduct outreach. Provide ongoing support to the statewide seaport system FLORIDA FREIGHT MOBILITY AND TRADE PLAN (FMTP) Signed into law in 2012, Florida House Bill 599 directed FDOT to create a state Freight Mobility and Trade Plan (FMTP). 1 The FMTP was developed and completed in two phases: the Policy Element and the Investment Element, each addressing specific needs, with their own purposes. Adopted in June of 2013, the Policy Element is intended to: Lay out the policy framework Identify responsibilities for implementation Meet all requirements of Florida House Bill 599 (2012) Adopted in September of 2014, the Investment Element builds on the Policy Element and is specifically intended to: Identify freight needs Identify criteria for state investments in freight Prioritize freight investments across modes Meet requirements of federal MAP-21 2 FMTP OBJECTIVES: 1. Capitalize on freight transportation advantages of Florida through collaboration on economic development, trade, and logistics 2. Increase operational efficiency of goods movement 3. Minimize costs in the supply chain 4. Align public private efforts for trade and logistics 5. Raise awareness and support for freight movement investments 6. Develop a balanced transportation planning and investment model that considers and integrates all forms of transportation 7. Transform the FDOT's organizational culture to include consideration of supply chain and freight movement issues , Laws of Florida 2 For more information on these requirements, please visit the MAP-21 website at: Florida Seaport System Plan FDOT

163 Chapter 6: FDOT Seaport Focus Areas and Strategies to Support Florida's Seaports ANALYSIS OF GLOBAL OPPORTUNITIES AND CHALLENGES FOR FLORIDA SEAPORTS Building on the conclusions set forth in the Florida Chamber Foundation s Florida Trade and Logistics Study and Update, (1.0 and 2.0), Florida seaports collectively embarked upon a detailed analysis of trade data to thoroughly understand the flow of commodities along domestic and international trade routes. In 2014, the Florida Ports Council on behalf of the FSTED Council completed an analysis of potential avenues to pursue to capture additional market share. In this publication, Analysis of Global Opportunities and Challenges for Florida Seaports, the opportunities, challenges, and strategies discussed below outline a path for growing jobs, tax revenues, and Florida s economy. 3 The study identified the following opportunities and challenges: OPPORTUNITY: Capture cargo now moving through non-florida ports by the adoption of an aggressive marketing program and by development of the necessary infrastructure for growth and connectivity. Source: Florida Ports Council, 2014 CHALLENGES: Currently, to service Florida s consumers and businesses, it is estimated that 3.5 million Twenty-foot equivalent units (TEUs) of containerized cargo come into Florida from non-florida ports, such as Savannah, Georgia and Charleston, South Carolina. The challenge is to understand the complex market parameters in order to make the prudent investments and marketing decisions based upon the size of carriers and existing trade routes. Deeper water and wider channels along with improvements to on-port facilities and to linkages to the highway and rail networks are essential to attract those ships providing first inbound and last outbound service capabilities. OPPORTUNITY: Attract import distribution centers and export-oriented manufacturing facilities to Florida by developing comprehensive strategies to make Florida a logistics gateway to the southeast. CHALLENGES: Florida seaports have a logistics cost advantage for Beneficial Cargo Owners (BCOs) such as Home Depot, Walmart, Rooms to Go, and IKEA, and carriers handling cargo exported out of Florida, for cargo headed into Florida, as well as for the discretionary market in the southeast U.S. Increasing this discretionary market will allow additional economies of scale for carriers to help reinforce their presence at Florida seaports. BCOs and Distribution Centers (DCs) are primarily located in the I-4 Orlando corridor, south Florida, and Jacksonville. Population growth is expected to be concentrated in the northeast and central Florida area which is a signal to all Florida ports to seek to service this market. As a consumer state, each year Florida has about 500,000 more trucks leaving empty and searching for cargo going northbound. The challenge is to encourage the private sector to locate their business and manufacturing centers in Florida which could balance out backhaul issues, reduce truck rates, and promote exports through Florida s seaports. 4 3 Analysis of Global Opportunities and Challenges for Florida Seaports, December 2014, Executive Summary. 4 Beneficial Cargo Owners (BCOs) - an importer that takes control of their cargo at the point of entry and does not use a third party source for distribution. FDOT 2015 Florida Seaport System Plan 6-5

164 Chapter 6: FDOT Seaport Focus Areas and Strategies to Support Florida's Seaports OPPORTUNITY: Work with policymakers and officials at all levels to streamline regulatory processes and ensure Florida s competitiveness in serving markets. CHALLENGE: The Study underscored the fact that fundamental and evolutionary changes are occurring within the global trade arena and must be considered by state and federal regulators to ensure that Florida remains competitive as the gateway for international trade. Florida is located near competing offshore transshipment hubs which have fewer regulatory mandates. Educating federal and state agencies and policymakers about the impact of regulatory processes is essential to discovering smart ways to implement safeguards which also promote a competitive trade environment. The Strategies identified in the study included the following: Continue to invest in port infrastructure and channel upgrades that will provide Florida with the ability to be the first inbound and last outbound port-of-call for import and export shipments. Create an aggressive marketing campaign to attract to Florida those Beneficial Cargo Owners (BCOs) and carriers that are importing and exporting cargo through non-florida ports. Provide necessary state or local incentives to entice import distribution centers and exportoriented manufacturing companies to locate in Florida. Remove or modify any undue regulatory burdens on Florida s freight system resulting in increased efficiency in moving trade through Florida seaports. The Florida Ports Council is planning the next step of developing a marketing and branding campaign to implement the above key identified strategy in the 2016/2017 timeframe. PortMiami Cranes Source: PortMiami, Florida Seaport System Plan FDOT


165 Chapter 6: FDOT Seaport Focus Areas and Strategies to Support Florida's Seaports FLORIDA S TRANSPORTATION PLAN UPDATE In 2015, FDOT updated the FTP and the SIS Policy Plans concurrently. The FTP defines Florida s future transportation vision and identifies goals, objectives, and strategies to accomplish that vision. The FTP is the statewide long-range transportation plan for all of Florida, while the SIS Policy Plan identifies policies for planning and implementing Florida s SIS, the statewide high-priority network of transportation facilities critical to Florida s economic competitiveness. The FDOT Office of Policy Planning is responsible for overseeing the updates to both the FTP and SIS Policy Plans. 5 The 2015 update to the 2060 FTP is comprised of three main elements: a Vision Element, a Policy Element, and an Implementation Element. The updated Vision Element (August 2015) provides a longer-term view of the major trends, uncertainties, opportunities, and desired outcomes shaping the future of Florida s transportation system over the next 50 years. A key purpose of the visioning effort is to guide the FTP update with consideration of the future Florida may face. To this end, FDOT developed five potential future alternatives for discussion and review. It is easy to think of many examples of how the potential futures may impact Florida s seaports. POTENTIAL FUTURES Return to Historic Growth. High growth in population, visitors, and the economy, with similar development patterns and industry mix as today. Rural Rediscovery. Focus on rural areas and small towns, including traditional industries such as agriculture and eco-tourism, as well as newer sectors. Global Trade Hub. Significant expansion in global trade, tourism, and investment. Innovation Hub. Emphasis on technology and innovation, particularly in urban centers. Risks on the Horizon. Florida s future is at risk due to slowing population growth, economic uncertainties, or extreme weather events and climate trends. The FTP Policy Element builds off of the direction provided by the Vision Element and input from the FTP Steering Committee and the public. It includes the goals and objectives necessary to guide FDOT towards this vision over the next 25 years. The draft Policy Element was completed in December The Policy Element contains seven long-range goals with 30 long-range objectives. 5 Florida Transportation Plan/SIS Strategic Plan, FDOT 2015 Florida Seaport System Plan 6-7

166 Chapter 6: FDOT Seaport Focus Areas and Strategies to Support Florida's Seaports FTP GOALS The seven FTP goals, as listed below, are not ranked in priority order given their interrelatedness and equal role in creating Florida s transportation future. The goals are as follows: Safety and security for residents, visitors, and businesses. Agile, resilient, and quality transportation infrastructure. Efficient and reliable mobility for people and freight. More transportation choices for people and freight. Transportation solutions that support Florida s global economic competitiveness. Transportation solutions that support quality places to live, learn, work, and play. Transportation solutions that enhance Florida s environment and conserve energy. The FTP goals are high level goals for the Florida transportation system as a whole. The success in meeting these goals depends on all modes of transportation. Each of the seven goals have emphasis areas related to seaport transportation. The final Element of the FTP is the Implementation Element, scheduled for completion in The Implementation Element is important as it provides specific direction and action items to be taken in order for FDOT and the state to meet the goals and objectives provided in the Policy Element. The FDOT Seaport and Waterways Office will remain engaged in the FTP process to identify responsibilities resulting from completion of the Implementation Element SIS POLICY PLAN UPDATE In 2015, the SIS Policy Plan was updated to be consistent with the guidance provided by the FTP. The SIS Policy Plan provides direction specific to the SIS, in order to address changing trends and take advantage of future opportunities. The SIS policy objectives also serve as guidance for investment decisions over the five-year implementation period of the plan Florida Seaport System Plan FDOT

167 Chapter 6: FDOT Seaport Focus Areas and Strategies to Support Florida's Seaports The SIS Policy Plan is based on three of the FTP goals that provide specific guidance to the SIS objectives. The three FTP and corresponding SIS Policy objectives are provided below: SIS POLICY OBJECTIVES The FTP sets a goal of efficient and reliable mobility for people and freight. The corresponding SIS objective is to ensure the efficiency and reliability of multimodal transportation connectivity between Florida s economic regions and between Florida and other states and nations. The FTP sets a goal of more transportation choices for people and freight. The corresponding SIS objective is to expand transportation choices and integrate modes for interregional trips. The FTP sets a goal of transportation solutions that support Florida s global economic competitiveness. The corresponding SIS objective is to provide transportation systems to support Florida as a global hub for trade, tourism, talent, innovation, business, and investment. These SIS objectives also form the basis for three new SIS areas of emphasis: interregional connectivity, intermodal connectivity, and economic development. In a similar format to the FTP Policy Element, for each FTP goal, the SIS Policy Plan provides an objective, with a variety of approaches proposed for implementation. Success in meeting the SIS Policy objectives will depend on all modes of transportation. Each of the three objectives have aspects related to seaport transportation. The remaining elements of the 2015/2016 FTP and SIS updates are revisions to SIS facility designation criteria and SIS project eligibility criteria. These criteria directly affect which seaports are part of the SIS and the type of seaport improvement projects that are eligible for funding. Any proposed changes to SIS eligibility will need to demonstrate a direct contribution to advancing one or more of the SIS areas of emphasis. Port Everglades Source: Port Everglades, 2016 FDOT 2015 Florida Seaport System Plan 6-9
168 Chapter 6: FDOT Seaport Focus Areas and Strategies to Support Florida's Seaports 6.3 STRATEGIC CHARACTERISTICS OF FLORIDA S SEAPORT SYSTEM The variety and diversity of Florida s seaports creates a wealth of opportunities for Florida businesses and citizens. The geographic dispersion of the state s seaports means that practically every region of the state has at least one seaport that potentially links that region with global economies. Seaport trade activity can be a principal tool supporting economic diversity and sustainability for local economies. Since 2013, FDOT has implemented a refined focus on freight, logistics and passenger operations, further institutionalizing the overall purpose of FDOT s Seaport and Waterways Office. By strengthening the viability and economic impact of Florida seaports through partnered and coordinated investments in seaport and intermodal infrastructure, the Seaport and Waterways Office plays a major role in improving the capacity and efficiency of Florida s waterborne commerce and maritime facilities. As shown in the seaport statistics and profiles in Chapter two, each seaport offers a unique set of geographic and facility attributes. Over time, seaports tend to establish specialties and niches as a result of these attributes. It is also common for seaports to have multiple areas of specialization. This diversity of functions, equipment and facilities, customers, cargos, and cruise provides long-term sustainability of the seaport and creates a more robust economy in local communities and the state as a whole. Table 6-1, on the following page, illustrates this diversity, both individually and as a system. In addition to specialization and diversity with regard to cargo types and facilities, ports may specialize in specific commodities or geographic trade lanes. For instance, Port Panama City handles more imports of copper metal than any other port in the United States, and JAXPORT is the nation s primary gateway to and from Puerto Rico and the nation s top automobile export port. Port Manatee is a primary port for orange juice, bananas, and melons, while the Port of Pensacola handles a large volume of massive wind turbine nacelles used in the wind power generation industry. Florida seaports large volumes of liquid bulk commodities are largely inbound petroleum fuels to serve Florida s airports and vehicles. The dry bulk commodities are both inbound and outbound flows of a widevariety of commodities including aggregates, cement compounds, fertilizer compounds, sugar, and wood pellets. When a port leases property to manufacturing companies or has manufacturing facilities in its immediate neighborhood, it creates a synergistic relationship where the port can be the conduit for inbound raw materials and outbound finished products. The Port of Fernandina has two paper mills in its immediate vicinity, and Port Panama City also has a local paper mill and major pipe manufacturer on port property. In addition, Port Panama City has an on-port manufacturer of utility cables used to support offshore drilling platforms. The Ports of Pensacola and Manatee also benefit from the close proximity of manufacturing facilities that produce very large and heavy components requiring port facilities for shipment. Port Tampa Bay also has several manufacturing and maritime-related industries located on and adjacent to port properties Florida Seaport System Plan FDOT
169 Chapter 6: FDOT Seaport Focus Areas and Strategies to Support Florida's Seaports The table below shows the range and diversity of each Florida seaport and the seaport system as a whole. Table 6-1: Florida Seaport Diversity of Cargo and Facilities Florida Seaports Totals Port Canaveral Port Citrus Port Everglades Port of Fernandina Port of Fort Pierce JAXPORT Port of Key West Port Manatee PortMiami Port of Palm Beach Port Panama City Port of Pensacola Port of Port St Joe Port of St Petersburg Port Tampa Bay Primary Activity Secondary Activity Overall Total Total Ports by Category Cargo 10 Container Break Bulk Liquid Bulk Dry Bulk Automobiles *Specialty Cruise 7 Homeport Port-of-Call Maritime Industry 8 Manufacturing Other Recreational-Hospitality 3 Marina Parks Hotels/Resturants Current Activity 15 Active Inactive Legend and Notes: Primary Activity Secondary Activity * Specialty cargo includes large power generators, large storage tanks, wind power turbines, oversized loads, solid rocket boosters, and other similar types of large cargoes. FDOT 2015 Florida Seaport System Plan 6-11
170 Chapter 6: FDOT Seaport Focus Areas and Strategies to Support Florida's Seaports 6.4 FLORIDA SEAPORT DEVELOPMENT: STRATEGIC CONSIDERATIONS The competition for trade between seaports on the East and Gulf coasts is a prime factor in creating motivation for infrastructure investments and efficiency improvements for almost all states in the region with maritime assets. This competition serves to enhance the capabilities and efficiencies of the entire supply chain. Large container ships often call multiple ports in a single route rotation, therefore having several viable and capable U.S. ports in a region gets the attention of the shipping industry, and over time, can serve to increase business at many ports. As discussed, competing seaports and states are developing seaport facilities and trying to create inland intermodal networks linking seaports with the origins and destinations of cargo flows. One of Florida s challenges in this competitive environment is the perceived remoteness from the rest of the country; however, Florida has two very distinct advantages. The first advantage is the size and vibrancy of Florida s consumer market. This market is made up of 20 million permanent residents, 105 million out-of-state visitors, many of whom visit specifically to consume a wide variety of merchandise, as well as millions of seasonal residents who have consumption characteristics of both visitors and residents. The second advantage has to do with the peninsular geography of Florida. Florida s many seaports are served by a common inland intermodal network. Efficiency and capacity improvements to the common inland intermodal network of highways, rail lines and distribution centers serve multiple ports along Florida s Atlantic and Gulf Coasts. These features create an environment conducive to importing and exporting both raw materials and finished products, thereby creating opportunities for Florida-based manufacturing as well as distribution and retail. An important consideration when discussing seaport growth opportunities is to distinguish between discretionary cargo flows and activities, versus more captive cargo flows and activities. Captive cargos and activities are characterized by a single port having a strong advantage to handle a certain cargo or business line. For instance, a port located adjacent to a paper mill that exports its product is much more likely to handle that cargo than a more distant port. Likewise, a port located in or adjacent to a metropolitan area is likely to be an inbound port for fuel, and an area with vacation and tourism venues provides opportunities to ports targeting cruise business. Discretionary flows are those flows that are more likely to have several viable port options when it comes to their supply chain. International cargo destined to the middle of the United States is an example of discretionary cargo, as the cargo has viable options from West Coast, East Coast, or Gulf Coast ports. With the continued growth of containerization and the efficiency that intermodal freight provides, opportunities for discretionary cargo generating competition for containers by ports have been created. For example, a large percentage of waterborne containers destined or originating in Florida use out-of-state ports as their international import and export gateways, and capturing this discretionary cargo is a huge growth opportunity for Florida s ports. The Panama Canal expansion, which provides a more efficient allwater route to Florida from the Asian market, along with growth in Latin American manufacturing are major developments which are supporting growth of Florida s ports Florida Seaport System Plan FDOT
171 Chapter 6: FDOT Seaport Focus Areas and Strategies to Support Florida's Seaports The unique geography of Florida is an important factor in framing the potential of Florida s seaport system. Florida s location at the Southeast corner of the continental United States aligns well with the four-corner strategy adopted by many supply chain players. 6 Yet, the peninsular shape of Florida, with its extension beyond the corner of the U.S. has been perceived as a negative factor for establishing Florida s peninsular seaports as gateways to the whole of the U.S; however, improvements to Florida s peninsular seaports and rail and highway intermodal networks are mitigating this perception. The peninsular shape provides a unique efficiency advantage, in that the highway and rail networks along Florida s peninsula effectively serve multiple ports providing mutual benefits from improvements made to the rail and highway networks along Florida s Atlantic and Gulf coasts. Florida is the only U.S. state with seaports located on two major ocean bodies, the Atlantic Ocean and the Gulf of Mexico. 6.5 FDOT SEAPORT STRATEGIES, FOCUS AREAS, AND INITIATIVES The primary purpose of the FDOT Seaport Program is to allocate resources to Florida s seaports to support sustainable seaport growth and development and to promote positive economic benefits from seaport activities throughout the state. Seaport operations and the flow of waterborne goods and passengers throughout Florida relate directly to FDOT s seven goals as presented in the FTP and summarized above. Conducting the FDOT Seaport Program serves to achieve the Department s goals and objectives by implementing strategies, actions and initiatives to develop and enhance Florida s seaport system. The remainder of this chapter presents the Seaport Program s Focus Areas, Strategies and Initiatives. Appendix A-1 provides a cross-walk table that outlines how the FDOT 2015 Florida Seaport System Plan Focus Areas and Strategies relate to the FTP Goals, SIS and FMTP Objectives. FDOT S SEAPORT FOCUS AREAS, STRATEGIES, AND INITIATIVES The following seaport program focus areas and strategies are an articulation of the principles and approaches that the Seaport and Waterways Office uses to strategically guide our day-to-day activities and carry out the purpose of the Seaport Program. The initiatives offer specific examples of how applying the strategies to the focus areas manifest in specific projects and actions to improve infrastructure and operations at Florida seaports and in the overall freight and cruise passenger logistics chains. 6 The strategy of a supply chain company (BCO/3PL/Ocean Carrier) to have a presence in each of the four corners of the U.S. (Northwest/Southwest/Northeast/Southeast). FDOT 2015 Florida Seaport System Plan 6-13
172 Chapter 6: FDOT Seaport Focus Areas and Strategies to Support Florida's Seaports FDOT SEAPORT PROGRAM FOCUS AREAS The Focus Areas described below categorize the major functional aspects of the infrastructure elements that are the primary investment targets of the FDOT Seaport Program. Seaport Access Enhancement: Near-port waterway and landside infrastructure that provides safe and sufficient access to and from seaports for vehicles, railcars, vessels, cargo, and passengers. While landside highway, road, and rail access to seaports is a major focus of the highway and rail divisions of FDOT, the seaport program focuses on improving the state s navigable waterways, channels, and harbor basins. Seaport Capacity Expansion: On-port infrastructure, equipment, and systems to increase the ability of seaports to handle growing or new volumes of passengers, cargo, or maritime activities. Facilities may include wharfs, terminals, cargo handling equipment, warehouses, and rail transfer facilities. Seaport Efficiency Improvement: On-port infrastructure, equipment, and systems to safely improve the efficiency of vehicle, cargo, or passenger movements within port operational areas. Facilities may include gate structures and systems, cranes, and other specific terminal yard or inter-terminal circulation configurations and systems. Waterborne Freight Supply Chain Optimization: Off-port infrastructure and systems to increase the volumes and efficiencies of waterborne cargos as they move through inland intermodal systems. Components of the off-port intermodal systems include: rail lines, inland transfer yards, Intermodal Logistics Centers (ILCs), warehousing and distribution facilities, export-oriented manufacturing, and Foreign-Trade Zone (FTZ) facilities. FDOT SEAPORT PROGRAM STRATEGIES These are the methods and approaches that are used to address the focus areas described above. 1. Use state resources to leverage local, private, and federal investments in Florida Seaports. 2. Collaborate with seaports and industry stakeholders to identify and fund the areas of greatest need and opportunity. 3. Monitor local, regional, statewide, national, and global industry events, issues, and trends to ensure the relevance of Florida seaport investments and initiatives. 4. Collect and analyze data to track the effectiveness of investments over time, and to identify new or emerging issues or trends. 5. Partner with seaports to address specific problem areas, or to explore new technologies or systems to enhance seaport efficiencies, capabilities, and capacities. 6. Coordinate with intermodal industry partners and agencies to ensure multi-modal connectivity and coordination in seaport and intermodal network development. 7. Facilitate local, state, and federal agency responsiveness to Florida seaport issues and opportunities, through outreach, education, coordination, and collaboration. 8. Work with seaport and maritime stakeholders to support and create educational and employment training opportunities for seaport, supply chain, and maritime-related businesses Florida Seaport System Plan FDOT
173 Chapter 6: FDOT Seaport Focus Areas and Strategies to Support Florida's Seaports FDOT SEAPORT PROGRAM INITIATIVES Seaport initiatives offer examples of how applying the strategies to the focus areas manifest in specific funding allocations, projects, or actions to improve infrastructure and operations at Florida seaports and in the overall freight and cruise passenger logistics chains. It is important to note that each initiative often involves more than one focus area or strategy. For instance, an access project can also increase capacity and improve efficiency, and the creation and implementation of that project may include the application of many data analysis, collaboration, and funding strategies. All of the initiatives and projects listed here are components of the FDOT Seaport Work Program presented in Chapter five. These initiatives represent highlights from the capital improvement categories of the program. The initiatives include references to recent, current, and future projects contained within the FDOT Seaport Work Program. 1. Waterway deepening and widening to improve vessel access, safety, and capacity: Major projects recently have been completed, are under way, or are planned at PortMiami, Port Canaveral, JAXPORT, and Port Everglades. The Department is working with seaports to leverage federal authorizations and funding to improve the ability of Florida s seaports to safely and efficiently handle the larger vessels being used by the cruise and cargo shipping lines. These efforts serve to maintain and improve Florida s competitiveness and capabilities in global container trade, bulk commodities, and the cruise industry. 2. Crane Acquisitions to improve capacity, efficiency and energy usage: New cranes have recently been acquired or are in the process of being acquired at Port Panama City, Port Canaveral, Port Tampa Bay, JAXPORT, Port Everglades, and PortMiami. The newest generation of cranes are faster and more sophisticated, enhancing both capacity and efficiency. Many Florida ports also are transitioning from diesel powered cranes to electrical or dual-powered cranes. 3. Intermodal Road and Rail Improvements to increase intermodal choices and efficiency: On-port and near-port rail projects including Intermodal Container Transfer Facilities (ICTFs) have recently been completed at Port Tampa Bay, JAXPORT, PortMiami and Port Everglades. Other ports also have plans for rail service improvements or are exploring options for rail service. These improvements expand the service area of the port by adding the long-haul and bulk advantages of rail movements. 4. Wharf Expansion and Rehabilitation to ensure safe and efficient handling of vessels: Wharf infrastructure provides the berthing (or parking) area for vessels. The wharf also provides the platform for cranes and other loading equipment and is a critical component in ensuring safe and efficient vessel operations. Wharf expansion and rehabilitation projects recently have been completed or are under way at Port Manatee, Port Tampa Bay, Port of St. Pete, Port of Palm Beach, Port Canaveral, Port Everglades, JAXPORT, and Port Panama City. 5. Terminal Improvements and Expansions to increase capacity, safety, and efficiency: Improving and expanding cargo and passenger facilities to enhance capacities and efficiencies at Florida ports is another important area of FDOT s Seaport Program. Ports with recently completed, underway, or pending projects include: Port Canaveral, Port Panama City, Port Tampa Bay, PortMiami, Port Manatee, and JAXPORT. FDOT 2015 Florida Seaport System Plan 6-15
174 Chapter 6: FDOT Seaport Focus Areas and Strategies to Support Florida's Seaports 6. Intermodal Logistics Centers (ILCs) help optimize supply-chain operations: FDOT s Seaport Program includes a provision to support transportation infrastructure at off-port intermodal and distribution centers that handle cargo to/from Florida seaports. The ILC provision has been used or is currently under consideration for projects near Port Manatee, Port Panama City, PortMiami, Port Everglades, the Port of Palm Beach, JAXPORT, Port Tampa Bay, and Port Canaveral. The ILC program is recognition of the connectivity of seaports to inland logistics facilities and their complimentary roles in the freight supply chain. Conceptually, the initiatives may be thought of as describing the what and where, while the Focus Areas define the purpose, and the strategies describe how FDOT goes about creating and implementing the initiatives. The why, of course, is to improve the well-being and prosperity of the citizens of Florida. 6.6 CONCLUSION AND OUTLOOK The dynamic nature of global trade and manufacturing, maritime businesses, commodity flows, fuel markets, and the cruise industry means that seaports, logistics facilities, and logistics companies are continually having to adapt and improve the way they do business. As a result, the FDOT s Seaport Program needs to be able to respond to needs and adjust to opportunities. Therefore, the specific projects and the timing and amount of funds for each project are often subject to change and adjustment. By consistently applying the Strategies to the Focus Areas described in this Chapter, the Seaport Office can ensure that initiatives, actions, and funding decisions are targeted to needs and opportunities that will prove effective in developing infrastructure to support long-term growth and efficiency at Florida seaports. Thanks to the billions of dollars of increased seaport related infrastructure investments from state and local sources since 2011, recent growth in container volumes suggests that Florida ports are already beginning to capture a greater share of cargoes, and the trends in global logistics patterns, combined with Florida s continuing investments, position the state s ports to gain an increasing share of the world s waterborne commerce for decades to come. Therefore, the near and long-range plan for the Florida Department of Transportation, Seaport Office, is to continue to invest in facilities and processes that improve access, capacity, and efficiency at Florida s seaports to attract and handle the increasing variety of cruise ships and cargo vessels that carry the passengers, basic commodities and valuable products to support the prosperity and well-being of Florida s businesses, residents and visitors Florida Seaport System Plan FDOT
175 LIST OF APPENDICES Appendix Title Page A-1 Plan Integration Cross Walk... A-1 A-2 FDOT Transportation Plans, Goals, and Objectives... A-2 B History and Details... B-1 C Definitions and Descriptions... C-1 D-1 Seaport and Waterway System Plan Questionnaire... D-1 D-2 Stakeholder Respondent List... D-5 D-3 Stakeholder Response Table... D-6 FDOT 2015 Florida Seaport System Plan A-i
176
177 Appendix A-1 APPENDIX A-1 PLAN INTEGRATION CROSS WALK FTP, SIS, FMTP, and Seaport and Waterways Office Goals, Objectives, Focus Areas, Strategies, and Initiatives Focus: Seaport Access Near-port waterway and landside infrastructure that provides safe and sufficient access to and from seaports for vehicles, railcars, vessels, cargo, and passengers. While landside highway, road, and rail access to Seaports is a major focus of the highway and rail divisions of FDOT, the Seaport Program focuses on improving the state s navigable waterways, channels, and harbors. Seaport Seaport FMTP SIS Objective(s) FTP Goal(s) Strategies Initiatives Objectives 1, 2, 3, 4, 5, 7 1, 3, 4, , 2.3.1, 2.5.1, , 2, 3 1, 2, 3, 4, 5, 7 Focus: Seaport Capacity On-port infrastructure to increase the ability of seaports to handle growing or new volumes of passengers, cargos and/or maritime activities. Facilities may include wharfs, terminals, cargo handling equipment, warehouses, and rail transfer facilities. Seaport Seaport FMTP SIS Objective(s) FTP Goal(s) Strategies Initiatives Objectives 1, 2, 4, 5 2, 3, 4, , 2.5.1, 2.5.4, 2.6.3, 7.3.2, , 3 2, 3, 4, 5, 7 Focus: Seaport Efficiency On-port infrastructure and systems to safely improve the efficiency of vehicle, cargo, or passenger movements within port operational areas. Facilities may include gate structures and systems, cranes, and specific terminal yard or circulation configurations and systems. Seaport Seaport FMTP SIS Objective(s) FTP Goal(s) Strategies Initiatives Objectives 2, 3, 4, 5 2, 3, 4, , 2.3.1, 2.5.1, 2.5.2, 2.6, 3.4, , 5, 6 Focus: Waterborne Freight Supply Chain Optimization Off-port infrastructure and systems to increase the volumes and efficiencies of waterborne cargos as they move through inland intermodal systems. Components of the off-port intermodal systems include rail lines, inland transfer yards, Intermodal Logistics Centers (ILC s), warehousing and distribution facilities, export-oriented manufacturing, and Foreign-Trade Zones (FTZ s). Seaport Seaport FMTP SIS Objective(s) FTP Goal(s) Strategies Initiatives Objectives 1, 2, 3, 4, 6, 8 2, 3, , 1.2.4, 1.6.2, 2.5, 2.5.1, 2.5.2, 2.5.4, , 2, 3 1, 2, 3, 4, 5, 6, 7 Note: Seaport Strategies and Initiatives numbered in this crosswalk can be found in Chapter six of this plan. The FMTP and SIS Objectives, and FTP Goals enumerated here can be found in Appendix A-2. FDOT 2015 Florida Seaport System Plan A-1
178 Appendix A-2 APPENDIX A-2 FDOT TRANSPORTATION PLANS, GOALS, AND OBJECTIVES FDOT Transportation Plans Goals and Objectives Florida Transportation Plan (FTP) Goals: 1 Safety and Security for Residents, Visitors, and Businesses 2 Agile, Resilient, and Quality Infrastructure 3 Efficient and Reliable Mobility for People and Freight 4 More Transportation Choices for People and Freight 5 Transportation Solutions that Support Florida s Global Economic Competitiveness 6 Transportation Solutions that Support Quality Places to Live, Learn, Work, and Play 7 Transportation Solutions that Support Florida s Environment and Conserve Energy Strategic Intermodal System (SIS) Policy Plan Objectives: 1 Interregional Connectivity: Ensure the efficiency and reliability of multimodal transportation connectivity between Florida s economic regions and between Florida and other states and nations. 2 Intermodal Connectivity: Expand transportation choices and integrate modes for interregional trips. 3 Economic Development: Provide transportation systems to support Florida as a global hub for trade, tourism, talent, innovation, business, and investment. FMTP Objectives and Strategies (Correlation to Seaport Focus): 1 Capitalize on the freight transportation advantages of Florida through collaboration on economic development, trade, and logistics programs 1.1 Maximize the strategic advantage of Florida s transportation hubs for trade logistics Characterize and highlight the unique strengths of each seaport Develop criteria for strategic port investments in tandem with private investments to respond to market needs nimbly and transparently Determine the operating characteristics of transportation hubs and improve the connecting distribution/transportation system (spokes) to match their particular logistic needs and opportunities Develop a comprehensive plan to support and facilitate international exports and interstate commerce 1.2 Foster the development and deployment of ILCs through cooperative efforts with industry Implement the ILC infrastructure support program 1.6 Collaborate with Enterprise Florida to address transportation and logistics needs for the Targeted Industries Identify and address transportation issues and challenges for each of the Targeted Industries (Modal Offices, SPO support) Match trade and transportation needs of the Targeted Industries with the characteristics of the ports, airports, and ILCs as branding enhancements (Modal Offices, SPO support) 1.7 Collaborate with Workforce Florida to develop a trade and logistics workforce Develop jointly sponsored vocational and technical training academies for maritime operations, trade and logistics staff, and other skills needed for increased manufacturing, trade, and logistics operations in Florida 2 Increase operational efficiency of goods movement 2.2 Identify and implement freight movement gap-closing improvements Improve hub connections (last mile and beyond) (SPO lead, Modal Offices support) 2.3 Identify and implement freight movement efficiency enhancements Prioritize investments on connections (distribution hubs, ILCs, etc.) A Florida Seaport System Plan FDOT
179 Appendix A-2 FMTP Objectives and Strategies (Correlation to Seaport Focus) (Continued): 2.4 Promote and support use of Intelligent Transportation Systems (ITS) technology to increase efficiency and reliability of freight movements Foster uniform information technology among all Florida seaport for trucking and rail operators (Rail and Motor Carrier support) 2.5 Champion and support needed freight capacity expansions Identify and implement projects to eliminate freight bottlenecks Examine dedicated freight facilities or freight shuttles when existing capacity has been maximized (OPP lead, Modal Offices support) Explore the appropriate role of marine highways or short-sea shipping Anticipate future freight facility needs 2.6 Identify and implement safety and security enhancements Facilitate the safe implementation of autonomous vehicles (driverless vehicles and unmanned space vehicles) 3 Minimize costs in the supply chain 3.4 Advocate for regulatory reform and federal inspection agencies staffing to reduce impediments to goods movement (e.g., weight limits) 3.5 Support manufacturing and assembly that reduces empty backhauling Expand FTZ benefits to ILCs with potential for manufacturing capacity Facilitate transportation and CNG/LNG supply to support such ILCs Strategize with freight forwarders on how to maximize freight forwarding opportunities for goods manufactured in other states for export through Florida ports and airports (Seaports and Waterways and Aviation and Spaceports both lead) 5 Raise awareness and support for freight movement investments 5.1 Tell the Freight Story undertake a joint public-private communications campaign Educate the public about the importance of freight transportation Educate and inform elected officials about freight 6 Develop a balanced transportation planning and investment model that considers and integrates all forms of transportation 6.2 Coordinate across state agencies to ensure consistency of regulations that impact freight operations and mobility 7 Transform the FDOT's organizational culture to include consideration of supply chain and freight movement issues 7.1 Integrate modal perspectives with multimodal supply chain perspectives Add criteria for inclusion of ILCs in the SIS (OPP lead) Position and support emerging freight facilities: spaceports, marine highways, etc. (Modal Offices support) 7.3 Prioritize freight projects across the modes Leverage freight infrastructure investments to amplify private sector investments Develop multimodal investment and decision tools Focus on intermodal benefits (supply chain efficiencies) (OPP lead, Modal Offices, SPO support) Balance qualitative societal goals with quantitative goals like ROI (OPP lead, Modal Offices, SPO support) Support freight infrastructure investments from the SIS, State Infrastructure Bank (SIB), Transportation Infrastructure Finance and Innovation Act (TIFIA), etc. FDOT 2015 Florida Seaport System Plan A-3
180
181 Appendix B APPENDIX B HISTORY AND DETAILS THE FLORIDA SEAPORT SYSTEM TIMELINE: This Florida Seaport System Timeline highlights many of the milestones related to port development and expansion over the many years Port Tampa Bay Established 1915 Port of Palm Beach Special Act, 1915, Chapter 7081, created port 1918 Port of Ft. Pierce enabling act passed St. Lucie County Port Authority created with ad valorem taxing authority Ft. Pierce Inlet District created which included approximately 65% of St. Lucie County 1927 Port Everglades Special Act created the Broward County Port Authority 1939 Port Canaveral Original Charter 1941 Port of Fernandina enabling act Chapter 21418, S12, Special Acts of 1941, Laws of Florida (LOF) 1943 Port of Pensacola Special Act created the Pensacola Port Authority 1945 Port Panama City Special Act, 1945, Chapter 23466, LOF 6/1/ Port Tampa Bay Hillsborough County Port Authority created by Special Act and later renamed the Tampa Port Authority 1947 Port of Ft. Pierce Florida Legislature abolished the Ft. Pierce Inlet District and created the Ft. Pierce Port Authority with taxing authority and legal right to acquire land and lease real estate 1955 Port of Port St. Joe Special Act, 1955, Chapter 30787, LOF, created Port Authority 1959 Legislature passed Chapter , Laws of Florida (LOF), creating the 1959 Port Facilities Financing Law and has amended Chapter 315, Florida Statutes (F.S.), over the years to support the future activities of Chapter 311, F.S., and the ports 1959 Port Everglades Charter was revised to reflect growth of port Chapter , LOF 1960 PortMiami 4/5/60 - Dade County Board of County Commissioners approved Resolution No Joint Resolution Providing for Construction of Modern Seaport Facilities at Dodge Island Site and on 4/6/60 the City of Miami approved the same as City Resolution No to construct the new Port of Miami 1961 Port of Ft. Pierce 1961 special act replaced the Ft. Pierce Port Authority with the Ft. Pierce Port and Airport Authority run by St. Lucie County 1963 JAXPORT Special Act created Port of Jacksonville 1 In most cases, the Florida Legislature passed Special Acts to create, modify, or repeal provisions related to the governance of the Florida seaports. The Port of Key West is currently a department of the City of Key West. Its history dates back many hundreds of years ago when declared a Port of Entry. FDOT 2015 Florida Seaport System Plan B-1
182 Appendix B 1967 Port Manatee Chapter , LOF, created the Port Manatee Port Authority 1972 Passage of Federal Water Pollution Control Act Amendments (Clean Water Act) focusing light on water quality in harbors and rivers 1975 Florida Local Government Comprehensive Planning (LGCP) Act required local governments which included the public ports to have comprehensive land use plans 1977 Clean Water Act amendments focusing on water quality issues 1984 Port Citrus enabling act passed creating the Citrus County Port Authority 1985 Revisions to 1975 LGCP Act required developers including ports to have the state of Florida approve all development plans and amendments for impact to community and environment 1986 Port Trust Fund established to assist ports with environmental permitting issues 1987 Water Quality Act of 1987 continued requirements for water quality standards 1989 The ports of Miami and Everglades agreed to work together for a common goal of seeking additional funds to expand their facilities 1989 Florida s ports collectively asked for state assistance in funding capital infrastructure projects as the Florida Ports Council 1989 Port Everglades Authority enabling act codified and revised the many previous special acts passed since 1959 Chapter , LOF; Port Everglades mandated to prepare a Local Government Comprehensive Plan by March 1, 1990 Chapter , LOF 1989 Port of Ft. Pierce name of authority was changed to the St. Lucie County Port and Airport Authority 1990 Creation of Chapter 311, Florida Statutes (F. S.), the Florida Seaport Transportation and Economic Development Program (FSTED) and the FSTED Council providing $8M a year in matching funds from the State Transportation Trust Fund (STTF) for on-port projects ports received state assistance to prepare port master plan required by s (3), a prerequisite for state funding and continue to update these plans at various intervals up to the present 1991 First Five-Year Seaport Mission Plan published and published annually thereafter 1991 First list of FSTED Council projects approved for funding and unfunded needs lists submitted to FDOT for FSTED Program funding 1991 Port Everglades Authority Chapter , LOF, required the transfer of the assets and liabilities of the independent special district to the Board of Commissioners of Broward County effective November 22, Seaport Employment and Training Program (STEP) created as s , F.S., in the former Department of Commerce to provide a grant program to stimulate and support maritime training, education, and employment opportunities 2 2 Note: Under the Governor Jeb Bush Administration training and employment programs were consolidated under the former OTTED and no funding has been allocated through this program since the mid-to-late 1990s; s (3) also contains a requirement for the FSTED Council to develop programs for the training of minorities and secondary school students in job skills associated with the maritime industry, but no funding has been identified for this task. B Florida Seaport System Plan FDOT
183 Appendix B 1992 JAXPORT develops STEP program outfitting a container with materials for use at schools, job fairs, and community events around the state; this program remains in Chapter Chapter 311 funding language amended to a minimum of $8M 1994 Ports of Fernandina and Key West added to Chapter Seaports highlighted need for a Landside Access Study to identify off-port connection highway and intermodal rail connectivity issues 1994 Port Everglades becomes a department of Broward County government as an Enterprise Fund solely dependent upon its own revenues for capital and operational expenditures Chapter , LOF 1995 Port Tampa Bay Chapter , LOF, repealed the previous various special acts passed between 1984 and 1994, and codified, repealed, amended, or repealed the various provisions; required the Hillsborough County Legislative Delegation to review the enabling legislation every 10 years for any potential modifications Legislature passed s (3), F.S., authorizing bond program to finance seaport infrastructure projects $15M in annual debt service from STTF Bond Program as an additional revenue stream to fund FSTED Program projects 1996 Ports authorized to create by inter-local agreement the Florida Ports Financing Commission (FPFC)) which issued $222,230,000 in 30-year bonds to match 50/50 with ports for port infrastructure projects 1996 The Seaport Environmental Management Committee (SEMC) was created in s , F.S. under the direction of the FSTED Council. It provided a forum for ports to better understand federal, state, and local regulatory issues and their impacts related to compliance. Environmental issues including maintenance dredging and dredged-material management; environmental mitigation; air and water quality permitting; and the maintenance of navigation channels, port harbors, turning basins, harbor berths, and associated facilities formed the topics of discussion After federal, state and local law enforcement identify illicit drug activity at Port Everglades and Port Miami, criminal history background checks began at both ports 1997 FDOT and FSTED Council with PBSJ & J. D. Sanchez Consulting publish Landside Access Study delineating congestion issues, off-port road and intermodal needs, estimated costs, and timing 1997 Legislature passed s (4), F.S., authorizing bond program to finance seaport infrastructure and intermodal projects -- $10M in annual debt service beginning in Legislature references list of intermodal access projects from Seaport Mission Plan as eligible Chapter 311 projects 1997 Port of Ft. Pierce special act updated and clarified various provisions of the enabling legislation 1998 Landside Access Study, Part II, published further expanding on intermodal needs 1998 Florida Insurance Commissioner s budget contained $994,000 for grants for ports for the Stolen Auto Recovery Program to utilize x-ray equipment to scan containers for stolen vehicles FDOT 2015 Florida Seaport System Plan B-3
184 Appendix B 1998 Port of Ft. Pierce the St. Lucie County Port and Airport Authority abolished and all assets, liabilities, and responsibilities were transferred St. Lucie County; the Port of Ft. Pierce remains a department of St. Lucie County 1999 Legislature passes amendments to s (4) (F.S.), moving bond issue date to 1999 from 2001; added additional accountability requirements 1999 FPFC issues $150M in seaport infrastructure and intermodal bonds for port development matched 50/50 or 25/75 depending on project type as an additional revenue stream to fund FSTED Program projects 1999 U.S. Senator Bob Graham (D-FL), chaired the President s Interagency Commission on Crime and Security in U.S. Seaports 1999 Florida Governor Jeb Bush established the Governor s Office of Drug Control (ODC) and Florida s first Drug Summit was held 1999 Governor Bush requested that the 14 public seaports take a leadership role in the interdiction of illicit drugs and the prevention of cargo theft at Florida seaports 1999 Florida Legislature required a comprehensive statewide security assessment of Florida s seaports 2000 Ports continue to spend 1996 bond proceeds and Chapter 311 funds on infrastructure capital investments and began implementing project development funded by the 1999 bonds 2000 FSTED Council established Seaport Security Advisory Committee to assist in the development of statewide and individual seaport security assessments and plans required by the newly created s (F.S.) and the ODC 2000 Legislature passed amendment to Chapter 311 permitting those ports with less than $5M in revenues to develop projects more local and regional in nature to benefit their local communities, but still consistent with the financing provisions of Chapter 315, the Port Facilities Financing Law Port of Port St. Joe previous special act was repealed and Chapter , LOF, was the recodification and re-creation of the Port of Port St. Joe Port Authority 2001 Florida Ports Council (FPC) engaged security expertise firm to assist in assessments, evaluations, plan preparation, and recommendations to implement s (F.S.) /11 terrorists attack the World Trade Centers in New York 2001 Ports changed security focus from illicit drugs, cargo theft, and money laundering to prevention of anti-terrorism activities, protection of the cruise industry and hazardous materials, additional law enforcement personnel needs, and access control/security infrastructure and technology needs 2001 JAXPORT Special Act of 1963 repealed; Chapter , LOF, created the Jacksonville Seaport Authority dba Jacksonville Port Authority or JAXPORT (split aviation and marine into two authorities enacted in previous special acts) 2002 Legislature revised provisions of Chapter (3)(b) (F.S.) to include seaport security operational and infrastructure projects as eligible for FSTED Program funds with the intent to repeal provision in future B Florida Seaport System Plan FDOT
185 Appendix B Ports diverted more than $60M in FSTED Program Chapter 311 and FPFC bond funds from seaport commerce infrastructure funding to seaport security infrastructure projects and operational costs mandated by s , F.S Federal Department of Homeland Security (DHS) Transportation Security Administration (TSA) issued first round of the Port Security Grant Program (PSGP) Florida seaports were awarded a significant portion of available PSGP funds due to previous work done to complete assessments, identify needs, and obtain cost estimates cruise industry and military deployment ports 2002 The federal Maritime Transportation Security Act (MTSA) of 2002 passes which has been amended many times since present MTSA continues to guide implementation of federal security requirements creating a duplication of effort and costs with the security provisions of Chapter Port Manatee Chapter , LOF, codified, re-enacted, amended, and repealed previous various special acts related to the Manatee County Port Authority 2003 Legislation passed (SB 676) creating the Florida Strategic Intermodal System, requires the development of a SIS plan but without any funding at this time; legislation identifies 8 statewide transportation corridors; required formation of the Statewide Intermodal Transportation Advisory Council with one seaport representative from the Atlantic Coast and one from the Gulf Coast as members 2003 Florida Waterway System Plan published FDOT 2004 Port Canaveral enabling act amended to codify, amend, repeal, and re-enact the many special acts into one body of law , LOF 2004 JAXPORT Chapter , LOF, repealed , LOF, and recreated the Jacksonville Port Authority as it is today 2005 Legislature repealed authority to use FSTED Program funds for security operational costs or infrastructure projects 2005 Legislature passed s , F.S., requiring the FSTED Council to establish the Small County Dredging Program to fund dredging programs in counties having a population of fewer than 300,000 according to the last official census. FSTED was to promulgate rules and develop a similar process for project approval as the FSTED Program requires. The match was a 25/75 percent match and this program remains in Chapter 311 today. Hernando County dredged an access channel to the Gulf of Mexico for commercial fishing fleet and recreational users. St. Lucie dredged Taylor Creek to benefit the Port of Ft. Pierce, and Bay County dredged an area to benefit the Port of Port St. Joe FDOT 2015 Florida Seaport System Plan B-5
186 Appendix B 2005 Transportation Regional Incentive Program (TRIP) created by SB 360 and funded at $275M ports have received TRIP monies over the years 2005 Oceans and Coastal Resources Act, HB 1855, creates Oceans and Coastal Resources Council within the Florida Department of Environmental Protection to develop a research plan Florida Ocean Alliance 2005 Port of Fernandina Chapter , LOF, codified, re-enacted, amended, and repealed the various previous special acts of the Ocean Highway and Port Authority Nassau County (Port of Fernandina) including Chapter , LOF 2005 Port Tampa Bay - Chapter , LOF, stated that Hillsborough County Port District (HCPD) is the district name and the Tampa Port Authority is the name of its governing board; Hillsborough County boundaries are coterminous with the HCPD 2007 Legislature provided $50M in non-recurring General Revenue funding to seaports to partially reimburse seaports for commerce infrastructure funds expended on seaport security infrastructure projects 2007 Corrected inadvertent elimination of the provision which allowed for an amendment to a port master plan to be incorporated into a LGCP even if the LGCP is found out of compliance by the former DCA based upon evaluation and appraisal reports (EARS) reviews 2008 Beach Management/Dredged Sand Legislation (SB 1672/HB 1427). Legislation passed concerning the quality and quantity of dredged sand on beaches. The legislation contains language maintaining the current statutory exemption for seaports concerning placement of dredged sands on beaches. However, seaports must demonstrate a reasonable effort to place beach-quality sand from construction and maintenance dredging and port-development projects on adjacent eroding beaches in accordance with port master plans approved by the former Department of Community Affairs, and permits issued by the Department of Environmental Protection Maintenance Dredging Exception to Permits Issued by DEP Legislation (HB 635/SB 758). The Legislature agreed to Inland Navigation District legislation to create a specific exception from the requirement to obtain a dredge and fill permit for maintenance dredging conducted by Florida seaports or by an inland navigation district. The exception applies as follows: A mixing zone of turbidity within a 100-meter radius. A discharge of return water under specific conditions and does not violate water quality standards. Prohibits the state from charging for material removed pursuant to this exception. The use of flocculants is allowed if coordinated in advance with DEP, and if the flocculants do not harm water resources. (DEP is required to develop a list of flocculants that can be used pursuant to this legislation) Maintenance dredging conducted within two years after a storm even causing damage to the original design function is specifically exempted from the permit requirements. B Florida Seaport System Plan FDOT
187 Appendix B 2008 House of Representatives creates House Committee on Roads, Bridges, and Ports during the Organizational Session 2008 Florida Waterway System Plan Update published FDOT 2009 Transportation legislation passed (HB 1021) which exempts port-related industrial or commercial projects located within 3 miles of a port or in a port master plan which rely upon the use of port and intermodal transportation facilities from Development of Regional Impact (DRI) review 2010 Match for FSTED Program funds Chapter 311 funds was lowered to a 25/75 percent basis for those projects which involved the rehabilitation of wharves, docks, berths, bulkheads, or similar structures to address the aging infrastructure at seaport 1999 bond issue had permitted this match 2010 Section , F.S. created to permit a port to receive or solicit proposals from and enter into public-private infrastructure project agreements with a private entity or a consortium to build, manage, maintain, or finance a port-related infrastructure project 2010 Legislature passes legislative intent language creating s , F.S., declaring that seaport facilities listed in Chapter (1), F.S., are critical infrastructure facilities which significantly support the economic development of the state and finds that it is necessary to provide a method of priority permit review that allows the ports to become internationally competitive. This section speaks to an alternative process for obtaining an environmental resource permit or use of sovereign submerged lands and provides for a port conceptual permit 2010 First Florida Seaport System Plan published FDOT 2010 Florida Chamber Foundation and FDOT publish the Florida Trade and Logistics Study (1.0) Florida Transportation Plan published FDOT 2010 Florida Strategic Intermodal System Strategic Plan published FDOT 2011 Florida Legislature passed and Governor Rick Scott signed Chapter , Laws of Florida, (HB 283) which significantly rewrote the security provisions of Chapter 311; deleted the Office of Drug Control from any responsibility in Chapter 311, and paved the way for a more cost-efficient, balanced, harmonized process for protecting the public domain on a seaport 2011 CS/CS/CS/CS/HB 283 authorizes Citrus County to apply for an FSTED grant to perform a feasibility study regarding the establishment of a port in Citrus County and authorizes Port Citrus to become a member of the FSTED Council, but removes them if the study finds no feasibility for a port in Citrus County 2011 CS/CS/CS/HB 399 requires seaports to develop a strategic plan with a 10-year horizon that includes the following components: economic development, infrastructure development, intermodal transportation facilities, regulatory barriers, and intergovernmental coordination FDOT 2015 Florida Seaport System Plan B-7
188 Appendix B Provides exemption from stormwater management permits for overwater piers, docks, or similar structures Revises the port conceptual permit process to provide for a 60-day application response by the Department of Environmental Protection, limits the additional information requests by the Department to two, and places the ultimate persuasion burden on any third party that challenges the issuance of a permit Revises the maintenance dredging permitting process to provide that additional permits are no longer necessary if the maintenance dredging is no more than necessary to restore previously dredge areas and previously undisturbed natural areas are not significantly impacted. Also provides that new spoil disposal site permits are not necessary if the site exists as of January 1, 2011, and the site is certified as adequate for storage of spoil material Economic Development Reorganization (SB 2156). The reorganization of several state agencies and Enterprise Florida, Inc. (EFI) was part of the budget conference and passed with significant changes to EFI and several state agencies that interact with seaports including the Department of Community Affairs and the new Department of Economic Opportunity Creates the Department of Economic Opportunity with the purpose of assisting the Governor in working with the Legislature, state agencies, business leaders, and economic development professionals to formulate and implement coherent and consistent policies and strategies designed to promote economic opportunities for all Floridians. Redirects Documentary Stamp Taxes previously allocated to the Strategic Intermodal System to the State Economic Enhancement and Development Trust Fund as follows -- $50 million in FY 2012/2013, $65 million in FY 2013/14, and $75 million every fiscal year thereafter. Redirects $75 million annually in Documentary Stamp Taxes previously allocated to the State Housing Trust Fund to the State Economic Enhancement and Development Trust Fund. Revises Enterprise Florida, Inc., with the overall purpose to act as the economic-development organization for the state, utilizing private-sector and public-sector expertise in collaboration with the Department of Economic Opportunity. This includes advancing international and domestic trade opportunities. Authorizes the appointment of the President of Enterprise Florida, Inc., by the board of directors. The President serves at the pleasure of the Governor and shall also be known as the secretary of commerce and shall serve as the Governor s chief negotiator for business recruitment and business expansion. Creates five divisions within Enterprise Florida, Inc. International Trade and Business Development; Business Retention and Recruitment; Tourism Marketing; Minority Business Development; and Sports Industry Development. Transfers the powers and duties of the Department of Community Affairs to the Department of Economic Opportunity. (This includes their duties as a member of the FSTED Council.) Transfers the powers and duties of the Office of Tourism, Trade and Economic Development to the Department of Economic Opportunity. (This includes their duties as a member of the FSTED Council.) Revises the ability of the Governor to approve Quick Action Closing Fund projects - $2 million or less may be approved without consulting the Legislature, for projects requiring funding in the amount of $2 million to $5 million, the Governor must provide a written description and evaluation of the project to the chair and vice-chair of the Legislative Budget Commission. B Florida Seaport System Plan FDOT
189 Appendix B Creates the position of state protocol officer with the responsibilities of intergovernmental relations with foreign governments doing business in Florida and the point of contact with The U.S. Congress with respect to laws or policies which may affect the interests of the state in the area of international relations Matching requirements for those ports located in State Rural Areas of Opportunity were reduced to 25/75 for FY 2012/ Major revisions to Chapter 311: Retitles Chapter 311 Seaport Programs and Facilities Increases minimum of $8M to $15M annual funding for FSTED Program Tasks the FSTED Council for setting guidelines for project funding Requires FDOT, FSTED staff and DEO to work together to review projects and allocate funds Adds seaport master and strategic plan development or updates including data to support such plans as an eligible use of FSTED Program funds Deletes cap on funds distributed through the Program Adds the Statewide Seaport and Waterways System Plan to the list of FDOT plans with which project applications must be consistent Creates the Strategic Port Investment Initiative (s F.S.) within FDOT to provide a minimum of $35M annual for designated priority strategic investment projects Creates the Intermodal Logistics Center Infrastructure Support Program ( F.S.) for the purpose of providing $5M annually to provide funds for roads, rail facilities, or other means for conveyance or shipment of goods through a seaport Section , F.S. was created to authorize a seaport to provide for onsite or offsite stormwater treatment for water quality impacts caused by a proposed port activity Required the FDOT to prepare a Statewide Seaport and Waterways System Plan consistent with the goals of the FTP and consider needs identified in the port master plans and strategic plans The SSWSP will identify 5-, 10- and 20- years needs for the seaport system and will include seaport, waterway, road, and rail projects needed Florida Legislature passes HB 599 directing FDOT to develop a Freight Mobility and Trade Plan (FMTP), and federal legislation, MAP-2,1also encourages the creation of state freight plans to fulfill federal requirements The Legislature passed legislation (CS/CS/CS/SB 84) creating an alternative procurement process and requirements for public-private partnerships to facilitate the construction of public-purpose projects, and creates a Public Facilities and Infrastructure Act Guidelines Task Force. If desired, local government seaports would have the ability to use these partnerships to construct public-purpose projects on seaport property Environmental Regulation Legislation (CS/CS/CS/HB 999). The Legislature passed environmental legislation that includes a variety of issues to resolve delays in state permitting procedures. The legislation also includes the language worked on with DEP to modify existing authority in the Preapproved Advanced Cleanup (PAC) program to increase the total amount that DEP can award under that program to individual projects from $5 million to $15 million. This could include seaport projects. FDOT 2015 Florida Seaport System Plan B-9
190 Appendix B 2013 Section , F.S. provides $10 million in annual debt service for a $150 million bond issue for strategic seaport projects Numeric Nutrient Criteria Agreement Legislation (CS/HB 7115) 2013 Florida Chamber Foundation and FDOT publish the Florida Trade and Logistics Study Update (2.0) 2013 Statewide Cruise Perspective published by FDOT 2013 FMTP Policy Element published June 2013 by FDOT 2014 FMTP Investment Element published September Seaport Transportation and Logistics Educational Needs Assessment published FDOT 2014 Analysis of Global Opportunities and Challenges for Florida Seaports published FPC for FSTED Council 2015 Chapter , LOF, (s , F.S.), provided for the designation of state Freight Logistics Zones (FLZ) and stated that a county or two or more contiguous counties may designate a geographical area or areas within its jurisdiction as a freight logistics zone; projects within a FLZ may be eligible for priority in state funding and incentive programs pursuant to Chapter 288, F.S. The implementation of this section remains to be realized at this date S (2), F.S., increases the FSTED Program funding from $15 million annually to $25 million annually S (5), F.S., establishes a Florida Seaport Security Advisory Committee under the direction of the FSTED Council S (6), F.S., requires the FSTED Council to establish a Seaport Security Grant Program to assist in the implementation of security plans and measures at the 15 deepwater seaports. The bill provides for the FSTED Council to grant funds appropriated by the Legislature. In 2016, funds were appropriated for this program. B Florida Seaport System Plan FDOT
191 Appendix C APPENDIX C DEFINITIONS AND DESCRIPTIONS AAPA American Association of Port Authorities Authorized depth at MLW The federally set depth of the waterway at mean low water. Barge A shallow draft vessel used to transport goods along a waterway, usually towed or pushed. Berth A ship s allotted place at a dock or wharf. Break Bulk Non-containerized segmented cargo stowed directly into a ship s hold. Bulkhead A partition separating one part of a ship from another part, or shore from pier. CLIA Cruise Lines International Association. Commercial Waterway A waterway that carries any amount of freight for the purpose of commerce. Container A truck trailer body that can be detached from the chassis for loading into a vessel. Container Terminal An area designated for the towage of cargo in containers. Deep Draft A waterway whose draft depth is greater than 12 feet deep. DEP Florida Department of Environmental Protection Domestic Cruising A cruise vessel that does not travel in international waters for a leisure voyage. Draft Vertical distance between a ship's waterline and the lowest point of its keel. Dredging A method to scoop or suction material under the water to deepen or modify a waterway. Dry Bulk A commodity which is shipped in large, unpackaged amounts directly in a ship s hull. EPA Environmental Protection Agency FDOT Florida Department of Transportation FPC Florida Ports Council FPFC Florida Ports Financing Commission FSTED Florida Seaport Transportation and Economic Development Council FWC Florida Fish and Wildlife Conservation Commission Inland Waterway A waterway such as a river, canal, channel, or harbor. Jones Act A law enacted in 1920 that requires vessels engaged in domestic U.S. trade to be built, owned, and crewed by U.S. citizens. Liquid Bulk Liquid cargoes such as petroleum, shipped directly in a ship s hull. MARAD U.S. Maritime Administration; agency within the U.S. Department of Transportation MLW Mean Low Water Navigable Waterway A body of water that is capable of sustaining vessel traffic. NOAA National Oceanic and Atmospheric Administration Revenue Cruise Passengers A way to measure cruise passengers by counting the total number of embarkations and debarkations. Shallow Draft A waterway whose draft depth is less than or equal to 12 feet deep. Shoaling The deposition of sediments that cause a body of water to become shallower. Short Sea Shipping Primarily a sea route segment complementary to truck and rail transportation. Short Ton Unit of weight equal to 2,000 pounds. TEU Twenty-foot equivalent unit, standard measurement for container volumes. Tidal Current The flow of water caused by ebbing and flowing tides. Tonnage Ocean freight is frequently billed on the basis of weight or measurement tons, or tonnage. Turning Basin An open area within a water body that allows a vessel to turn around. USACE U.S. Army Corps of Engineers USCG U.S. Coast Guard USFWS U.S. Fish and Wildlife Service USGAO U.S. Government Accountability Office USMC U.S. Marine Corps FDOT 2015 Florida Seaport System Plan C-1
192
193 Appendix D-1 APPENDIX D-1 Seaport and Waterway System Plan Questionnaire Seaport Questionnaire Port: Name of Respondent: Position/Title: Office Phone: Mobile Phone: Items to Provide in Addition to Survey Responses: Please provide your current Five-Year Capital Improvement Program (CIP) Please provide your latest Comprehensive Annual Financial Report (CAFR) Please provide your latest Strategic/Master Plan(s)/Updates General Cargo and Passenger Questions Constraints to growth at: Local (Your Port) Statewide (Florida Ports) Container Cargo: General Cargo: Cruise: Advantages to growth at: Local (Your Port) Statewide (Florida Ports) Container Cargo: General Cargo: Cruise: How to best address constraints: How to realize advantages: Comments/Vision on Future: Seaport Transportation and Connectivity Questions What are your greatest transportation-related constraint(s) to growth at your seaport (e.g. dredging, roadway network, rail connectivity, service from industry providers, equipment costs)? What are the greatest transportation-related benefits that your port provides to the state? What are the greatest bottlenecks on cargo or passenger movements to and from your seaport? Waterway: List and explain primary causes for delays related to waterway transit (e.g. draft, tidal, navigational, pilotage and/or tug)? What are the primary constraints to growth from a waterside transit perspective? What are the most critical infrastructure needs in order to maintain and to grow waterside transit? Highway: How and where do trucks or passengers vehicles experience the longest on-port delays (e.g. gates, security, queuing, crossings, and/or parking)? What are the transportation bottlenecks for truck or passenger vehicles on port connector roads? Local roads: Highways: Interstates: Other: What are the most critical state and national truck service issues affecting overall port operations? State: National: Rail: What are the major rail constraints at your port terminal(s)? Where or how does rail experience the longest on-port delays? What benefit(s) does a major rail connection provide your port? Terminal: List the types of terminals at the port and include approximate acres of property allocated. Total Port Acres: Container: Liquid Bulk: Dry Bulk: General Cargo: Cruise Terminals: FDOT 2015 Florida Seaport System Plan D-1
194 Appendix D-1 What are the greatest terminal needs at the port? Are the projects listed above in SeaCIP as an un-funded need? Yes or No Seaport Commodity Questions Top 5 Import Commodities by Tons: Commodity Name Tons Top 5 Export Commodities by Tons: Commodity Name Tons Top 5 Import Countries by Tons: Countries Name Tons Top 5 Export Countries by Tons: Countries Name Tons Top 5 Domestic Commodities by Tons: Commodity Name Tons Top 5 Import Commodities by Value: Commodity Name Value Top 5 Export Commodities by Value: Commodity Name Value Top 5 Import Countries by Value: Countries Name Value Top 5 Export Countries by Value: Countries Name Value Top 5 Domestic Commodities by Value: Commodity Name Value D Florida Seaport System Plan FDOT
195 Appendix D-1 Seaport Business Related Questions Total port employees: Total direct on-port jobs: Domestic/National Business: What is your port doing to capture market share that is already destined to Florida communities, but coming into Florida from a non-florida port? What US/Domestic policies directly impact your port s ability to do or expand business? International Business: What are the major international developments that have an impact on your port s future business over the next 5 years? What effects do you anticipate at the port from the opening of the Panama Canal in early 2016? Currently, Florida and the federal government have restrictions with respect to Cuba. What effects, if any, do you anticipate from the potential opening of trade with Cuba? What effect does increased trade with North/South America have on your port and the Florida ports? How will shifts in the global manufacturing countries affect your port? Foreign Trade Zone (FTZ) Information: What was the process used for designation? What commodity types dominate FTZ goods? Issues or constraints related to utilization of the FTZs? What opportunities to expand the FTZ utilization? If not currently a designated FTZ, are there plans to apply for FTZ status? If Yes what is the expected date? Application Process? Yes or No Environmental: What effect will environmental programs like the designated Emission Control Areas (ECA) have on the port and its tenants? Other Programs? What effect will increase in clean fuels like CNG/LNG and electric utilized equipment have on the port? FDOT 2015 Florida Seaport System Plan D-3
196 Appendix D-1 Seaport Tenant and Users Questionnaire Company name: Industry type: Name of respondent: Position/title: Office phone: Mobile phone: Current Business Structure and Operations: Number of employees? Briefly describe business: Commodities: Import: Export: Origin: Destination: Import: Export: Origin: Destination: Working days: Working hours: Daily peak hours: Seasonal peak: Berth(s) used: Vessels per Year: Average time at berth: Cargo handling equipment: Types of storage: Average dwell time: Modes of transportation used on/off port: Landside shipping distances? Are your facilities at capacity? Yes or No Percentage of capacity remaining? What short-term adjustments could increase efficiency? Long-term? Adequacy of Current Facilities/Infrastructure for Current Operations: How satisfied are you with the current operational environment? Are water depths adequate for your current operations? Yes or No Depth needed? Do you need longer berths? Yes or No LOA needed? Do your vessels experience delays? Yes or No Main causes? Adequate port storage: Laydown: Yes or No Covered: Yes or No Cold: Yes or No On-port circulation constraints (queuing, traffic patterns)? Any truck bottlenecks on local, regional, or long haul? Yes or No Explain: Rail issues or constraints? Most important transportation need? Anything the Port could do to enhance operations? Future Business Development/Expansion Opportunities: Do you have future expansion plans for your operations? Yes or No Explain: What is the time frame for expansion? Contingent on? What global opportunities are driving this decision? Can future demand be met with technology changes, new equipment or facilities? Yes or No Does your company use distribution centers or an intermodal logistics center? Yes or No Where? What needs could the Port or State meet with regards to future expansion plans? Additional Comments: Additional Comments: D Florida Seaport System Plan FDOT
197 Appendix D-2 APPENDIX D-2 STAKEHOLDER RESPONDENT LIST Seaports List of Stakeholders Federal, State, and Local Government Agencies Tenants and Users of the Seaports Port Canaveral USACE GT USA - Port Canaveral Port Citrus Florida FWC TraPac - Jaxport Port Everglades Florida Trucking Association Raven Transport - Jaxport Port of Fernandina Florida Intl Terminal - PEV Port of Ft. Pierce MSC Terminal Operator - PEV JAXPORT PORTUS - PEV Port of Key West Crowley Marine - PEV Port Manatee Holland America Group - PEV PortMiami SFCT - Miami Port of Palm Beach Seaboard Marine - Miami Port Panama City POMTOC - Miami Port of Pensacola Federal Port Corp - Manatee Port of Port St. Joe Citrus Succo - Manatee Port of St. Petersburg Kinder Morgan - Manatee Port Tampa Bay Volken Materials - Manatee FDOT 2015 Florida Seaport System Plan D-5
 14-7 7 D F Federal Funding 12-3 9")
198 Appendix D-3 APPENDIX D-3 STAKEHOLDER OUTREACH SUMMARY MATRIX Port CIP Category Issues Category Identified Challenges, Issues and Opportunities Total Advantages Responses to Growth Constraints to Growth Issues or Needs D A Deep dredge, harbor and/or channel capacity D T Panama Canal Expansion Project D F Local Funding (Matching Requirements) D F Federal Funding D F Harbor Maintenance Tax (HMT) D N Maintenance Dredging D EF Tidal Restrictions on Vessel Movement D R WRDA (Issue) D R USACE Joint Permitting Process D E NOAA Marine Fisheries Service permit review (NMFS) C CA Cargo Handling Equipment Needs C A Access to Markets C CA On-port Warehousing Improvements Needs C CA Bulk Cargo Expansion Needs C E Alternative Fuels - LNG/CNG, Ethanol, Wind Energy C EF Post Panamax Container Cranes C CA Reefer Cargo Needs (Warehousing or Reefer Plugs) C CA Auto Cargo Expansion Needs RO/RO C R Customs and Border Protection - Cargo B CA Increased Bulkhead and Berthing Infrastructure B A Expansion of Mooring Areas B N Bulkhead and Berthing Infrastructure B F Local Funding Match on Berth and Bulkheads CT T Vessel Size Increase CT A Cruise Parking - Passenger Access CT F Cruise Terminal Development CT R Customs and Border Protection - Cruise M T Studies, Plans, Economic Analysis M EF Changing Technology M R Educate Federal and State Lawmakers and Public M T Open Trade with Cuba (Helms-Burton Act) M T Data Acquisition and Technology M T Nearshoring of Manufacturing (international shift) M T Proximity to Caribbean, Central and South America M T Foreign Trade Zones (Manufacturing or Distribution) M T West Coast to East Coast Cargo Shift M F Private Sector Investments (P3) M T Jones Act Issues M T Container Line Alliance Issue O CA Off-port Distribution, ILC or Storage I A Highway Access or Bottleneck I EF Rail Service I A Rail Service (Terminal or On-dock Rail Access) I CA Rail Capacity (storage yards, sidings, passing tracks) I EF Highway (Cruise and cargo traffic interaction) I R Truck Regulations (HOS, weight limits, gate appt...) I CA Trucking Services Providers and Driver Shortages I EF Truck Parking (full service rest stops near ports) I F Highway Trucking Tolls (Regional Movements) S CA Site Expansion Development Needs S EF Container Yard Densification S EF Intermodal connections (i.e., Transloading) S E Off-site Compensatory Stormwater Treatment L F Land Acquisition and Purchasing L F Funding for Freight Zones SS EF Gate Operations SS A Security Access SS N Navigation Issues (Vessel Traffic Delays) SS R Security Regulations SS N Bridge Issues (congestion, vessel air draft clearance) SS EF Bridge or Air Gap Clearance SS F Security Funding SS N Derelict Vessels D Florida Seaport System Plan FDOT
199

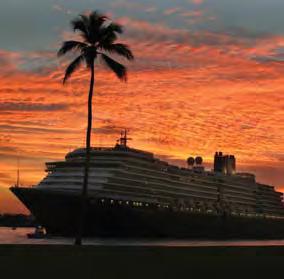
200 Prepared for: