Scenario Planning in an Uncertain Future
|
|
|
- Oliver Lewis
- 5 years ago
- Views:
Transcription
1 Scenario Planning in an Uncertain Future Maren Outwater June 21, 2017

2 The Next 100 Million People in the U.S. US population growing at higher rate than rest of world s developed nations For transportation planning, national totals are not that interesting Which sectors will be growing? (age, employment, income, etc.) Who will be living where? 2

3 Sources of Population Growth Projected growth. One third natural Two thirds from net international migration But, immigration rates depend on a lot of things. National economies Climate change Geopolitics 3
4 Acculturation Leads to More Auto Trips New immigrants are less likely to own a vehicle and more likely to use transit. Acculturation occurs within a decade or two. 4

5 America is Graying Significant increase in population age 65+ due to Baby Boomers Levels off, until Millennials hit 65? 5
6 Traveler Attitudes Vary by Age Sharing modes preferred by younger people Source: RSG survey data 6
7 Thousands Changing American Workforce Labor-force participation rate declining, but average retirement age increasing Workforce is growing older and more diverse Future trends will depend on the supply of jobs and who will have the needed skills Could vary a great deal by region 120, ,000 Civilian Labor Force by Age (Millions) 80,000 60,000 40,000 20, to to and older Source: BLS, Monthly Labor Review, December 2013; Toossi, M. December Labor Force Projections to 2022: The Labor Force Participation Rate Continues to Fall. Monthly Labor Review. U.S. Department of Labor, Bureau of Labor Statistics. 7
 Source: US Census Bureau, taken from Commuting in America IV")
8 (Sub)urbanization of America Metro areas contain 85% of all population (~ 50% in 1950) Suburban areas contain about 71% of all Metro population (~25% in 1950) Source: US Census Bureau, taken from Commuting in America IV Brief 4 8

9 Distribution of Income Increasing segregation and gentrification Fewer middleclass neighborhoods 9
10 Addressing Uncertainty
11 Sources of Uncertainty Interactions between sources can be significant Uncertainty increases as precision in the inputs and forecasts decreases Transportation Investments Transportation Policies Demographics New Technologies Economics 11
12 Scenario Planning Addresses Uncertainty Uncertainty in exogenous inputs Uncertainty in model relationships Variety of relationships that could be important Time 12
13 Strategic Models Support Scenario Planning Focus on dynamics of change Limit spatial detail Represent interactions between forecast assumptions Identify range of plausible future assumptions Run all plausible combinations of future assumptions as scenarios Evaluate range of outcomes 13
14 Strategic Models Complement Detailed Regional Forecasting Models Regional Model - Spatial detail is very important - Focus is on quantitative accuracy in input data and model parameters - Running the model and analyzing results is timeintensive Strategic Model - Limit spatial detail, run model over many years - Focus is on including a wide range of model relationships, and on qualitative accuracy - Running the model is relatively quick and easy Different from sketch planning tool a different type of model 14
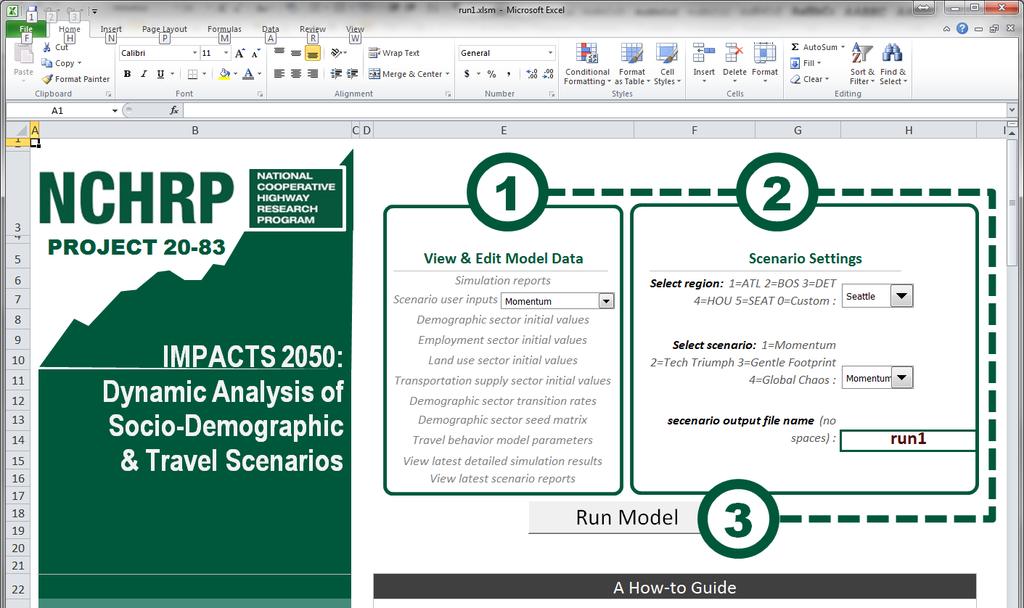
15 Impacts 2050 Dynamic Representation of Socio- Demographic & Travel Scenarios
16 Impacts 2050 Is... A strategic scenario analysis tool Based on a Systems Dynamics approach that represents the co-evolution of population, land use, employment, transport supply and travel behavior Scenarios representing divergent visions of alternative futures 16
17 Systems Dynamics Models The focus is on relationships between variables over time (rates of change). Behavior results from feedback between system components (can be limiting effects or reinforcing cycles) Developed at MIT in 1960 s for industrial systems (Forrester). Limits to Growth Club of Rome study (Meadows, et al s) Urban Dynamics (Forrester, 1970 s) Many applications since in many different fields. 17

18 System Dynamics Model 18
19 Socio-Demographic Transition Basic rates derived from analysis of the Panel Survey on Income Dynamics (PSID) Rates for: Birth Death Marriage Divorce Leave nest/empty nest Enter/leave workforce Enter/leave income group Rates vary by combination of: Age group Household type Race/acculturation The user can apply scenario-specific multipliers on these rates 19
20 Socio-Demographic Migration Three types of migration: Foreign (from / to other countries) Domestic (from / to other regions of the US) Regional (from / to other area types in the region) Base rates are derived from Census data, and modified by: Residential attractiveness function of demand vs. supply of jobs, housing, road capacity User-defined scenario effects 20
21 Other feedbacks The Employment Sector A very simple model of job creation, loss & migration The Land Use Sector A very simple model of transition of land between residential, non-residential, undeveloped & protected The Transportation Supply Sector A very simple model of capacity addition and retirement for roads and transit These feedbacks can be turned on or off to investigate the difference between unconstrained and constrained demand, and between responsive and unresponsive supply 21
22 22
23 Pre-Programmed Scenarios Based on Delphi panel deliberation Momentum Change is based on population dynamics Technology Triumphs Innovations mitigate difficult challenges Gentle Footprint Public consciousness and political shifting toward taking serious action to curb climate change Global Chaos Distressing new normal financial instability, climate change impacts, isolationism 23
24 Trips by Mode Momentum Gentle Footprint Tech Triumphs Global Chaos 24
25 For more information The project report, scenario tool and user s guide is available for download from TRB Follow-up project to work with an MPO and DOT to implement the tool with local staff. 25
26 Rapid Policy Assessment Tool (RPAT)


27 Rapid Policy Assessment Tool (RPAT) RPAT is a tool for scenario planning. Scenario planning is a data-driven process that seeks to explore many potential futures. RPAT is fast and easy to apply. 27
28 Strategic Planning Strategic models Supports strategic (not project) planning efforts Provides data that bridge the gap between regional visioning and strategic plans Why is it strategic? Considers many possible scenarios Combines high-level analysis of transportation supply with transportation policies and demand characteristics. Regional Visioning Strategic Planning Transportation Plans 28
29 Quickly compare changes in travel demand, transportation policies and transportation supply. 29

30 Built Environment and Land Use Classify growth by area type and development type 30
31 Performance Metrics Evaluate scenarios across a range of performance metrics Community Impacts Travel Impacts Environmental and Energy Impacts Financial and Economic Impacts Location Impacts Compare multiple scenarios at a time graphically to quickly assess results 31

32 Household and Firm Synthesis Households Persons by Age from Census data HH Income from Bureau of Economic Analysis data Firms Employees Industry from County Business Pattern data Data can be updated from local sources 32

33 Urban Form Models Predicts Place Types Area Types (4) Development Patterns (4) Based on Households with Working age persons Children Seniors Adjusted to fit regional totals 33


34 Accessibility INPUTS Freeway Lane Miles Transit Revenue Miles (annual bus and rail revenue miles per capita) OUTPUTS Freeway Lane Miles per Person Transit Revenue Miles per Person 34
35 Vehicle Models Predicts number of vehicle for each household Autos Bikes Light Trucks Predicts vehicles by age/ fuel efficiency Based on Number of persons of driving age Elderly persons Household income Population density Freeway and transit supply Urban mixed-use area Household Income Zero Vehicle Models Vehicle Age Model Vehicles by Age Population Data More Drivers than Vehicles Models Vehicles per Household Fuel Efficiency Highway and Transit Supply Equal Drivers and Vehicles Models Vehicle Type Model Light Truck Proportions Urban Form Data Less Drivers than Vehicles Models Non-Motorized Vehicle Model Non- Motorized Vehicles Model Component Data Input Model Output 35

36 Travel Demand Models Predicts Vehicle Miles Traveled for each Household Autos and Light Trucks Heavy Trucks Buses and Passenger Rail Based on Household income Population density Number of household vehicles Freeway and transit supply Driving age persons in household Elderly persons in household Mixed use development 36
37 Congestion and Induced Demand Congestion is represented in three ways 1. VMT is allocated to freeways and arterials by congestion level 2. Speeds and fuel economies are calculated for freeways and arterials 3. Congestion in local areas is estimated from increased activity Congestion is part of a feedback loop between changes in each scenario and induced demand. Induced demand is defined as additional demand resulting from adding transportation supply Short Term Induced Demand Changes in road supply, function of speed Potential mode and route shift Long Term Induced Growth Changes in growth patterns resulting from changes in travel patterns 37

38 Outputs Selecting Performance Metrics and Producing Reports 38
39 For more information RPAT software, research and user s guide is available at -policy-analysis-tool.html There are resources and a technical forum on the RPAT website as well. 39

40 Contacts MAREN OUTWATER, PE Vice President