A statistical overview of the economic situation in the euro area
|
|
|
- Paula Harris
- 5 years ago
- Views:
Transcription

1 A statistical overview of the economic situation in the euro area By Gian Luigi Mazzi and Rosa Ruggeri Cannata Florence, 25 April 2014 EUI-nomics 2014
2 Outline Latest PEEIs figures GDP growth estimates for the first quarter 2014 EuroMind Euro area institutional forecast Euro area cyclical monitoring Macro-economic imbalances procedure
3 Latest PEEIs figures Introductory remarks PEEIs: a tool for short-term economic monitoring based on official statistics Picture for the euro area still very incomplete for 2013 few monthly data no quarterly data Updated picture for the euro area - combining official statistics and econometric techniques
4 Latest PEEIs figures 2012q3 2012q4 2013q1 2013q2 2013q3 2013q4 GDP % (Q/Q-1) -0,2-0,5-0, % (Q/Q-4) -0,7-1,0-1,2-0,6-0,3 0,5 Employment % (Q/Q-1) ,3-0,4 0,0 0,0 : % (Q/Q-4) -0,6-0,7-1,0-1,0-0,8 : 2013m m m m1 2014m2 2014m3 HICP % (M/M-1) -0,1-0,1 0,3-1,1 0,3 1,0 % (M/M-12) 0,7 0,9 0,8 0,8 0,7 0,5 PPI % (M/M-1) -0,4-0,1 0,2-0,3-0,2 : % (M/M-12) -1,3-1,2-0,8-1,4-1,7 : Import price % (M/M-1) -0,9 0,0 0,0-0,4-0,1 : % (M/M-12) -2,9-2,7-2,2-2,6-2,9 : IPI % (M/M-1) -0,6 1,6-0,3 0,0 0,2 : % (M/M-12) 0,4 2,7 1,2 1,6 1,7 : Retail trade % (M/M-1) -0,4 1,1-1,2 1,0 0,4 : % (M/M-12) -0,4 1,4-0,4 0,8 0,8 : Unemployment rate % 11,9 11,9 11,9 11,9 11,9 : ESI Index 98,1 98,8 100,4 101,0 101,2 102,4
5 Latest PEEIs figures: some comments Very low inflation rate constantly below 1.0 % Stable unemployment rate at 11.9% Very uncertain path of Industrial Production Index Regular improvement of the economic sentiment indicator above 100% since December 2013
6 GDP growth estimates for the first quarter 2014 estimates for the Euro area GDP growth based on 3 competing models Small-scale factor model with soft data only Small-scale factor model with hard and soft data Bridge model with hard and soft data Comparative analysis with some external leading indicators freely available Euroframe EuroCoin IRC
7 GDP growth estimates for the first quarter 2014 factor model (soft data) factor model (hard and soft data) Bridge model (hard and soft data) Euroframe EuroCoin 0.35 IRC 0.48
8 GDP growth estimates for the first quarter 2014: some comments Large consensus among various indicators Only Euroframe produces higher estimates than the remaining indicators models show a very small range of variation from 0.38% to 0.47% The GDP growth for the first quarter should be likely between 0.40% and 0.50 %
9 EuroMind Monthly indicator of economic activity Proxy of GDP Combining Stock and Watson approach with temporal disaggregation in the state-space framework Monthly EuroMind estimates calculated by aggregation of all output and expenditure sides component: reconciliation obtained by weighted averages of the two monthly estimates
10 EuroMind chain-linked volumes


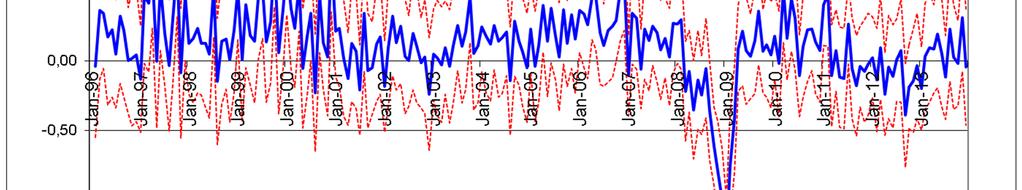
11 Monthly growth rates
12 Yearly growth rates
13 EuroMind extensions EuroMind-S: more coincident version of EuroMind based on a two factor Stock and Watson model where one factor models the effects of qualitative information EuroMind-C: medium size factor model simultaneously modelling euro area and largest economies EuroMind-B: back calculated version of EuroMind to 1970 No back calculation of components available EuroMind-Gap: euro area output estimates derived from EuroMind by means of a state-space modelling of trend and cycle Going beyond EuroMind point estimates Constructing density estimates for EuroMind and EuroMind-S
14 670000,0 EuroMind-S chain-linked volumes EuroMInd-S ,0 Volume chained 2000 prices , , , , ,0 EuroMInd-S Lower 95% Upper 95% , ,0

15 Monthly growth rates
16 Yearly growth rates
17 Quarterly GDP Growth rates: comparison among indicators Feb Mar Apr May Jun Jul Aug Sept Oct Nov Dec Jan Feb variations over previous period EuroMind EuroMind -S variations over same period of previous year Quarterly GDP EuroMind EuroMind -S
18 EuroMind comments Signals of recovery shown by EuroMind at the beginning of 2014 On monthly basis: January % On yearly basis: January % Positive trend confirmed by EuroMind-S for February 2014 On monthly basis: February % On yearly basis: February % Standard errors of the estimates increasing for the latest periods Higher degree of volatility of some monthly statistics -Industrial production Index Persistent effects of the recent crisis
19 Euro area institutional forecast Main sources European commission: Winter 2014 forecast OECD: Economic outlook volume 2013/2 ECB: March 2014 ECB staff macro-economic projections for the euro area IMF: WEO update 14 April 2014


20 Euro area institutional forecast
21 Euro area institutional forecast: some comments Quite good consensus among institutional forecasts Some differences also due to the different timing of the forecast publication No deflationary risk but persistency of a very low inflation Stable GDP growth but still moderate Stable unemployment at very high rates
22 Euro area cyclical monitoring Euro area dating: business, growth, and acceleration cycle non-parametric dating rule Euro area system for turning point detection: three coincident indicators BCCI: Business Cycle Coincident Indicator GCCI: Growth Cycle Coincident Indicator ACCI: Acceleration Cycle Coincident Indicator
23 Euro area cyclical monitoring BCCI: averaging probability recessions returned by univariate Markov switching models fitted to each of the three component series: unemployment, industrial production index, new car registrations GCCI: averaging probability recessions returned by univariate Markov switching models fitted to each of the five component series: industrial production index, construction confidence indicator, financial situation of households during the last 12 months, imports of intermediate goods, employment expectations ACCI: recession probability returned by the Markov switching model fitted to the Economic Sentiment Indicator
24 Euro area cyclical monitoring MS-VAR GCCI and MS-VAR BCCI MSIH(4) VAR(0) model fitted on 4 variables 1) Industrial Production Index (differenced over 6 months) 2) Unemployment Rate (inverted diff. over 1 month) 3) New Passenger Car Registrations (diff. over 3 months) 4) Employment Expectations (diff. over 1 month) Both indicators jointly obtained as a by-product of model parameters estimation: MS-VAR BCCI filtered probabilities of the first regime of the state-variable (regimes of the latent Markov-chain are sorted in ascending order of the state-dependent intercept); MS-VAR GCCI sum of filtered probabilities of the first and second regimes.
25 Euro area cyclical monitoring Advantages and drawbacks of multivariate approach versus univariate one Automatic fulfilment of the ABCD sequence Higher timeliness Slight increase of the Type-II error for the MS- VAR-GCCI
26 Euro area cyclical monitoring ACCI
27 Euro area cyclical monitoring MS-VAR BCCI
28 Euro area cyclical monitoring MS-VAR GCCI
29 Economic Cycle Coincident indicator Provisional Dating of the Acceleration Cycle Acceleration ACCI Cycle Provisional Dating of the Growth Cycle Growth Cycle MS-VAR GCCI Indirect MS- VAR GCCI Provisional dating of the Business Cycle Classical MS-VAR Business Cycle BCCI Indirect MS- VAR BCCI Peak Trough Peak Trough Peak Trough 2006 Q Q Q2* June 2006 March 2009 December 2010 December 2011 March 2012 October Q Q Q2* Decembe r 2007 Novembe r 2007 Septemb May October er * July 2009 July April Q Q Q3* April 2008 June 2008 Septemb er 2009 June 2009 July May
30 Euro area cyclical monitoring Member countries extension Non-parametric chronologies for BCCI and GCCI in progress for member states Already available for 11 countries Coincident turning point indicators for growth cycle and business cycle for member states in progress Based on MS-VAR only Already available for 7 countries Full coverage of the euro area expected by end of 2014
31 Euro area cyclical monitoring Models summary by country Country Model Recessions Slowdowns Variables (differentiation order) IPI UR BUI L IN D CON S RET A Belgium MSI(4)-VAR(0) R1 R1+R France MSIH(4)-VAR(0) R1 R1+R Germany MSIH(4)-VAR(0) R1 R1+R Italy MSIH(5)-VAR(0) R1 R1+R Netherlands MSIH(4)-VAR(0) R1 R1+R Portugal MSI(5)-VAR(0) R1+R2 R1+R2+R Spain MSIH(4)-VAR(0) R1 R1+R
32 Peak Troug h Peak Trough Peak Troug h Peak Trough Peak Troug h Peak Trough Germany France Italy Spain the Netherlands Belgium Growth Cycle 04/01 05/05 05/08 07/ 09 10/11 03/13 Business Cycle 11/ 02 04/03 11/08 06/09 Growth Cycle 11/00 08/03 09/07 08/09 08/11 08/13 Business Cycle 07/08 05/09 Growth Cycle 10/01 08/03 12/07 06/09 07/11 04/13 Business Cycle 01/03 05/03 12/07 04/09 08/11 04/13 Growth Cycle 04/01 10/03 09/07 11/09 07/10 08/13 Business Cycle 03/ 08 11/09 07/11 04/13 Growth Cycle 02/01 10/03 06/08 12/09 03/11 02/13 Business Cycle 10/08 12/09 03/11 10/11 Growth Cycle 08/00 08/03 02/05 09/05 09/07 09/09 05/11 Business Cycle 10/01 12/01 09/08 04/09 05/12 06/12 Portugal Growth Cycle 07/98 05/03 10/04 09/05 06/06 07/06 07/07 05/09 07/10 07/13 Business Cycle 01/02 05/03 07/05 08/05 06/08 05/09 10/10 03/12
33 Finland Growth Cycle 2000 Q Q Q Q Q4 Business Cycle 2008 Q Q Q4 Austria Growth Cycle 2000 Q Q Q Q Q2 Business Cycle 2008 Q Q2 Greece Growth Cycle Business Cycle 2008 Q3 Ireland Growth Cycle 2000 Q Q Q Q Q Q1 Business Cycle 2007 Q Q Q Q1 Peak Trough Peak Trough Pea k Trough Peak Trough Peak Trough Pea k Troug h
34 Euro area cyclical monitoring: some comments Since beginning of 2013, euro area and the majority of member states went out from the recession and slowdown phases In the period , Germany, France and Austria experienced only a slowdown phase of the growth cycle but not a recessionary phase of the business cycle Finland didn't reach yet a trough for the business cycle and the growth cycle Belgium didn't reach yet a trough for the growth cycle
35 Euro area cyclical monitoring: some comments (cont.) With the global financial and economic crisis synchronisation across euro area member countries started to decrease Currently, member countries turning points are neither well synchronised nor well diffused Tricky situation since an optimal currency area requires an high degree of synchronisation across its members
36 MIP Headline Indicators Scoreboard External Imbalances Balance of Payments Current account Net international investment Competitiveness Internal Imbalances House price developments Private credit flow Private debt General government debt Unemployment rate plus Real effective exchange rate (REER) Total financial sector Share of world exports liabilities Nominal unit labour cost (since second exercise) 36
37 Scoreboard flashing indicators IE 6 IDR -imbalances (just out of programme) IT 3 IDR - Excessive Imbalances ES 6 IDR -imbalances UK 3 IDR -imbalances CY 6 programme HR 3 IDR - Excessive Imbalances PT 6 programme SE 3 IDR -imbalances EL 5 programme EE 2 NL 5 IDR -imbalances SI 2 IDR - Excessive Imbalances DE 4 IDR -imbalances SK 2 FR 4 IDR -imbalances BG 2 IDR -imbalances LU 4 IDR -No imbalances DK 2 IDR -No imbalances HU 4 IDR -imbalances LV 2 BE 3 IDR -imbalances LT 2 MT 3 IDR -No imbalances PL 2 AT 3 RO 2 programme FI 3 IDR -imbalances CZ 1
38 Macro-economic imbalance procedure In-depth reviews (IDRs) countries under IDR: 16 announced in November plus IE exiting the programme Excessive Imbalances: HR, IT, Sl Imbalances for 11 out of 17 No imbalances : DK, MT, LU (first exercise) Specific monitoring of policy implementation for: HR, IT, Sl and IE, ES and FR SGP: for FR and SI risk of non-compliance with 2014 budgetary target
39 Reading the scoreboard At least one indicator was outside the thresholds for all MSs (without CZ, all MSs at least 2) 6 out of 11 is the maximum number of flashing indicators (7 in the Scoreboard 2011 as published in 2013) For RO, under financial assistance programme, only 2 indicators are flashing: CA and NIIP Some indicators are no flashing at all: HPI yoy, private sector credit flow, total financial sector liabilities yoy
40 Reading the scoreboard (cont.) The scoreboard is a set of interlinked indicators: no single indicator can capture all potential risks The number of flashes is not the key criteria The severity of a breach of a threshold can be considered The analysis is based on a larger set of indicators Evolution over time has to be analysed too 40
41 Thank you for your attention! 41