Clusters, Supply Chains, and the Freight Economy. Minnesota Freight Advisory Committee Lee Munnich September 30, 2016
|
|
|
- Brice Cross
- 5 years ago
- Views:
Transcription

1 Clusters, Supply Chains, and the Freight Economy Minnesota Freight Advisory Committee Lee Munnich September 30, 2016


2 Transportation Policy and Economic Competitiveness (TPEC) Ensure Minnesota is at the forefront of transportation in support of economic competitiveness. Provide academicallybased research and insight on industry clusters, finance, technology, and other key areas.


3 TPEC Three-Part Focus Financing. Funding of the surface transportation system will continue to be a critical issue at all levels for the foreseeable future. Industry Clusters. There is a large and increasing amount of research identifying a strong link between transportation and economic competitiveness. Technology. Major changes in technology are imminent and will require major changes in public policy.

4 Source: US Cluster Mapping Website
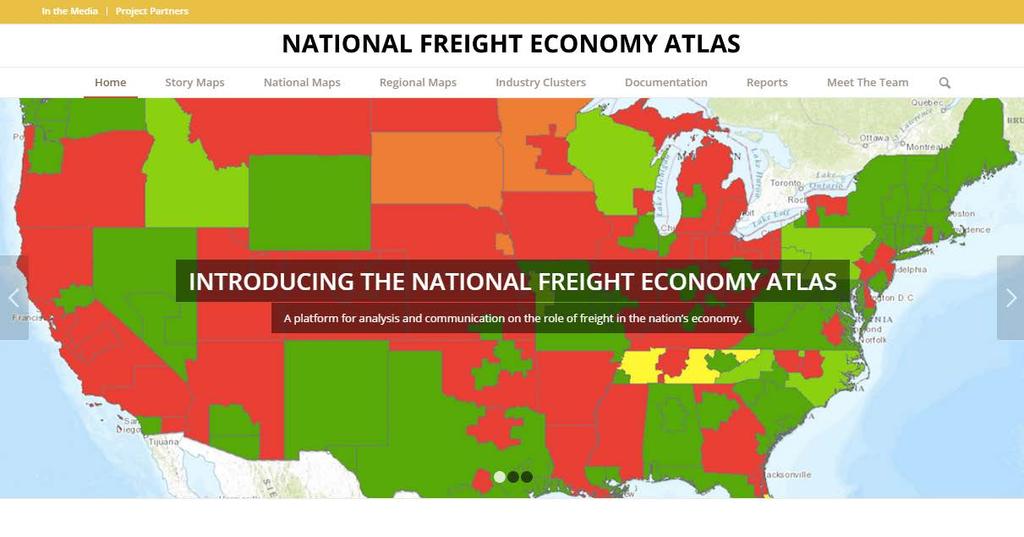
5
6 Analytical Process Identify industry clusters: Apply cluster analysis to land use Locate commodity freight flow concentrations: Using hotspots analysis, identify local freight-intensive routes Identify state freight-intensive corridors through flow concentrations: Utilizing the data on commodity flows augmented with the LQ function at the state-level Identify regional freight corridors: Utilizing the data on commodity flows augmented with the LQ function at the regional-level FHWA criteria applied to identify regional freight corridors (i.e. highways segments with at least 8,500 trucks per day, highway parallel to rail lines with high volume, & rail and waterways with more than 50 million ton of bulk cargo) Identify national freight flows network (U.S. supply chain): Utilizing the data on commodity flows augmented with the LQ function nation-wide Analyze the economic impact of industry clusters and commodity flows Apply freight transportation intensity function a ratio of total ton-miles to Gross State Product & Gross Domestic Product to show the actual freight activity required to produce one unit of goods and services at either state- or national-level (acquired from BTS)

7 Analytical methods: Clusters and Hotspots Clusters analysis: Identifying industry clusters through landuse metropolitan areas, statistical areas, and local municipalities Hotspot analysis: Locating freight-intensive corridors by freight flows state, regional, and national Note : This analysis identifies Minnesota industry clusters through land use by commodity code Location of Minnesota Intermodal Facilities & Warehousing/transportation industry cluster Note : The analysis identifies the Minnesota freight-intensive routes to intermodal facilities Concentration of Minnesota Average Annual Daily Truck Traffic


8 Analytical methods: LQ of commodity flows National maps and analysis: LQ of commodity flows Regional maps and analysis: LQ of commodity flows


9 Case Study Analysis: Story maps Page 1 A story map is a strategy of using a graphical organizer to provide a narrative of elements on a topic or a description of a series of events through a story-telling application. An example story map of the transport of agricultural products originating in Minnesota distributed across the Great Northern Corridor is provided below. Page 3 Page 2 Page 4
10 Case Study: Medical Devices and Health Sciences Medtronic: Show the supply chain for pacemakers made by Medtronic Method- Identify supply chain through online information Create visualization representation Visualize the analysis

11 Medtronic Started in a Twin Cities garage in the 1940s Headquarters in Dublin, Ireland Pacemaker, first major product Product Groups: Cardiac/Vascular Restorative Therapies Minimally Invasive Therapies Diabetes Ships to 155 different countries, 80 distribution centers globally, and 70 manufacturing plants
12 Transport, logistics, & Supply Chain State licensing has a significant impact on medical device distribution, manufacturing, and trade Lithium battery restrictions Uses a variety of transportation options depending on size and cost of product Memphis, the critical supply chain juncture


13 Medtronic Supply Chain c7beaa8cce67
14 TPEC -Quetica Collaboration Title: "Midwest Supply Chain Optimization Atlas Objective: To enhance the understanding of transportation infrastructure constraints to supply chain performance in the Midwest and consideration of alternatives to achieve supply chain optimization. States: Minnesota, Iowa, Illinois, Missouri, Wisconsin, Nebraska Platform: Esri GIS Platform hosted on National Freight Economy Atlas provided by TPEC/CGU

15 What is Supply Chain Network Optimization? Commonly used by private companies to design and optimize global supply chains to improve services and/or reduce costs Applying same practices to optimization of state and local freight networks to: Lower the cost of transportation for businesses Increase transportation responsiveness and predictability Incentivize business expansion Identify commercial freight road networks that are irrelevant Reduce road freight / truck traffic Improve transportation network resiliency
16 Comparing Base Year Domestic Freight Flows Data Source: FAF 3.5, Federal Highway Administration

17 Midwestern states much more rail dependent than the coasts GDP share specialization in rail transportation is much higher in Midwestern states
18 TPEC Quetica Collaboration 1. Determine data to be used in Atlas and means/format for analysis. 2. Analyze Midwest supply chain constraints. 3. Create maps and case study storymaps of constraints. 4. Provide selective analysis and visualization of constraints and alternatives for optimization.
19 Questions?