Data Sources and Performance Measures for the Marine Transportation System
|
|
|
- May Barber
- 5 years ago
- Views:
Transcription


1 Data Sources and Performance Measures for the Marine Transportation System Ned Mitchell, PhD Research Civil Engineer Coastal and Hydraulics Lab TRB 5 th International Transportation Systems Performance Measurement and Data Conference Denver, CO June 2, 2015


2 Background Corps is resource-constrained but must maintain an aging water resources infrastructure portfolio that is critical to national well-being. Navigation projects at coastal ports and along inland waterways facilitate marine transportation and help support complex, dynamic, global freight supply chains. Challenge going forward is how to optimally support these existing and emerging freight corridors using available resources.
 systems.")

3 Intermodal Freight Systems Waterborne freight corridors cannot truly be separated from landside (road, rail, pipeline) systems. Federal policy discussions and sponsored research increasingly center on intermodal systems and the need to evaluate supply chains across modes. USACE Leadership has been stressing systems-based approaches to Civil Works mission execution.

4 Marine Transportation Data Spectrum Reported (but not observed!) data U.S. Customs Directly observed in transit LPMS data Continuous system monitoring Inland barge data AIS Tradeoffs


5 Some Public Data Sources
 over last 25 years.")
6 Dredging Information System (DIS) Thousands of dredging events (O&M and new deepenings) over last 25 years. Location, quantities of material moved, cost, start/end dates.


7 Entrances and Clearances Reconstructed trip chains for container vessels calling at multiple U.S. ports Vessel draft provides a way to infer net cargo on/offloaded Could be coupled with separate port-level counts of TEUs, tonnage, etc.

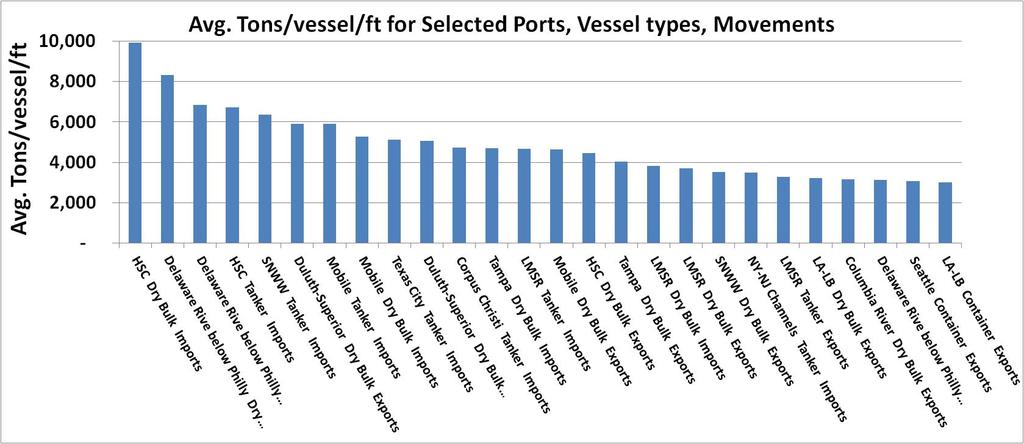
8 National Waterway Network Transiting tonnage totals by commodity group for waterway segments around the U.S. Spatial network for GIS application development Segment-level flows and transfers to/from road/rail/pipeline can be inferred.

9 Waterway Freight Corridor Examples Soybeans Coal Chemicals BUILDING STRONG Fuels
10 Tons per voyage analysis: National Summary
11 Tons per voyage analysis: National Summary
12 Vessel Draft Sensitivities


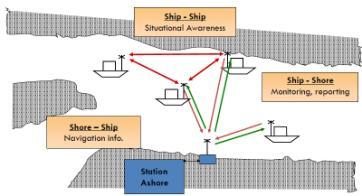
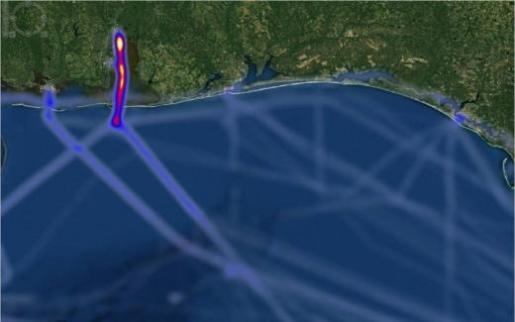
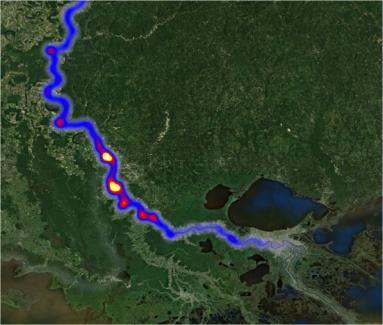
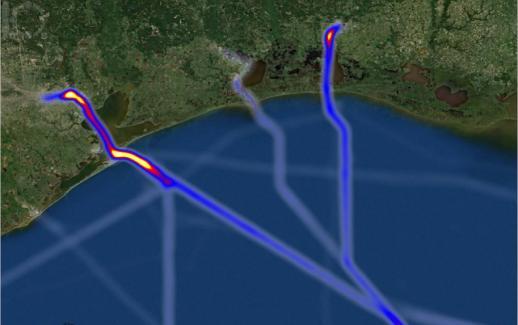
13 Automatic Identification System (AIS) Coast Guard mandate for nearly all commercial vessels operating in U.S. waters. VHF messages broadcast from the vessels to network of shore-based towers at intervals between 2 seconds and 5 minutes depending on operating state. Envisioned for maritime domain awareness, i.e. collision avoidance and port security, but shows great potential for many other applications to the national Marine Transportation System (MTS).
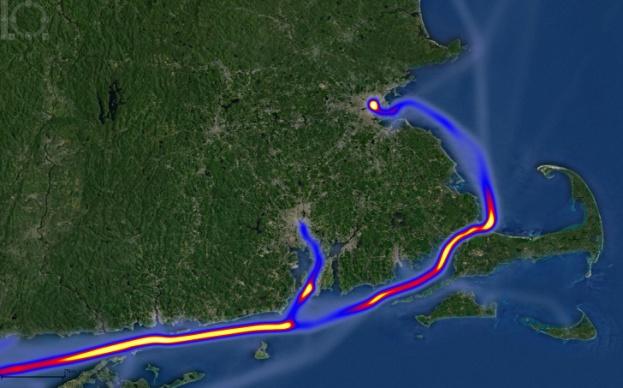
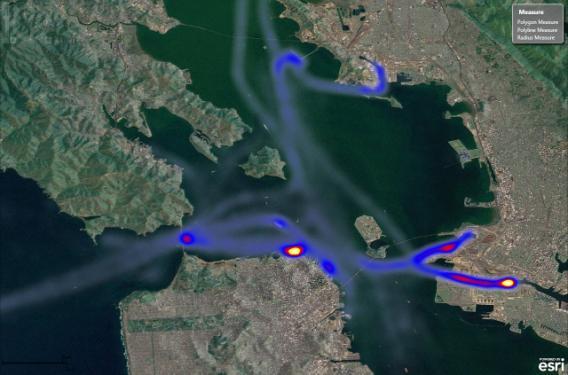
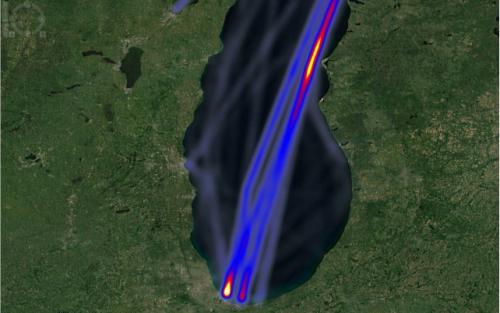
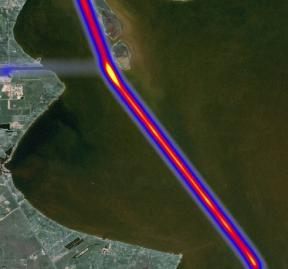
14 Navigation Systems Performance Monitoring via AIS


15 Performance Monitoring via AIS Automatic Identification System Analysis Package (AISAP) traffic densities O-D travel times, dwell times fleet characteristics, movements and seasonal variations traffic response to disruptions or waterway improvements Tidal dependence incident investigations Analyses are scalable across time and space, so single channels can be monitored for a few hours, or entire coasts can be monitored for years.

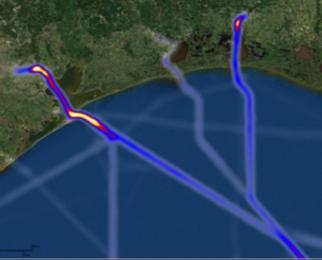
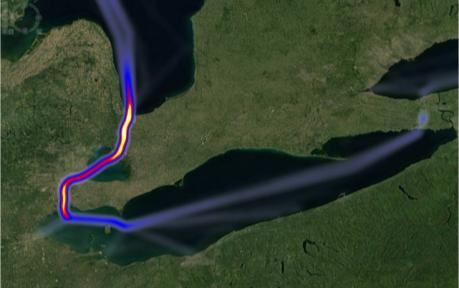
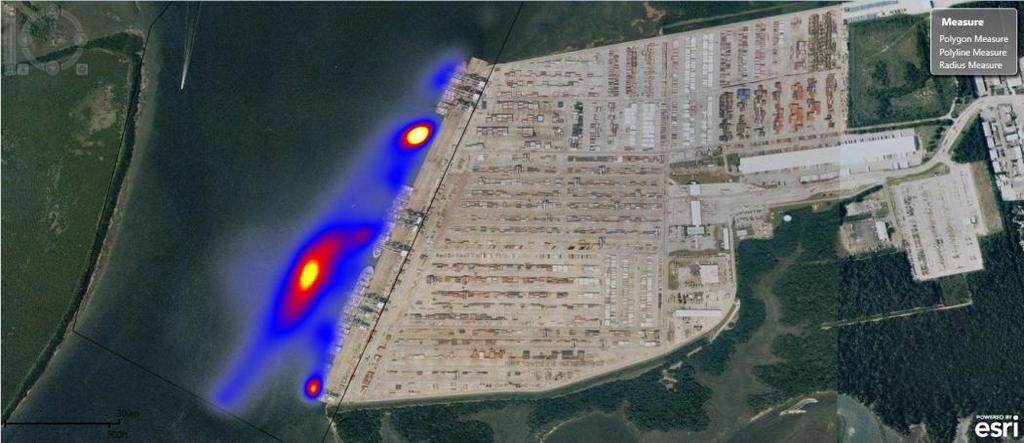
16 Bayport Ship Channel, Texas 16
17 AIS Vessel Transit Data Vessel Speeds Approaching Bayport Flare


18 AIS for Collision Risk Analysis: Use archival AIS data to establish baseline collision risk levels within ports and waterways Compare segments of waterway based on proximity of transiting vessels to one another, with consideration of respective headings, courses over ground, and speeds Several methodologies in the literature, usually with very localized application NAIS provides basis for national assessments
19 Port/Anchorage Dwell Times, Travel Times

20 West Coast Port Slowdown: Oakland
21 West Coast Port Slowdown: Oakland

22 Inland Waterways Example lock service outage
23 Inland Waterways Example Cumulative delay provides an objective baseline, combining congestion metric (avg. delay) with traffic volume. Performance can be tracked through time, comparisons made between locks, and correlations with nearby segments tracked ~> system disruptions.


24 Towards Freight Fluidity Analysis Ultimately we seek a means of evaluating the performance of entire intermodal freight supply chains. Data from across the spectrum help inform this process. Opportunity to merge AIS and GPS probe datasets with traditional reported data to provide a more complete picture of intermodal freight fluidity.
25 Data Sources and Performance Measures for the Marine Transportation System Questions? Ned Mitchell