An Overview of Transportation Issues in the NY Metro Area July 26, 2010
|
|
|
- Egbert Wright
- 5 years ago
- Views:
Transcription


1 An Overview of Transportation Issues in the NY Metro Area July 26, 2010 Joel P. Ettinger, Executive Director New York Metropolitan Transportation Council
2
3 Forecast of Riders Urbanized Area Project Daily Forecast of Riders Dallas North Central LRT 17,000 LA East Side Extension 15,000 Memphis Medical Center LRT 5,500 Minneapolis Hiawatha LRT 24,500 Newark Newark-Elizabeth Portland Interstate MAX LRT 18,100 Salt Lake City University LRT 7,500 Salt Lake City North South LRT 14,000 San Diego Mission Valley East 10,800 San Diego Oceanside-Escondido 19,000

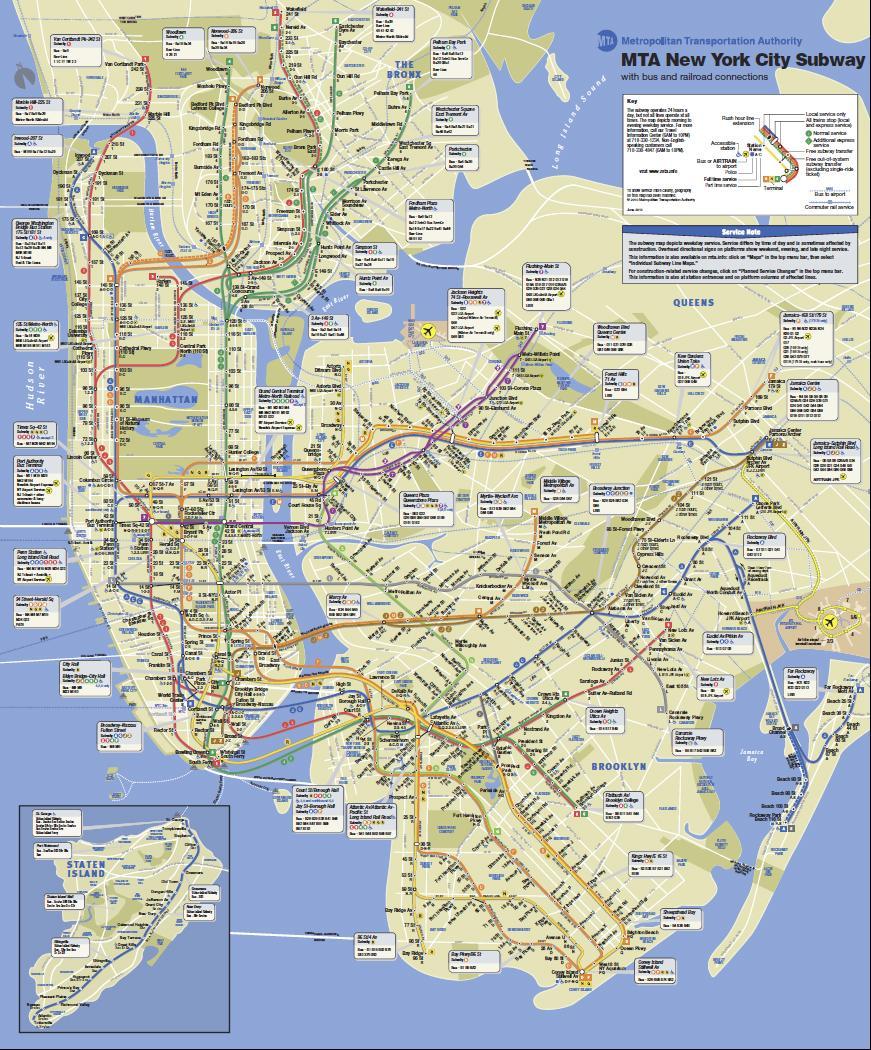
4 Map of the NYMTC Region
5 Structure of the MPO New York Metropolitan Transportation Council Designated by NY State Governor in 1982 Association of Governments Council comprised of chief elected or executive officials: Nine voting members Seven advisory members Council members supported by MPO staff Planning, Technical & Administrative groups Three satellite offices
6 Structure of the MPO (continued) Council includes four permanent committees: Program, Finance and Administration Committee (PFAC) Transportation Coordinating Committees (TCCs) New York City Long Island Lower Hudson Valley
7 What Does the Future Hold? Highway congestion Freight congestion Transit congestion Sidewalk congestion
8 The Challenges of Growth Mean Travel Time to Work %Change 11.5% % NYMTC Region Daily Vehicle Hours of Travel 27.7% Daily Vehicle Miles of Travel 15.8% Daily Transit Trips 21.0% Daily Auto Trips 5.3% Total Daily Trips 10.7% Household Size 0.4% No. of Households 14.0% Civilian Labor Force 13.9% Employment 22.2% Population 15.0% 0.0% 5.0% 10.0% 15.0% 20.0% 25.0% 30.0%
9 Goods Movement Growth


10 NYMTC Members Developed Shared Goals Improve the regional economy; Enhance the regional environment; Improve the regional quality of life; Provide convenient, flexible transportation access within the region; and Build the case for obtaining the resources to implement regional investment.
11 Land Use, Development and Transportation A Critical Juncture Land values influenced by access and mobility Energy uncertainty and the carbon footprint impact transportation

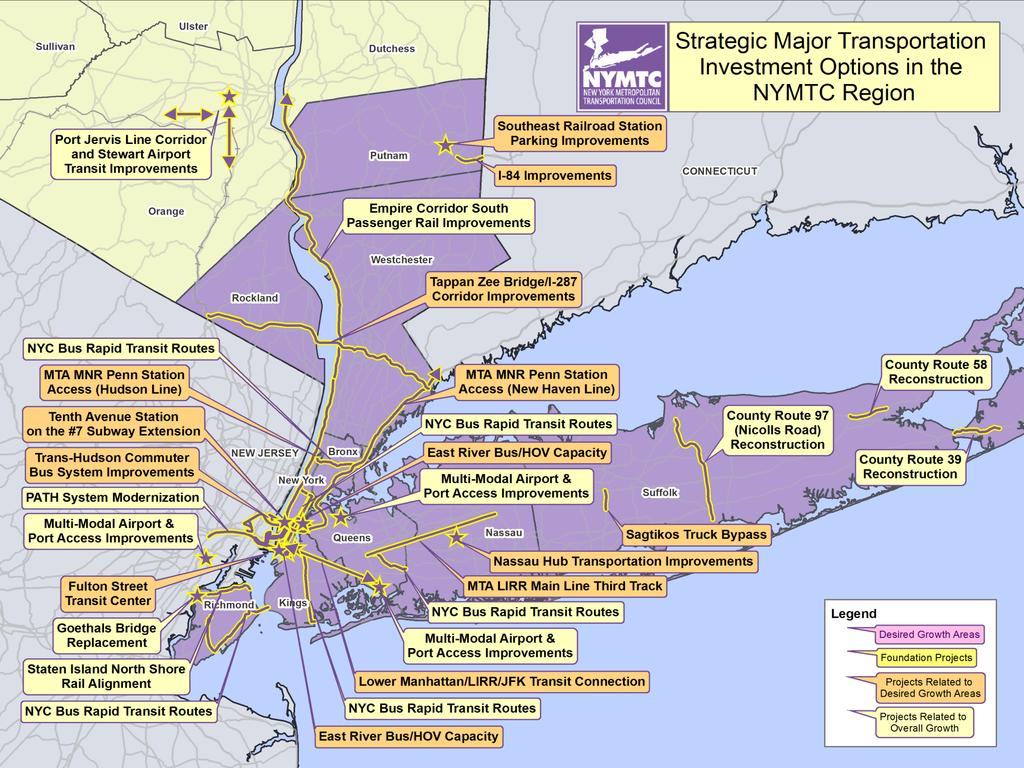
12 Desired Growth Areas Ten desired growth areas
13 The Desired Growth Areas The ten areas could include, if optimized: At least 70 million - and as much as 90 million - square feet of commercial space At least 40,000 - and as many as 70,000 -residential units
14 Role of the Desired Growth Areas The Council members recognize that most of the anticipated growth will occur outside of these areas. However, optimizing growth in these ten areas could accommodate a significant increment of overall regional growth, particularly when combined with strategic transportation investments
15


16 Examples of Additional Investment Options TZB/I-287 Corridor $16.0B Nassau Hub $0.7 - $8.1B MNR Penn Station $1.2B New York City BRT $1.2B Sagtikos Truck Bypass $0.1 - $0.2B LIRR Third Track $0.9B Ped-Bike Element $2.5B Regional Transit Parking $2.0B
17 Estimated Cost of the Strategic Investments Current preliminary estimate: There are over $50 billion in regional strategic transportation investments under consideration or active study


18 Regional Expenditures what do we need to do between now and 2035? Achieve and maintain a "state-of-good repair" for our transportation system to ensure the system's continued ability to move people and goods Purchasing rail cars and buses Rehabilitating track for passengers and freight Repaving and rehabilitating roads and bridges
19 What else do we need to do? Operate, maintain and improve services Commuter rail and subway Buses and shuttle vans Vanpools and shared-ride arrangements Demand management and information services Maximize use of technology in the operation of services
20 What else? Complete four large foundation projects Second Avenue Subway LIRR East Side Access #7 Subway extension Access to the Region's Core rail tunnel

21 What else? Complete numerous smaller mobility and safety improvements In current, fiscally-constrained Regional Transportation Plan and Transportation Improvement Program


22 Financing the Plan: Long-Range Needs and Resources State-of-Good-Repair Operations and Maintenance Foundation Projects Safety and Mobility TOTAL NEEDS FORECASTED RESOURCES Potential BALANCE $289.7 B $661.1 B $29.8 B $5.6 B $986.2 B $998.5 B $12.3 B 97%
23 Implementing the Shared Vision LONG-TERM Based on potential revenue assumptions, roughly $12 billion will likely be available in the long-term for system enhancements But, there are over $50 billion in strategic transportation investments possible
24 Our Essential Dilemma Working individually and jointly as NYMTC... How do the NYMTC member agencies pay for their next round of strategic transportation investments?