THE IMPACT OF HIGHWAY SAFETY FLARES ON DRIVER BEHAVIOR
|
|
|
- Sharleen Garrett
- 5 years ago
- Views:
Transcription


1 THE IMPACT OF HIGHWAY SAFETY FLARES ON DRIVER BEHAVIOR Philip M. Garvey Miguel de la Riva Martin T. Pietrucha ( presented at TRB 2006)

2 Introduction Crashes Involving Collisions with Parked/disabled Motor Vehicles Every year (as of 2005): 507 people are killed. 30,000 people are injured. PDMV crashes are the most frequent type of collision with non-fixed objects. 350,000 PDMV crashes occur. 2


3 Introduction Safety Measures Aimed at Reducing Crashes involving Collisions with Parked/Disabled Vehicles on Highway Shoulders Source: 3

4 Introduction Purpose of Flare Deployment Warn approaching traffic of unusual road hazard. Mark the location of the traffic incident scene. Prompt a safe response from passing traffic. 4
5 Introduction Additional research and more uniform guidance is needed for safe and effective flare deployment Number of flares to deploy Distance between flares Flare deployment pattern Location of the leading flare Added safety benefit of using flares in combination with police car s light bars 5
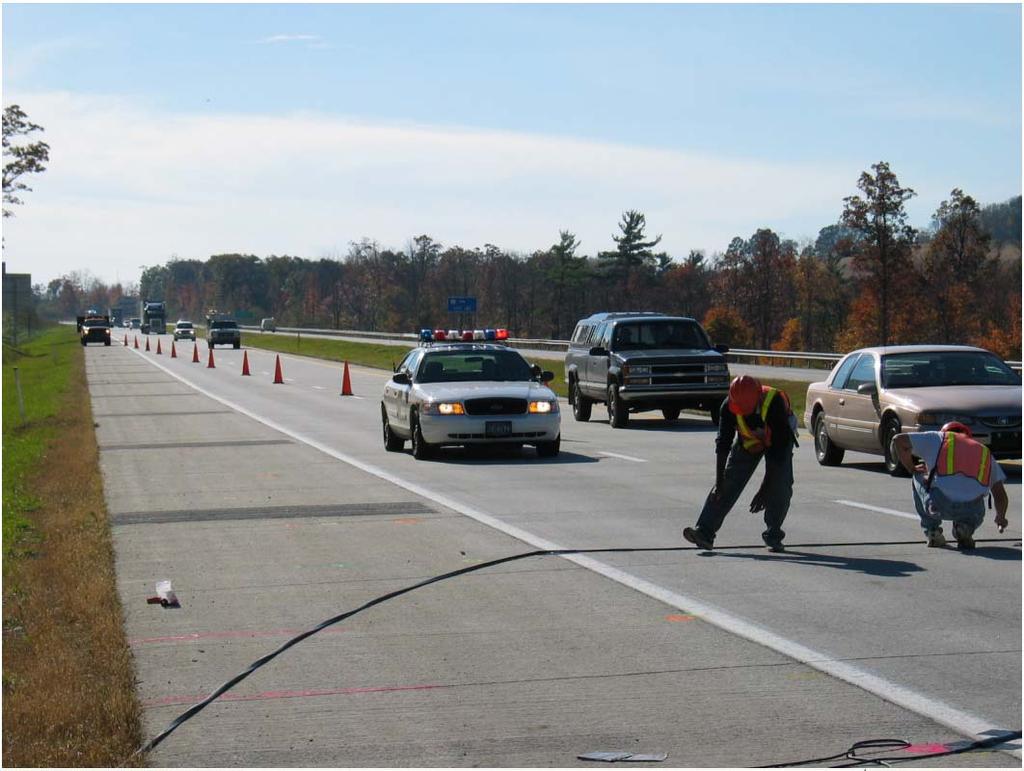
6 Method Site Selection: Blair County, Pennsylvania 6
 Export utility software (TraxproPSU) d) Excel programmed")
7 Method Data Collection Equipment a) Roadway sensors (pneumatic tubes) b) Automatic traffic recorder c) Export utility software (TraxproPSU) d) Excel programmed worksheets 7
8 Method 8

9 Method Data Collection Equipment: Final Configuration 9

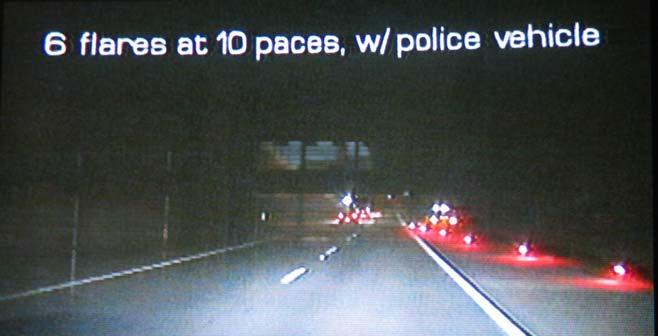
10 Method Base Flare Configurations Tested Three flares Five and Ten paces apart Six flares Five and Ten paces apart 10

11 Method Base Flare Configurations Tested 11
12 Method Roadway Scenarios Tested Road Scenario Treatment Description (a) Police Car + Flares A B C D 3 5 paces 3 10 paces 6 5 paces 6 10 paces (c) Police Car Only E No flares deployed F 3 5 paces G 3 10 paces (b) Disabled + Flares H 6 5 paces I 6 10 paces (d) Baseline None Normal conditions 12
13 Method Measures of Effectiveness / Dependent Variables 13
14 Method Data Collection Schedule and Order of Testing 14
15 Method Statistical Analysis Techniques ANOVA, Bonferroni, and two-sample t-tests were used for analyses of continuous variables. Contingency tables, Chi-square tests, and the Marascuilo procedure were used for analyses of categorical variables. Conventional 0.05 level of significance was used for hypotheses testing. Minitab and Excel used for the computations. 15
16 Results Sample Size 16
17 Results Histogram (with normal curve) of Spot Speeds (Baseline Condition) 17
18 Results Lane Distribution (Baseline Condition) 18
19 Results Lateral Placement (Baseline Condition) 19


20 Results. What happened when treatments were in place? 20
21 Results Spot Speed (Experimental Conditions) Baseline Passing traffic s speed was dramatically reduced 21

22 Results Lane Distribution (Experimental Conditions) Baseline a safer zone was created around the emergency event, since high volumes of traffic at high speeds are now as far as possible from the emergency event. 22
23 Results Lateral Placement (Experimental Conditions) Lateral separation significantly increased. Baseline 23
24 Results Analysis by Traffic Scenario - Speed Baseline A few road flares, stored in your trunk and used under emergency situations, would provide a safety benefit comparable to having a patrol car present at the scene. Police+Flares Police Only Disabled+Flares Baseline 24
25 Results Flare Number - Speed Three Flares vs. Six Flares 25
26 Results Flare Placement - Speed Five Paces vs. Ten Paces 26
27 Results Flare Performance as a Function of Elapsed Combustion Time First 20 minutes Last 10 minutes 27

28 Conclusions & Recommendations Road flares significantly enhance the safety around a traffic emergency event and their use is highly recommended for both personal vehicle operators and road safety professionals as a supplement to their flashing light bars. (Before the 2009 Steer Clear law.) 28