Livability 2050 Regional Transportation Plan Update. RTPAC #3 July 26, 2018
|
|
|
- Edith Berry
- 5 years ago
- Views:
Transcription
1 Livability 2050 Regional Transportation Plan Update RTPAC #3 July 26,
2 Meeting Agenda Timeline Funding Scenarios Funding Availability Project Review Prioritization Process Ground Rules Next Steps 2
3 Timeline Livability 2050 Regional Transportation Plan Oct Plan Kick Off General Input Feb Round One Public Meetings Draft Findings Fall 2018 Round Two Public Meetings Draft Plan Summer 2019 Round Three Public Meetings Sept Plan Adoption We are here! 3
4 Funding Scenarios 4
5 Livability 2040 CONCEPT 1 CONCEPT 2 Regional Roadway Connections Expanded Travel Options 5
6 CONCEPT 1: Regional Roadway Connections Upgrading a strategic set of radial corridors with a focus on improving roadway LOS for autos and freight Maximizing delay reduction for autos and freight along key radial corridors Targeting multimodal investment within employment and activity centers 6
7 CONCEPT 1: Regional Roadway Connections 7
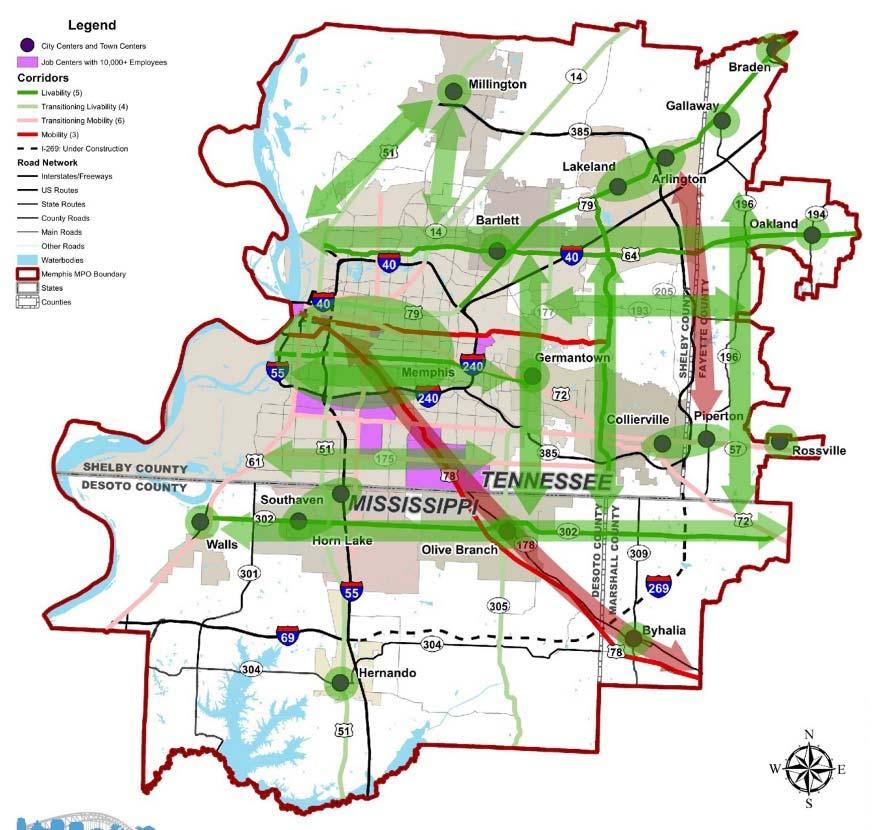
8 CONCEPT 2: Expanded Travel Options Modifying facility design along key northsouth connections to maximize multimodal LOS Providing more connections within the system to disperse traffic along an expanded grid Continuing investment approach to support a regional grid system 8


9 CONCEPT 2: Expanded Travel Options 9

10 FAST Act Goals 10
11 CONCEPT TWO was the preferred scenario and adopted by both the ETC & TPB during the Livability 2040 process. CONCEPT 1 CONCEPT 2 Regional Roadway Connections Expanded Travel Options 11


12 TIP Projects 12

13 13
14 What is the progress so far? Supportive of Concept 2 o Regional Freight Plan o MATA Transit Vision Plan o IMPROVE Act Funding for State and Local Projects o Total FY TIP Bike/Ped Projects: 22% TN funds (up from 9% in TIP) 11% MS funds (up from 1% in TIP) 14
15 Online Survey 337 Online Surveys 30 Paper Surveys 735 Map Markers 3,738 Unique Data Points 15
16 300 Guiding Principles Number of Times Ranked Average Ranking Total Times Ranked Average Ranking Safety & Security Connections & Choices System Preservation Guiding Principle Sustainable Growth Economic Vitality 0 16
17 Does this still reflect our preferred approach? CONCEPT 1 CONCEPT 2 Regional Roadway Connections Expanded Travel Options 17
18 Funding Availability 18
19 Tennessee Funding Safety (HSIP) National Highway Performance Program (NHPP) Surface Transportation Block Grant - State (STBG-S) Surface Transportation Block Grant - MPO Allocation (STBG) FTA Funding - MATA Air Quality (CMAQ) Bicycle and Pedestrian (TA) 19
20 IMPROVE Act Gas and diesel fuel tax increase No expiration for the tax increase ramps up over 3 years until reaching full amount Anticipated to fund more than 960 roadway and bridge projects across the state County and municipal funding breakouts Transit funding opportunities Not indexed to account for inflation in the future 20
21 IMPROVE Act Projects Portion allocated specifically to certain projects/corridors o Lamar Ave. (US 78) o I-240 o I-40 o Austin Peay Hwy. (SR 14) o Thomas St. (US 51) o Elvis Presley Blvd. (US 51) o Mebane Rd. Bridge o Raleigh-La Grange Rd. Bridge o Multiple Bridge Repairs 21
22 IMPROVE Act estimated revenues MPO municipalities - $19.5 million Counties (all of Shelby/portion of Fayette) $3.5 million State-level projects - $515 million 22
23 Mississippi Funding Debt Service (combined funding sources) Maintenance (combined funding sources) Local Allocation (STBG) Bicycle and Pedestrian (TA) 23
24 Funding Summary Over Life of Plan Total Funding $13 Billion Tennessee $9.7 Billion Mississippi $3.3 Billion 24
25 Project Review 25
26 Project Review Process Livability 2050 RTP as update to 2040 RTP o Review of current plan projects Member Agency Coordination Comparison of Revenues to Expenditures 26

27 Member Agency Meetings Conducted Agency Meetings o July 9 July 20 Confirmed 2040 RTP Plan Projects o Plan projects to remain o Plan projects to remove 2050 RTP Plan Projects Current operations and maintenance costs 27
28 Comparison of Revenue and Expenditures Base costs inflated 3.4% / year o Construction Cost Index from ENR (June 2018) Total Aggregate Expenditures are expected to exceed Total Aggregate Revenues Not all identified projects can be funded within 2050 Horizon of Plan 28
29 Prioritization Process Ground Rules 29
30 Prioritization Scales Interregional Regional Centers Town Centers Neighborhood Communities Undeveloped 30
31 Prioritization Scales Interregional Investments aligned with bigticket capital or maintenance needs to ensure the region is well connected within the state and the nation to maintain regional economic competitiveness. Investments support interstate mobility, intermodal connections, and freight/logistics hubs. 31
32 Prioritization Scales Regional Centers Investments support strategic connections between regional activity and economic centers through improved mobility and travel time reliability on corridor connections to key centers and last-mile connectivity to ensure effective access to a regional system. 32
33 Prioritization Scales Town Centers Investments support economically viable and thriving community centers; specifically, redevelopment opportunities, multimodal connections and access to a mix of business, retail and residential uses. 33
34 Prioritization Scales Neighborhood Communities Investments support healthy, thriving communities through improved system operations and multimodal access to community resources within primarily residential areas. 34
35 Prioritization Scales Undeveloped Investment strategies that protect and preserve undeveloped or environmentally sensitive areas. 35
36 Prioritization Process Step 1. Assign project to investment context type Step 2. Evaluate performance impacts of projects Step 3. Rank projects 36
37 Livability 2040 Prioritization Criteria Provides countermeasures on corridor of safety concern Addresses security/emergency response needs Reduces VMT Requires minimal ROW Aligns with community priorities 37
38 Livability 2040 Prioritization Criteria Supports community or corridor redevelopment Reduces truck hours of delay Fills in gaps or expands multimodal network Enhances transit ridership Reduces VHT 38
39 Guiding Principles Promote an efficient, interconnected, and accessible transportation network that provides various options for the movement of people. Promote economic development through targeted transportation investments to enhance travel and tourism and ensure the region remains a leader in global logistics and freight movement. Connect land use and transportation decisionmaking that protects the environment and conserves energy. Emphasize the preservation and performance of the existing transportation system through maintenance, rehabilitation, and system management and operations. Increase the safety and security of the transportation system for all users. 39
40 Next Steps ETC and TPB Adopt Funding Scenario Consolidate Draft Recommendations Create Draft Prioritization RTPAC Meeting #4 40