AAPA. Port Operations/Safety and Information Technology Seminar
|
|
|
- Amie Shaw
- 5 years ago
- Views:
Transcription
1 AAPA Port Operations/Safety and Information Technology Seminar 4/24/-27, 2007 Jacksonville, FL Innovation in Port Efficiency: Processes, Simulations and Modeling for better Terminal Operations, Planning & Congestion Mitigation Udo Mehlberg Port of Tacoma
2 Terminal Operations and Capacity Simulations
3 Port of Tacoma 2006

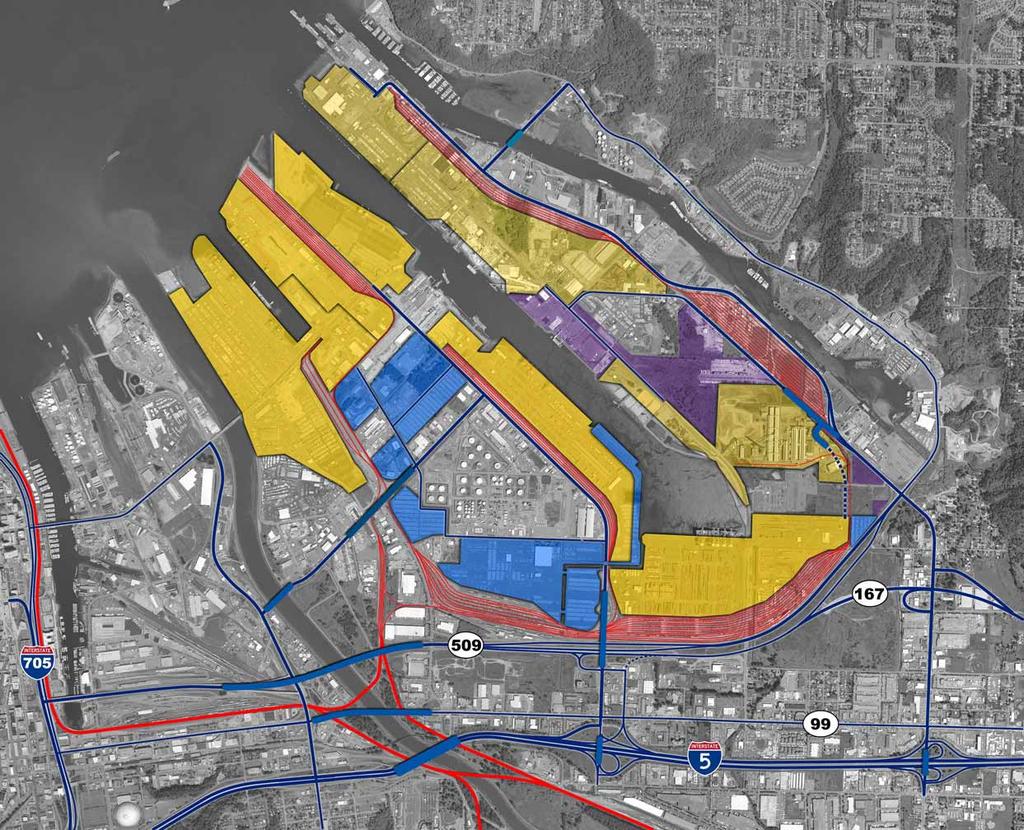
4 Port of Tacoma 2015
5 Simulation Projects 1994 First simulation project Intermodal Yard NIM & SIM throughput Capacity Port Intermodal Infrastructure Planning Used consultant for project 2004 Acquired simulation software from ISL (ISL = Institute of Shipping Economics and Logistics) SCUSY Simulation of Container Unit Handling systems CAPS Capacity Planning System 2005 Joint development with ISL IYCAPS Intermodal Yard Capacity Planning System
6

7 Yard Space Utilization

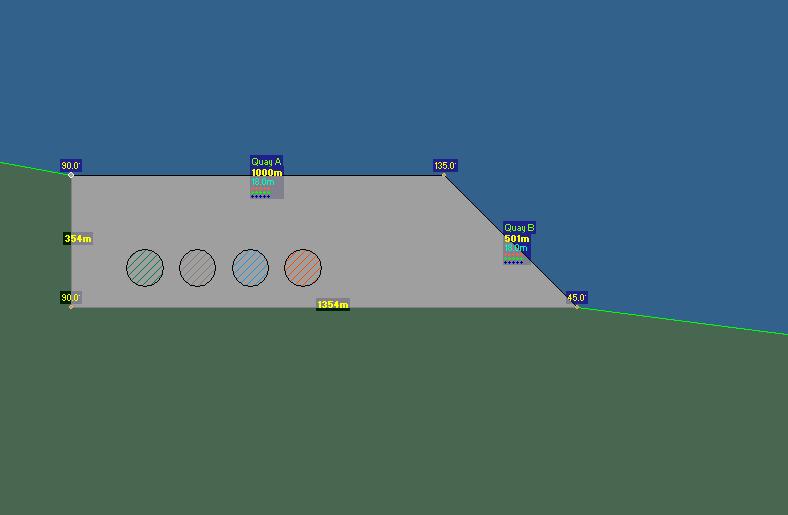
8 Berthing Times Crane Requirements Utilization
9

10 Intermodal Yard Capacity Planning System IYCAPS
11 IYCAPS Problem: Given a demand forecast and a conceptual IY layout, what are the efficiencies and bottlenecks for the proposed facility?
12 No Programming is required in order to run a Simulation and achieve Results
13 IYCAPS Data Requirements REU Types Train Types Processes Tracks Track Connections Productivity Options Measurement (meter/feet) Input Distributions annual, monthly, daily, hourly throughput, train types
14 Train Length - Determination Unknown types of cars per Train Three types of cars with varying length of each car Train length determined by adding up car length on per train basis at time of load planning While number of TEUs per train may be constant, train length varies greatly
15 Number of Configurations by Car Type Type of Car Flat Car P Spine Car Q Stack Car S Number of Cars 11,841 13,189 50,940 Number of Types handled in Number of Car Configurations
16 Train Length - Determination Create new unit which allows train length determination based on the number of TEU shipped: R E U Rail Equivalent Unit
17 Train Length - Determination Establish total number of cars by type Establish total length of cars by type Establish total number of wells by type Establish average number of wells per car by type Establish average length of well per car by type Establish number of TEU per well by type of car Name this unit REU
18 Train Length - Determination Determine distribution of car types arriving/departing from intermodal yard Apply number of TEU shipped per train and let the system determine the train length
19 REU Determination Type of Car * No Cars % of Total Total length Feet Avg. Car Length Total No of REU Avg. No REU/ Car Avg. REU length No TEU per REU Total No of TEU P 11, ,052, , ,464 Q 17, ,298, , ,232 S 51, ,079, , , ,256 Total 79, ,430, , ,952 *Car Type Data and No of Cars from UMLER file of 2/1/2007

20 Stack Cars single well on one platform Single platform = 1 REU Average REU length = 64.7 Ft Average TEU per REU = 4

21 Spine Car Spine Car Platform = 1 REU Average REU length = 58.7 Ft Average TEU per REU = 2

22 Flat Car Types Flatcar from 2 to 4 TEU = 1 REU Average REU Length = 47 Ft Average TEU per REU = 2
23 IYCAPS Results Reporting Productivity Analysis Equipment type and number Shifts Safety rules for adjacent working tracks
24 IYCAPS Results Reporting Throughput Evaluation of container moves per train type Train Schedule List of all train arrivals with among others arrival and departure time, train length and container movements. Using the multiple runs function the last train schedule is listed Train schedule Parameters Shows the seasonal arrival distribution and weekly peak times
25 IYCAPS Results Reporting Train type evaluation Overview of the time stamps a train passes through during its stay in the intermodal yard Track evaluation Overview of the throughput, utilization and performance of operations regarding tracks Track utilization Graphic evaluation of the track utilization over a one year period
26 Time Stamps of a Train s Stay in the Intermodal Yard
27 Track Utilization over a one Year Period 110 Utilisation [%] Track1 Track2 Track3 Track4 Track5 Track6 Track7 Track Jan 01.Feb 01.Mar 01.Apr 01.May 01.Jun 01.Jul Day 01.Aug 01.Sep 01.Oct 01.Nov 01.Dec
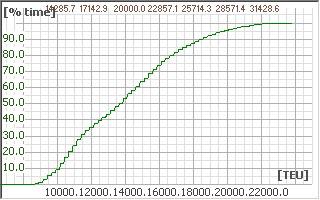
28 IYCAPS Results Reporting Simultaneous utilization of tracks Track allocation regarding their proportional availability for the trains Connection Point evaluation Information about bottlenecks in regards to track allocation Train Dwell/Delay Graphic evaluation of the length of stay for each train type
29 Simultaneously used Tacks Share of time [%] Simultaneous used tracks [#]
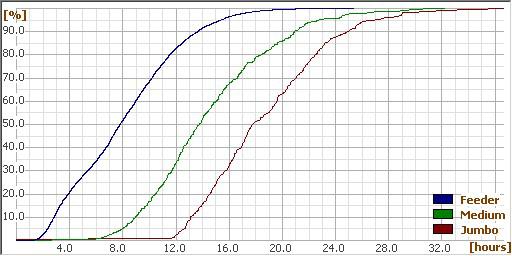
30 mixed in 90% avg [h] Hours Hours Trains [#] [%] Average Hours in IY
31 IYCAPS Results Reporting Productivity Analysis Equipment type and number Shifts Safety rules for adjacent working tracks IYCAPS is an evaluation tool. It will not give you the answer if you have no clue what you are doing.
32 For further information about IYCAPS please contact: Phone: 0049 / 471 / Fax: 0049 / 471 /
33 Thank You May I answer any questions?