TRAFFIC SAFETY EVALUATION. Using the Highway Safety Manual and the Interactive Highway Safety Design Model. I 15 Dry Lakes Design Exception
|
|
|
- Nickolas Ford
- 5 years ago
- Views:
Transcription

1 TRAFFIC SAFETY EVALUATION Using the Highway Safety Manual and the Interactive Highway Safety Design Model I 15 Dry Lakes Design Exception Prepared for: Nevada Department of Transportation Safety Engineering Prepared by: Kimley Horn and Associates, Inc. March 2014
2 TABLE OF CONTENTS SAFETY EVALUATION Analysis Overview Predictive Crash Analysis Benefit-Cost Ratio Economic Analysis Results Considerations Conclusions... 5 LIST OF TABLES Table 1. Base Conditions for the Intersection Analysis... 3 Table 2. Expected Crash Totals Table 3. Annual Benefits, Annual Costs and B/C Ratio... 4 LIST OF FIGURES Figure 1. Vicinity Map and Blow Up of Interchange... 2 Figure 2. Aerial View of the Interchange... 2 LIST OF APPENDICES APPENDIX A IHSDM Predictive Method Results per Alternative APPENDIX B Request for Design Exception and Design Figures APPENDIX C Benefit Cost Analysis I 15 Dry Lakes Design Exception Safety Evaluation March 2014
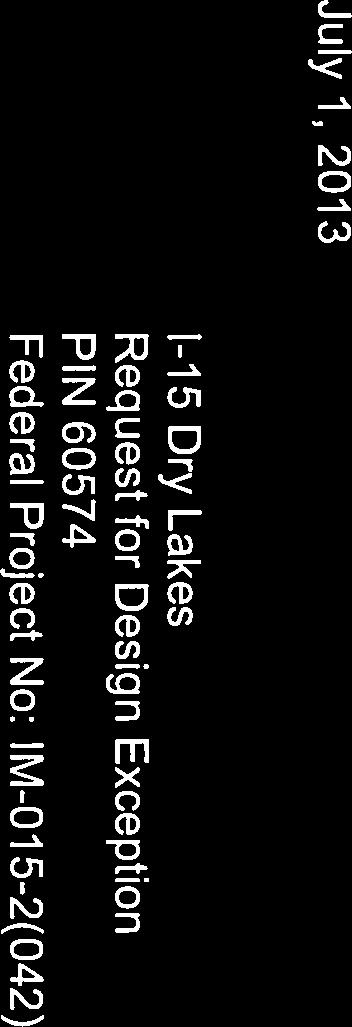
3 I-15 Dry Lakes Design Exception - Safety Evaluation SAFETY EVALUATION 1.1 Analysis Overview A safety analysis has been performed on the rural interchange of Interstate (I) 15 and State Route (SR) 169 near Logandale in Clark County. The Nevada Department of Transportation (NDOT) is proposing a truck climbing lane that will go through the Logandale/Overton interchange. The pier spacing supporting the existing structure for the interchange is too narrow to accommodate the additional lane and standard shoulders. The design speed for the area is 70 mph and this section of roadway has a 2011 AADT of 18,000 vpd. Although crash data does not indicate this area is problematic, the truck lane itself will provide a safety benefit by improving the operations of the interstate and allowing better passing opportunities for vehicles travelling at high speed differentials. Improvements are only happening on the north side of I-15. For the purposes of this evaluation three different alternatives were analyzed; Alternative1 - New Bridge, Alternative 2 - Median Narrowing and Alternative 3 - Shoulder Narrowing. These Alternatives have been analyzed for crashes separately and compared to existing conditions and a Benefit-Cost (B/C) analysis was performed. The proposed alternatives consist of measures to meet the 10 foot shoulder requirement except for Alternative 3, the design exception. Geometry is considered in this analysis and no reflective taping or shoulder narrowing signs are accounted for. The three alternatives are stated below: Alternative 1 Replace the existing bridge with a new bridge and piers outside the clear zone. Alternative 2 Narrow the median and shift the lanes more to the inside. This will cause the need for a 2000 foot long retaining wall to be constructed and barrier to be added to the inside of the NB lanes in the median. Alternative 3 Narrow the right shoulder to 2 feet for a distance of 30 feet with a taper length of 176 feet narrowing from the existing 10 feet. Using the American Association of State & Highway Transportation Officials Highway Safety Manual (HSM) Predictive Method, expected crash totals were estimated using the Interactive Highway Safety Design Model (IHSDM) to evaluate safety improvement for the freeway alternatives. The effect on traffic safety was analyzed to determine the safety benefit of constructing a new bridge, median narrowing or shoulder narrowing. To accommodate the proposed truck climbing lane. Figure 1 and Figure 2 are vicinity maps and an aerial of the study area. I 15 Dry Lakes Design Exception Safety Evaluation March


4 Figure 1. Vicinity Map and Blow Up of Interchange Figure 2. Aerial View of the Interchange I 15 Dry Lakes Design Exception Safety Evaluation March
5 1.2 Predictive Crash Analysis Using the IHSDM to complete the HSM Predictive Method, the safety improvements of the alternative was quantified and compared to the existing condition of the interchange for the 20-year evaluation period. The Safety Performance Function for a Rural Four Lane Freeway base condition requires the following data for predictive analysis: Complete horizontal alignment and tangent potion of the vertical alignment General; annual average daily traffic, area type and functional classification Cross-section; through lane width, auxiliary lanes, shoulders, median and ramps Roadside; clear zone Other; median barrier, outside barrier, shoulder rumble strip, high volume sections and type B weaving sections Table 1 is the summary of the geometric variations of the three alternatives and the existing condition. All other data is assumed to remain constant. The geometric variations are shown in the table. Left Shoulder Width Right Shoulder Width Existing Conditions Analysis Variables Alt. 1 Alt. 2 Alt. 3 Median Shoulder New Bridge Narrowing Narrowing 4' 4' 4' 4' 8' 10' 10' Table 1. Base Conditions for the Segment Analysis 2' for 30 feet and 176' taper Median Traversable Traversable Non- Traversable Traversable Median Width 28' 28' 20' 28' Median Barrier SB Only SB Only NB and SB SB Only Outside Barrier Rt 16' Rt N/A 10'Rt 2' (Follows Shoulder) 12' Climbing Lane No Yes Yes Yes I 15 Dry Lakes Design Exception Safety Evaluation March


6 I-15 is considered a freeway facility for the analysis. HSM Freeway Segment chapters were used to predict crashes over a 20 year horizon period. No observed crashes were used in the analysis. Complete results from the IHSDM Predictive Method can be found in Appendix A. The crashes prediction results from the analysis found in Table 2. Table 2. Expected Crash Totals Benefit-Cost Ratio Economic Analysis The following B/C Ratios found in Table 3 were calculated using the HSM severity distribution for crashes, as shown in Table 10-3 of the HSM. Construction costs were estimated by NDOT and are found in the letter to Federal Highway Administration in Appendix B. Complete results from the B/C analysis can be found in Appendix C. Table 3. Annual Benefits, Annual Costs and B/C Ratio I 15 Dry Lakes Design Exception Safety Evaluation March
7 1.4 Results Since the section of roadway for Alternative 3 is so short, the impact over the section of analysis is reduced. The cost of implementing the new barrier and shoulder are estimated at $100K. At this rate the shoulder improvement is considered to be a cost effective design solution and has a safety B/C Ratio of Median narrowing in Alternative 2 will reduce crashes by an insignificant amount and has a poor B/C Ratio of 0.03 which is not a cost effective safety improvement and does not meet the general minimum B/C Ratio of 1.0. The safest alternative is to build a new bridge with no impact to the clear zone, but the B/C Ratio is 0.13 is not cost effective due to the high cost of the bridge. See Appendix B for a break out of project cost and preliminary design. 1.5 Considerations Other considerations not contained in the HSM Predictive Method or B/C Ratio analysis should be taken into account by decision makers in order to proceed with design and construction of this alternative such as operational improvements, environmental constraints and funding. 1.6 Conclusions The predictive method and B/C Ratios are effective tools to evaluate the future effects of roadway improvements with respect to safety for the I-15 interchange near Logandale. Implementing a new barrier and shoulder would be a cost effective safety improvement for the addition of a truck climbing lane. The safest alternative is to build a new bridge but this would not be a cost effective safety improvement. NDOT should use results contained within this report, other monetary/non-monetary considerations, and project funding/budget to determine how to proceed and improve the intersection. I 15 Dry Lakes Design Exception Safety Evaluation March
8 APPENDIX A IHSDM Predictive Method Results per Alternative I-15 Dry Lakes Design Exception Safety Evaluation March 2014
9 Interactive Highway Safety Design Model Crash Prediction Evaluation Report February 3, 2014
10 Disclaimer The Interactive Highway Design Model (IHSDM) software is disseminated under the sponsorship of the Department of Transportation in the interest of information exchange. The United States Government assumes no liability for its content or use thereof. This document does not constitute a standard, specification, or regulation. The United States Government does not endorse products or manufacturers. Trade and manufacturers' names may appear in this software and documentation only because they are considered essential to the objective of the software. Limited Warranty and Limitations of Remedies This software product is provided "as-is," without warranty of any kind-either expressed or implied (but not limited to the implied warranties of merchantability and fitness for a particular purpose). The FHWA do not warrant that the functions contained in the software will meet the end-user's requirements or that the operation of the software will be uninterrupted and error-free. Under no circumstances will the FHWA be liable to the end-user for any damages or claimed lost profits, lost savings, or other incidental or consequential damages rising out of the use or inability to use the software (even if these organizations have been advised of the possibility of such damages), or for any claim by any other party. Notice The use of the IHSDM software is being done strictly on a voluntary basis. In exchange for provision of IHSDM, the user agrees that the Federal Highway Administration (FHWA), U.S. Department of Transportation and any other agency of the Federal Government shall not be responsible for any errors, damage or other liability that may result from any and all use of the software, including installation and testing of the software. The user further agrees to hold the FHWA and the Federal Government harmless from any resulting liability. The user agrees that this hold harmless provision shall flow to any person to whom or any entity to which the user provides the IHSDM software. It is the user's full responsibility to inform any person to whom or any entity to which it provides the IHSDM software of this hold harmless provision.
11 Crash Prediction Evaluation Report List of Figures Table of Contents Report Overview Section 1 Evaluation List of Tables Table Evaluation Freeway - Homogeneous Segments (Section 1) Table Expected Freeway Crash Rates and Frequencies (Section 1) Table Expected Freeway Speed Change Crash Rates and Frequencies (Section 1) Table Expected Crash Frequencies and Rates by Freeway Segment (Section 1) Table Expected Crash Frequencies and Rates by Horizontal Design Element (Section 1) Table Expected Crash Type Distribution (Section 1) List of Figures Figure Crash Prediction Summary (Section 1) Interactive Highway Safety Design Model iii
12 List of Figures Crash Prediction Evaluation Report iv Interactive Highway Safety Design Model
13 Crash Prediction Evaluation Report Section 1 Evaluation Report Overview Report Generated: Feb 3, :05 PM Report Template: System: Multi-Page [System] (mlcpm2, Oct 15, :19 AM) Evaluation Date: Fri Oct 18 07:42:27 PDT 2013 IHSDM Version: v9.0.0 (Sep 30, 2013) Crash Prediction Module: v4.0.0 (Sep 30, 2013) User Name: michael.mosley Organization Name: Phone: Project Title: I-15 Dry Lake Project Comment: Created Wed Oct 16 19:19:08 PDT 2013 Project Unit System: U.S. Customary Highway Title: I-15 at Logandale TI Highway Comment: Created Fri Oct 18 06:43:16 PDT 2013 Highway Version: 3 Evaluation Title: Existing Condition Evaluation Comment: Created Fri Oct 18 07:41:39 PDT 2013 Minimum Station: Maximum Station: Policy for Superelevation: AASHTO 2011 U.S. Customary Calibration: HSM Configuration Crash Distribution: HSM Configuration Model/CMF: HSM Configuration Empirical-Bayes Analysis: None First Year of Analysis: 2013 Last Year of Analysis: 2033 Interactive Highway Safety Design Model 1
14 Section 1 Evaluation Crash Prediction Evaluation Report Section 1 Evaluation Section: Section 1 Evaluation Start Location: Evaluation End Location: Functional Class: Freeway Type of Alignment: Divided, Multilane Model Category: Freeway Segment Calibration Factor: FI_MV=1.0; FI_SV=1.0; PDO_MV=1.0; PDO_SV=1.0; Figure 1. Crash Prediction Summary (Section 1) 2 Interactive Highway Safety Design Model
15 Crash Prediction Evaluation Report Section 1 Evaluation Table 1. Evaluation Freeway - Homogeneous Segments (Section 1) Seg. No. Type Area Type Start Location End Location Length (ft) Length( mi) AADT Median Width (ft) Type Effective Median Width (ft) 1 4F Rural , : 18, Traversable Median Table 2. Expected Freeway Crash Rates and Frequencies (Section 1) First Year of Analysis 2013 Last Year of Analysis 2033 Evaluated Length (mi) Average Future Road AADT (vpd) 18,000 Expected Total Fatal and Injury Property-Damage-Only Percent of Total Expected Percent Fatal and Injury (%) 35 Percent Property-Damage-Only (%) 65 Expected Crash Rate Crash Rate (crashes/mi/yr) Fatal and Injury Crash Rate (crashes/mi/yr) Property-Damage-Only Crash Rate (crashes/mi/yr) Expected Travel Crash Rate Total Travel (million veh-mi) Travel Crash Rate (crashes/million veh-mi) 0.49 Travel Fatal and Injury Crash Rate (crashes/million veh-mi) 0.17 Travel Property-Damage-Only Crash Rate (crashes/million veh-mi) 0.32 Interactive Highway Safety Design Model 3
16 Section 1 Evaluation Crash Prediction Evaluation Report Table 3. Expected Freeway Speed Change Crash Rates and Frequencies (Section 1) First Year of Analysis 2013 Last Year of Analysis 2033 Evaluated Length (mi) Average Future Road AADT (vpd) Total Fatal and Injury Property-Damage-Only Percent of Total Expected Percent Property- Percent Fatal and Injury (%) Damage-Only (%) Expected Crash Rate Crash Rate (crashes/mi/yr) Fatal and Injury Crash Rate (crashes/mi/yr) Property-Damage-Only Crash Rate (crashes/mi/yr) Total Travel (million veh-mi) 0.00 Travel Crash Rate (crashes/million veh-mi) Travel Property- Travel Fatal and Injury Crash Rate (crashes/million veh-mi) Damage-Only Crash Rate (crashes/million veh-mi) Table 4. Expected Crash Frequencies and Rates by Freeway Segment (Section 1) Start Location End Location Length (mi) Expected No. for Evaluation Period Crash Rate (crashes/mi/yr) Travel Crash Rate (crashes/million veh-mi) Table 5. Expected Crash Frequencies and Rates by Horizontal Design Element (Section 1) Title Start Location End Location Length (mi) Expected No. for Evaluation Period Crash Rate (crashes/mi/y r) Travel Crash Rate (crashes/milli on veh-mi) Tangent Curve Interactive Highway Safety Design Model
17 Crash Prediction Evaluation Report Section 1 Evaluation Table 6. Expected Crash Type Distribution (Section 1) Element Type Crash Type Fatal and Injury Property Damage Only Total (%) (%) (%) Highway Segment Collision with Animal Highway Segment Collision with Fixed Object Highway Segment Collision with Other Object Highway Segment Other Single-vehicle Collision Highway Segment Collision with Parked Vehicle Highway Segment Single Vehicle Highway Segment Right-Angle Collision Highway Segment Head-on Collision Highway Segment Other Multi-vehicle Collision Highway Segment Rear-end Collision Highway Segment Sideswipe, Same Direction Collision Highway Segment Multiple Vehicle Highway Segment Total Highway Segment Total Note:Fatal and Injury and Property Damage Only do not necessarily sum up to Total because the distribution of these three crashes had been derived independently. Interactive Highway Safety Design Model 5
18 Interactive Highway Safety Design Model Crash Prediction Evaluation Report February 3, 2014
19 Disclaimer The Interactive Highway Design Model (IHSDM) software is disseminated under the sponsorship of the Department of Transportation in the interest of information exchange. The United States Government assumes no liability for its content or use thereof. This document does not constitute a standard, specification, or regulation. The United States Government does not endorse products or manufacturers. Trade and manufacturers' names may appear in this software and documentation only because they are considered essential to the objective of the software. Limited Warranty and Limitations of Remedies This software product is provided "as-is," without warranty of any kind-either expressed or implied (but not limited to the implied warranties of merchantability and fitness for a particular purpose). The FHWA do not warrant that the functions contained in the software will meet the end-user's requirements or that the operation of the software will be uninterrupted and error-free. Under no circumstances will the FHWA be liable to the end-user for any damages or claimed lost profits, lost savings, or other incidental or consequential damages rising out of the use or inability to use the software (even if these organizations have been advised of the possibility of such damages), or for any claim by any other party. Notice The use of the IHSDM software is being done strictly on a voluntary basis. In exchange for provision of IHSDM, the user agrees that the Federal Highway Administration (FHWA), U.S. Department of Transportation and any other agency of the Federal Government shall not be responsible for any errors, damage or other liability that may result from any and all use of the software, including installation and testing of the software. The user further agrees to hold the FHWA and the Federal Government harmless from any resulting liability. The user agrees that this hold harmless provision shall flow to any person to whom or any entity to which the user provides the IHSDM software. It is the user's full responsibility to inform any person to whom or any entity to which it provides the IHSDM software of this hold harmless provision.
20 Crash Prediction Evaluation Report List of Figures Table of Contents Report Overview Section 1 Evaluation List of Tables Table Evaluation Freeway - Homogeneous Segments (Section 1) Table Expected Freeway Crash Rates and Frequencies (Section 1) Table Expected Freeway Speed Change Crash Rates and Frequencies (Section 1) Table Expected Crash Frequencies and Rates by Freeway Segment (Section 1) Table Expected Crash Frequencies and Rates by Horizontal Design Element (Section 1) Table Expected Crash Type Distribution (Section 1) List of Figures Figure Crash Prediction Summary (Section 1) Interactive Highway Safety Design Model iii
21 List of Figures Crash Prediction Evaluation Report iv Interactive Highway Safety Design Model
22 Crash Prediction Evaluation Report Section 1 Evaluation Report Overview Report Generated: Feb 3, :07 PM Report Template: System: Multi-Page [System] (mlcpm2, Oct 15, :19 AM) Evaluation Date: Fri Oct 18 14:26:28 PDT 2013 IHSDM Version: v9.0.0 (Sep 30, 2013) Crash Prediction Module: v4.0.0 (Sep 30, 2013) User Name: michael.mosley Organization Name: Phone: Project Title: I-15 Dry Lake Project Comment: Created Wed Oct 16 19:19:08 PDT 2013 Project Unit System: U.S. Customary Highway Title: I-15 at Logandale TI Highway Comment: Created Fri Oct 18 06:43:16 PDT 2013 Highway Version: 3 Evaluation Title: Apples Median Narrowing Evaluation Comment: Created Fri Oct 18 14:25:49 PDT 2013 Minimum Station: Maximum Station: Policy for Superelevation: AASHTO 2011 U.S. Customary Calibration: HSM Configuration Crash Distribution: HSM Configuration Model/CMF: HSM Configuration Empirical-Bayes Analysis: None First Year of Analysis: 2013 Last Year of Analysis: 2033 Interactive Highway Safety Design Model 1
23 Section 1 Evaluation Crash Prediction Evaluation Report Section 1 Evaluation Section: Section 1 Evaluation Start Location: Evaluation End Location: Functional Class: Freeway Type of Alignment: Divided, Multilane Model Category: Freeway Segment Calibration Factor: FI_MV=1.0; FI_SV=1.0; PDO_MV=1.0; PDO_SV=1.0; Figure 1. Crash Prediction Summary (Section 1) 2 Interactive Highway Safety Design Model
24 Crash Prediction Evaluation Report Section 1 Evaluation Table 1. Evaluation Freeway - Homogeneous Segments (Section 1) Seg. No. Type Area Type Start Location End Location Length (ft) Length( mi) AADT Median Width (ft) Type Effective Median Width (ft) 1 4F Rural , : 18, Traversable Median Table 2. Expected Freeway Crash Rates and Frequencies (Section 1) First Year of Analysis 2013 Last Year of Analysis 2033 Evaluated Length (mi) Average Future Road AADT (vpd) 18,000 Expected Total Fatal and Injury Property-Damage-Only Percent of Total Expected Percent Fatal and Injury (%) 35 Percent Property-Damage-Only (%) 65 Expected Crash Rate Crash Rate (crashes/mi/yr) Fatal and Injury Crash Rate (crashes/mi/yr) Property-Damage-Only Crash Rate (crashes/mi/yr) Expected Travel Crash Rate Total Travel (million veh-mi) Travel Crash Rate (crashes/million veh-mi) 0.57 Travel Fatal and Injury Crash Rate (crashes/million veh-mi) 0.20 Travel Property-Damage-Only Crash Rate (crashes/million veh-mi) 0.37 Interactive Highway Safety Design Model 3
25 Section 1 Evaluation Crash Prediction Evaluation Report Table 3. Expected Freeway Speed Change Crash Rates and Frequencies (Section 1) First Year of Analysis 2013 Last Year of Analysis 2033 Evaluated Length (mi) Average Future Road AADT (vpd) Total Fatal and Injury Property-Damage-Only Percent of Total Expected Percent Property- Percent Fatal and Injury (%) Damage-Only (%) Expected Crash Rate Crash Rate (crashes/mi/yr) Fatal and Injury Crash Rate (crashes/mi/yr) Property-Damage-Only Crash Rate (crashes/mi/yr) Total Travel (million veh-mi) 0.00 Travel Crash Rate (crashes/million veh-mi) Travel Property- Travel Fatal and Injury Crash Rate (crashes/million veh-mi) Damage-Only Crash Rate (crashes/million veh-mi) Table 4. Expected Crash Frequencies and Rates by Freeway Segment (Section 1) Start Location End Location Length (mi) Expected No. for Evaluation Period Crash Rate (crashes/mi/yr) Travel Crash Rate (crashes/million veh-mi) Table 5. Expected Crash Frequencies and Rates by Horizontal Design Element (Section 1) Title Start Location End Location Length (mi) Expected No. for Evaluation Period Crash Rate (crashes/mi/y r) Travel Crash Rate (crashes/milli on veh-mi) Tangent Curve Interactive Highway Safety Design Model
26 Crash Prediction Evaluation Report Section 1 Evaluation Table 6. Expected Crash Type Distribution (Section 1) Element Type Crash Type Fatal and Injury Property Damage Only Total (%) (%) (%) Highway Segment Collision with Animal Highway Segment Collision with Fixed Object Highway Segment Collision with Other Object Highway Segment Other Single-vehicle Collision Highway Segment Collision with Parked Vehicle Highway Segment Single Vehicle Highway Segment Right-Angle Collision Highway Segment Head-on Collision Highway Segment Other Multi-vehicle Collision Highway Segment Rear-end Collision Highway Segment Sideswipe, Same Direction Collision Highway Segment Multiple Vehicle Highway Segment Total Highway Segment Total Note:Fatal and Injury and Property Damage Only do not necessarily sum up to Total because the distribution of these three crashes had been derived independently. Interactive Highway Safety Design Model 5
27 Interactive Highway Safety Design Model Crash Prediction Evaluation Report February 3, 2014
28 Disclaimer The Interactive Highway Design Model (IHSDM) software is disseminated under the sponsorship of the Department of Transportation in the interest of information exchange. The United States Government assumes no liability for its content or use thereof. This document does not constitute a standard, specification, or regulation. The United States Government does not endorse products or manufacturers. Trade and manufacturers' names may appear in this software and documentation only because they are considered essential to the objective of the software. Limited Warranty and Limitations of Remedies This software product is provided "as-is," without warranty of any kind-either expressed or implied (but not limited to the implied warranties of merchantability and fitness for a particular purpose). The FHWA do not warrant that the functions contained in the software will meet the end-user's requirements or that the operation of the software will be uninterrupted and error-free. Under no circumstances will the FHWA be liable to the end-user for any damages or claimed lost profits, lost savings, or other incidental or consequential damages rising out of the use or inability to use the software (even if these organizations have been advised of the possibility of such damages), or for any claim by any other party. Notice The use of the IHSDM software is being done strictly on a voluntary basis. In exchange for provision of IHSDM, the user agrees that the Federal Highway Administration (FHWA), U.S. Department of Transportation and any other agency of the Federal Government shall not be responsible for any errors, damage or other liability that may result from any and all use of the software, including installation and testing of the software. The user further agrees to hold the FHWA and the Federal Government harmless from any resulting liability. The user agrees that this hold harmless provision shall flow to any person to whom or any entity to which the user provides the IHSDM software. It is the user's full responsibility to inform any person to whom or any entity to which it provides the IHSDM software of this hold harmless provision.
29 Crash Prediction Evaluation Report List of Figures Table of Contents Report Overview Section 1 Evaluation List of Tables Table Evaluation Freeway - Homogeneous Segments (Section 1) Table Expected Freeway Crash Rates and Frequencies (Section 1) Table Expected Freeway Speed Change Crash Rates and Frequencies (Section 1) Table Expected Crash Frequencies and Rates by Freeway Segment (Section 1) Table Expected Crash Frequencies and Rates by Horizontal Design Element (Section 1) Table Expected Crash Type Distribution (Section 1) List of Figures Figure Crash Prediction Summary (Section 1) Interactive Highway Safety Design Model iii
30 List of Figures Crash Prediction Evaluation Report iv Interactive Highway Safety Design Model
31 Crash Prediction Evaluation Report Section 1 Evaluation Report Overview Report Generated: Feb 3, :06 PM Report Template: System: Multi-Page [System] (mlcpm2, Oct 15, :19 AM) Evaluation Date: Fri Oct 18 14:00:32 PDT 2013 IHSDM Version: v9.0.0 (Sep 30, 2013) Crash Prediction Module: v4.0.0 (Sep 30, 2013) User Name: michael.mosley Organization Name: Phone: Project Title: I-15 Dry Lake Project Comment: Created Wed Oct 16 19:19:08 PDT 2013 Project Unit System: U.S. Customary Highway Title: I-15 at Logandale TI Highway Comment: Created Fri Oct 18 06:43:16 PDT 2013 Highway Version: 3 Evaluation Title: Apples Narrow Shoulder Evaluation Comment: Created Fri Oct 18 13:59:34 PDT 2013 Minimum Station: Maximum Station: Policy for Superelevation: AASHTO 2011 U.S. Customary Calibration: HSM Configuration Crash Distribution: HSM Configuration Model/CMF: HSM Configuration Empirical-Bayes Analysis: None First Year of Analysis: 2013 Last Year of Analysis: 2033 Interactive Highway Safety Design Model 1
32 Section 1 Evaluation Crash Prediction Evaluation Report Section 1 Evaluation Section: Section 1 Evaluation Start Location: Evaluation End Location: Functional Class: Freeway Type of Alignment: Divided, Multilane Model Category: Freeway Segment Calibration Factor: FI_MV=1.0; FI_SV=1.0; PDO_MV=1.0; PDO_SV=1.0; Figure 1. Crash Prediction Summary (Section 1) 2 Interactive Highway Safety Design Model
33 Crash Prediction Evaluation Report Section 1 Evaluation Table 1. Evaluation Freeway - Homogeneous Segments (Section 1) Seg. No. Type Area Type Start Location End Location Length (ft) Length( mi) AADT Median Width (ft) Type Effective Median Width (ft) 1 4F Rural : 18, Traversable Median Table 2. Expected Freeway Crash Rates and Frequencies (Section 1) First Year of Analysis 2013 Last Year of Analysis 2033 Evaluated Length (mi) Average Future Road AADT (vpd) 18,000 Expected Total 4.01 Fatal and Injury 1.40 Property-Damage-Only 2.61 Percent of Total Expected Percent Fatal and Injury (%) 35 Percent Property-Damage-Only (%) 65 Expected Crash Rate Crash Rate (crashes/mi/yr) Fatal and Injury Crash Rate (crashes/mi/yr) Property-Damage-Only Crash Rate (crashes/mi/yr) Expected Travel Crash Rate Total Travel (million veh-mi) 6.69 Travel Crash Rate (crashes/million veh-mi) 0.60 Travel Fatal and Injury Crash Rate (crashes/million veh-mi) 0.21 Travel Property-Damage-Only Crash Rate (crashes/million veh-mi) 0.39 Interactive Highway Safety Design Model 3
34 Section 1 Evaluation Crash Prediction Evaluation Report Table 3. Expected Freeway Speed Change Crash Rates and Frequencies (Section 1) First Year of Analysis 2013 Last Year of Analysis 2033 Evaluated Length (mi) Average Future Road AADT (vpd) Total Fatal and Injury Property-Damage-Only Percent of Total Expected Percent Property- Percent Fatal and Injury (%) Damage-Only (%) Expected Crash Rate Crash Rate (crashes/mi/yr) Fatal and Injury Crash Rate (crashes/mi/yr) Property-Damage-Only Crash Rate (crashes/mi/yr) Total Travel (million veh-mi) 0.00 Travel Crash Rate (crashes/million veh-mi) Travel Property- Travel Fatal and Injury Crash Rate (crashes/million veh-mi) Damage-Only Crash Rate (crashes/million veh-mi) Table 4. Expected Crash Frequencies and Rates by Freeway Segment (Section 1) Start Location End Location Length (mi) Expected No. for Evaluation Period Crash Rate (crashes/mi/yr) Travel Crash Rate (crashes/million veh-mi) Table 5. Expected Crash Frequencies and Rates by Horizontal Design Element (Section 1) Title Start Location End Location Length (mi) Expected No. for Evaluation Period Crash Rate (crashes/mi/y r) Travel Crash Rate (crashes/milli on veh-mi) Curve Interactive Highway Safety Design Model
35 Crash Prediction Evaluation Report Section 1 Evaluation Table 6. Expected Crash Type Distribution (Section 1) Element Type Crash Type Fatal and Injury Property Damage Only Total (%) (%) (%) Highway Segment Collision with Animal Highway Segment Collision with Fixed Object Highway Segment Collision with Other Object Highway Segment Other Single-vehicle Collision Highway Segment Collision with Parked Vehicle Highway Segment Single Vehicle Highway Segment Right-Angle Collision Highway Segment Head-on Collision Highway Segment Other Multi-vehicle Collision Highway Segment Rear-end Collision Highway Segment Sideswipe, Same Direction Collision Highway Segment Multiple Vehicle Highway Segment Total Highway Segment Total Note:Fatal and Injury and Property Damage Only do not necessarily sum up to Total because the distribution of these three crashes had been derived independently. Interactive Highway Safety Design Model 5
36 Interactive Highway Safety Design Model Crash Prediction Evaluation Report February 3, 2014
37 Disclaimer The Interactive Highway Design Model (IHSDM) software is disseminated under the sponsorship of the Department of Transportation in the interest of information exchange. The United States Government assumes no liability for its content or use thereof. This document does not constitute a standard, specification, or regulation. The United States Government does not endorse products or manufacturers. Trade and manufacturers' names may appear in this software and documentation only because they are considered essential to the objective of the software. Limited Warranty and Limitations of Remedies This software product is provided "as-is," without warranty of any kind-either expressed or implied (but not limited to the implied warranties of merchantability and fitness for a particular purpose). The FHWA do not warrant that the functions contained in the software will meet the end-user's requirements or that the operation of the software will be uninterrupted and error-free. Under no circumstances will the FHWA be liable to the end-user for any damages or claimed lost profits, lost savings, or other incidental or consequential damages rising out of the use or inability to use the software (even if these organizations have been advised of the possibility of such damages), or for any claim by any other party. Notice The use of the IHSDM software is being done strictly on a voluntary basis. In exchange for provision of IHSDM, the user agrees that the Federal Highway Administration (FHWA), U.S. Department of Transportation and any other agency of the Federal Government shall not be responsible for any errors, damage or other liability that may result from any and all use of the software, including installation and testing of the software. The user further agrees to hold the FHWA and the Federal Government harmless from any resulting liability. The user agrees that this hold harmless provision shall flow to any person to whom or any entity to which the user provides the IHSDM software. It is the user's full responsibility to inform any person to whom or any entity to which it provides the IHSDM software of this hold harmless provision.
38 Crash Prediction Evaluation Report List of Figures Table of Contents Report Overview Section 1 Evaluation List of Tables Table Evaluation Freeway - Homogeneous Segments (Section 1) Table Expected Freeway Crash Rates and Frequencies (Section 1) Table Expected Freeway Speed Change Crash Rates and Frequencies (Section 1) Table Expected Crash Frequencies and Rates by Freeway Segment (Section 1) Table Expected Crash Frequencies and Rates by Horizontal Design Element (Section 1) Table Expected Crash Type Distribution (Section 1) List of Figures Figure Crash Prediction Summary (Section 1) Interactive Highway Safety Design Model iii
39 List of Figures Crash Prediction Evaluation Report iv Interactive Highway Safety Design Model
40 Crash Prediction Evaluation Report Section 1 Evaluation Report Overview Report Generated: Feb 3, :10 PM Report Template: System: Multi-Page [System] (mlcpm2, Oct 15, :19 AM) Evaluation Date: Fri Oct 18 14:23:24 PDT 2013 IHSDM Version: v9.0.0 (Sep 30, 2013) Crash Prediction Module: v4.0.0 (Sep 30, 2013) User Name: michael.mosley Organization Name: Phone: Project Title: I-15 Dry Lake Project Comment: Created Wed Oct 16 19:19:08 PDT 2013 Project Unit System: U.S. Customary Highway Title: I-15 at Logandale TI New Bridge w Climb L Highway Comment: Copied from I-15 at Logandale TI (v3) Highway Version: 2 Evaluation Title: Apples Median Narrowing Evaluation Comment: Created Fri Oct 18 14:22:47 PDT 2013 Minimum Station: Maximum Station: Policy for Superelevation: AASHTO 2011 U.S. Customary Calibration: HSM Configuration Crash Distribution: HSM Configuration Model/CMF: HSM Configuration Empirical-Bayes Analysis: None First Year of Analysis: 2013 Last Year of Analysis: 2033 Interactive Highway Safety Design Model 1
41 Section 1 Evaluation Crash Prediction Evaluation Report Section 1 Evaluation Section: Section 1 Evaluation Start Location: Evaluation End Location: Functional Class: Freeway Type of Alignment: Divided, Multilane Model Category: Freeway Segment Calibration Factor: FI_MV=1.0; FI_SV=1.0; PDO_MV=1.0; PDO_SV=1.0; Figure 1. Crash Prediction Summary (Section 1) 2 Interactive Highway Safety Design Model
42 Crash Prediction Evaluation Report Section 1 Evaluation Table 1. Evaluation Freeway - Homogeneous Segments (Section 1) Seg. No. Type Area Type Start Location End Location Length (ft) Length( mi) AADT Median Width (ft) Type Effective Median Width (ft) 1 4F Rural , : 18, Traversable Median Table 2. Expected Freeway Crash Rates and Frequencies (Section 1) First Year of Analysis 2013 Last Year of Analysis 2033 Evaluated Length (mi) Average Future Road AADT (vpd) 18,000 Expected Total Fatal and Injury 9.56 Property-Damage-Only Percent of Total Expected Percent Fatal and Injury (%) 35 Percent Property-Damage-Only (%) 65 Expected Crash Rate Crash Rate (crashes/mi/yr) Fatal and Injury Crash Rate (crashes/mi/yr) Property-Damage-Only Crash Rate (crashes/mi/yr) Expected Travel Crash Rate Total Travel (million veh-mi) Travel Crash Rate (crashes/million veh-mi) 0.53 Travel Fatal and Injury Crash Rate (crashes/million veh-mi) 0.18 Travel Property-Damage-Only Crash Rate (crashes/million veh-mi) 0.34 Interactive Highway Safety Design Model 3
43 Section 1 Evaluation Crash Prediction Evaluation Report Table 3. Expected Freeway Speed Change Crash Rates and Frequencies (Section 1) First Year of Analysis 2013 Last Year of Analysis 2033 Evaluated Length (mi) Average Future Road AADT (vpd) Total Fatal and Injury Property-Damage-Only Percent of Total Expected Percent Property- Percent Fatal and Injury (%) Damage-Only (%) Expected Crash Rate Crash Rate (crashes/mi/yr) Fatal and Injury Crash Rate (crashes/mi/yr) Property-Damage-Only Crash Rate (crashes/mi/yr) Total Travel (million veh-mi) 0.00 Travel Crash Rate (crashes/million veh-mi) Travel Property- Travel Fatal and Injury Crash Rate (crashes/million veh-mi) Damage-Only Crash Rate (crashes/million veh-mi) Table 4. Expected Crash Frequencies and Rates by Freeway Segment (Section 1) Start Location End Location Length (mi) Expected No. for Evaluation Period Crash Rate (crashes/mi/yr) Travel Crash Rate (crashes/million veh-mi) Table 5. Expected Crash Frequencies and Rates by Horizontal Design Element (Section 1) Title Start Location End Location Length (mi) Expected No. for Evaluation Period Crash Rate (crashes/mi/y r) Travel Crash Rate (crashes/milli on veh-mi) Tangent Curve Interactive Highway Safety Design Model
44 Crash Prediction Evaluation Report Section 1 Evaluation Table 6. Expected Crash Type Distribution (Section 1) Element Type Crash Type Fatal and Injury Property Damage Only Total (%) (%) (%) Highway Segment Collision with Animal Highway Segment Collision with Fixed Object Highway Segment Collision with Other Object Highway Segment Other Single-vehicle Collision Highway Segment Collision with Parked Vehicle Highway Segment Single Vehicle Highway Segment Right-Angle Collision Highway Segment Head-on Collision Highway Segment Other Multi-vehicle Collision Highway Segment Rear-end Collision Highway Segment Sideswipe, Same Direction Collision Highway Segment Multiple Vehicle Highway Segment Total Highway Segment Total Note:Fatal and Injury and Property Damage Only do not necessarily sum up to Total because the distribution of these three crashes had been derived independently. Interactive Highway Safety Design Model 5
45 Interactive Highway Safety Design Model Crash Prediction Evaluation Report February 3, 2014
46 Disclaimer The Interactive Highway Design Model (IHSDM) software is disseminated under the sponsorship of the Department of Transportation in the interest of information exchange. The United States Government assumes no liability for its content or use thereof. This document does not constitute a standard, specification, or regulation. The United States Government does not endorse products or manufacturers. Trade and manufacturers' names may appear in this software and documentation only because they are considered essential to the objective of the software. Limited Warranty and Limitations of Remedies This software product is provided "as-is," without warranty of any kind-either expressed or implied (but not limited to the implied warranties of merchantability and fitness for a particular purpose). The FHWA do not warrant that the functions contained in the software will meet the end-user's requirements or that the operation of the software will be uninterrupted and error-free. Under no circumstances will the FHWA be liable to the end-user for any damages or claimed lost profits, lost savings, or other incidental or consequential damages rising out of the use or inability to use the software (even if these organizations have been advised of the possibility of such damages), or for any claim by any other party. Notice The use of the IHSDM software is being done strictly on a voluntary basis. In exchange for provision of IHSDM, the user agrees that the Federal Highway Administration (FHWA), U.S. Department of Transportation and any other agency of the Federal Government shall not be responsible for any errors, damage or other liability that may result from any and all use of the software, including installation and testing of the software. The user further agrees to hold the FHWA and the Federal Government harmless from any resulting liability. The user agrees that this hold harmless provision shall flow to any person to whom or any entity to which the user provides the IHSDM software. It is the user's full responsibility to inform any person to whom or any entity to which it provides the IHSDM software of this hold harmless provision.
47 Crash Prediction Evaluation Report List of Figures Table of Contents Report Overview Section 1 Evaluation List of Tables Table Evaluation Freeway - Homogeneous Segments (Section 1) Table Expected Freeway Crash Rates and Frequencies (Section 1) Table Expected Freeway Speed Change Crash Rates and Frequencies (Section 1) Table Expected Crash Frequencies and Rates by Freeway Segment (Section 1) Table Expected Crash Frequencies and Rates by Horizontal Design Element (Section 1) Table Expected Crash Type Distribution (Section 1) List of Figures Figure Crash Prediction Summary (Section 1) Interactive Highway Safety Design Model iii
48 List of Figures Crash Prediction Evaluation Report iv Interactive Highway Safety Design Model
49 Crash Prediction Evaluation Report Section 1 Evaluation Report Overview Report Generated: Feb 3, :09 PM Report Template: System: Multi-Page [System] (mlcpm2, Oct 15, :19 AM) Evaluation Date: Fri Oct 18 09:55:42 PDT 2013 IHSDM Version: v9.0.0 (Sep 30, 2013) Crash Prediction Module: v4.0.0 (Sep 30, 2013) User Name: michael.mosley Organization Name: Phone: Project Title: I-15 Dry Lake Project Comment: Created Wed Oct 16 19:19:08 PDT 2013 Project Unit System: U.S. Customary Highway Title: I-15 at Logandale TI New Bridge w Climb L Highway Comment: Copied from I-15 at Logandale TI (v3) Highway Version: 2 Evaluation Title: Evaluation 5 Evaluation Comment: Created Fri Oct 18 09:55:13 PDT 2013 Minimum Station: Maximum Station: Policy for Superelevation: AASHTO 2011 U.S. Customary Calibration: HSM Configuration Crash Distribution: HSM Configuration Model/CMF: HSM Configuration Empirical-Bayes Analysis: None First Year of Analysis: 2013 Last Year of Analysis: 2033 Interactive Highway Safety Design Model 1
50 Section 1 Evaluation Crash Prediction Evaluation Report Section 1 Evaluation Section: Section 1 Evaluation Start Location: Evaluation End Location: Functional Class: Freeway Type of Alignment: Divided, Multilane Model Category: Freeway Segment Calibration Factor: FI_MV=1.0; FI_SV=1.0; PDO_MV=1.0; PDO_SV=1.0; Figure 1. Crash Prediction Summary (Section 1) 2 Interactive Highway Safety Design Model
51 Crash Prediction Evaluation Report Section 1 Evaluation Table 1. Evaluation Freeway - Homogeneous Segments (Section 1) Seg. No. Type Area Type Start Location End Location Length (ft) Length( mi) AADT Median Width (ft) Type Effective Median Width (ft) 1 4F Rural , : 18, Traversable Median Table 2. Expected Freeway Crash Rates and Frequencies (Section 1) First Year of Analysis 2013 Last Year of Analysis 2033 Evaluated Length (mi) Average Future Road AADT (vpd) 18,000 Expected Total Fatal and Injury Property-Damage-Only Percent of Total Expected Percent Fatal and Injury (%) 35 Percent Property-Damage-Only (%) 65 Expected Crash Rate Crash Rate (crashes/mi/yr) Fatal and Injury Crash Rate (crashes/mi/yr) Property-Damage-Only Crash Rate (crashes/mi/yr) Expected Travel Crash Rate Total Travel (million veh-mi) Travel Crash Rate (crashes/million veh-mi) 0.47 Travel Fatal and Injury Crash Rate (crashes/million veh-mi) 0.16 Travel Property-Damage-Only Crash Rate (crashes/million veh-mi) 0.31 Interactive Highway Safety Design Model 3
52 Section 1 Evaluation Crash Prediction Evaluation Report Table 3. Expected Freeway Speed Change Crash Rates and Frequencies (Section 1) First Year of Analysis 2013 Last Year of Analysis 2033 Evaluated Length (mi) Average Future Road AADT (vpd) Total Fatal and Injury Property-Damage-Only Percent of Total Expected Percent Property- Percent Fatal and Injury (%) Damage-Only (%) Expected Crash Rate Crash Rate (crashes/mi/yr) Fatal and Injury Crash Rate (crashes/mi/yr) Property-Damage-Only Crash Rate (crashes/mi/yr) Total Travel (million veh-mi) 0.00 Travel Crash Rate (crashes/million veh-mi) Travel Property- Travel Fatal and Injury Crash Rate (crashes/million veh-mi) Damage-Only Crash Rate (crashes/million veh-mi) Table 4. Expected Crash Frequencies and Rates by Freeway Segment (Section 1) Start Location End Location Length (mi) Expected No. for Evaluation Period Crash Rate (crashes/mi/yr) Travel Crash Rate (crashes/million veh-mi) Table 5. Expected Crash Frequencies and Rates by Horizontal Design Element (Section 1) Title Start Location End Location Length (mi) Expected No. for Evaluation Period Crash Rate (crashes/mi/y r) Travel Crash Rate (crashes/milli on veh-mi) Tangent Curve Interactive Highway Safety Design Model
53 Crash Prediction Evaluation Report Section 1 Evaluation Table 6. Expected Crash Type Distribution (Section 1) Element Type Crash Type Fatal and Injury Property Damage Only Total (%) (%) (%) Highway Segment Collision with Animal Highway Segment Collision with Fixed Object Highway Segment Collision with Other Object Highway Segment Other Single-vehicle Collision Highway Segment Collision with Parked Vehicle Highway Segment Single Vehicle Highway Segment Right-Angle Collision Highway Segment Head-on Collision Highway Segment Other Multi-vehicle Collision Highway Segment Rear-end Collision Highway Segment Sideswipe, Same Direction Collision Highway Segment Multiple Vehicle Highway Segment Total Highway Segment Total Note:Fatal and Injury and Property Damage Only do not necessarily sum up to Total because the distribution of these three crashes had been derived independently. Interactive Highway Safety Design Model 5
54 Interactive Highway Safety Design Model Crash Prediction Evaluation Report February 3, 2014
55 Disclaimer The Interactive Highway Design Model (IHSDM) software is disseminated under the sponsorship of the Department of Transportation in the interest of information exchange. The United States Government assumes no liability for its content or use thereof. This document does not constitute a standard, specification, or regulation. The United States Government does not endorse products or manufacturers. Trade and manufacturers' names may appear in this software and documentation only because they are considered essential to the objective of the software. Limited Warranty and Limitations of Remedies This software product is provided "as-is," without warranty of any kind-either expressed or implied (but not limited to the implied warranties of merchantability and fitness for a particular purpose). The FHWA do not warrant that the functions contained in the software will meet the end-user's requirements or that the operation of the software will be uninterrupted and error-free. Under no circumstances will the FHWA be liable to the end-user for any damages or claimed lost profits, lost savings, or other incidental or consequential damages rising out of the use or inability to use the software (even if these organizations have been advised of the possibility of such damages), or for any claim by any other party. Notice The use of the IHSDM software is being done strictly on a voluntary basis. In exchange for provision of IHSDM, the user agrees that the Federal Highway Administration (FHWA), U.S. Department of Transportation and any other agency of the Federal Government shall not be responsible for any errors, damage or other liability that may result from any and all use of the software, including installation and testing of the software. The user further agrees to hold the FHWA and the Federal Government harmless from any resulting liability. The user agrees that this hold harmless provision shall flow to any person to whom or any entity to which the user provides the IHSDM software. It is the user's full responsibility to inform any person to whom or any entity to which it provides the IHSDM software of this hold harmless provision.
56 Crash Prediction Evaluation Report List of Figures Table of Contents Report Overview Section 1 Evaluation List of Tables Table Evaluation Freeway - Homogeneous Segments (Section 1) Table Expected Freeway Crash Rates and Frequencies (Section 1) Table Expected Freeway Speed Change Crash Rates and Frequencies (Section 1) Table Expected Crash Frequencies and Rates by Freeway Segment (Section 1) Table Expected Crash Frequencies and Rates by Horizontal Design Element (Section 1) Table Expected Crash Type Distribution (Section 1) List of Figures Figure Crash Prediction Summary (Section 1) Interactive Highway Safety Design Model iii
57 List of Figures Crash Prediction Evaluation Report iv Interactive Highway Safety Design Model
58 Crash Prediction Evaluation Report Section 1 Evaluation Report Overview Report Generated: Feb 3, :05 PM Report Template: System: Multi-Page [System] (mlcpm2, Oct 15, :19 AM) Evaluation Date: Fri Oct 18 14:36:15 PDT 2013 IHSDM Version: v9.0.0 (Sep 30, 2013) Crash Prediction Module: v4.0.0 (Sep 30, 2013) User Name: michael.mosley Organization Name: Phone: Project Title: I-15 Dry Lake Project Comment: Created Wed Oct 16 19:19:08 PDT 2013 Project Unit System: U.S. Customary Highway Title: I-15 at Logandale TI Narrow Median w Climb L Highway Comment: Copied from I-15 at Logandale TI New Bridge w Climb L (v1) Highway Version: 1 Evaluation Title: Apples Median Narrowing Evaluation Comment: Created Fri Oct 18 14:35:43 PDT 2013 Minimum Station: Maximum Station: Policy for Superelevation: AASHTO 2011 U.S. Customary Calibration: HSM Configuration Crash Distribution: HSM Configuration Model/CMF: HSM Configuration Empirical-Bayes Analysis: None First Year of Analysis: 2013 Last Year of Analysis: 2033 Interactive Highway Safety Design Model 1
59 Section 1 Evaluation Crash Prediction Evaluation Report Section 1 Evaluation Section: Section 1 Evaluation Start Location: Evaluation End Location: Functional Class: Freeway Type of Alignment: Divided, Multilane Model Category: Freeway Segment Calibration Factor: FI_MV=1.0; FI_SV=1.0; PDO_MV=1.0; PDO_SV=1.0; Figure 1. Crash Prediction Summary (Section 1) 2 Interactive Highway Safety Design Model
60 Crash Prediction Evaluation Report Section 1 Evaluation Table 1. Evaluation Freeway - Homogeneous Segments (Section 1) Seg. No. Type Area Type Start Location End Location Length (ft) Length(mi) AADT Median Width (ft) Type Effective Median Width (ft) 1 4F Rural : 18, Non-Traversable Median F Rural , : 18, Non-Traversable Median F Rural : 18, Non-Traversable Median Interactive Highway Safety Design Model 3
61 Section 1 Evaluation Crash Prediction Evaluation Report Table 2. Expected Freeway Crash Rates and Frequencies (Section 1) First Year of Analysis 2013 Last Year of Analysis 2033 Evaluated Length (mi) Average Future Road AADT (vpd) 18,000 Expected Total Fatal and Injury Property-Damage-Only Percent of Total Expected Percent Fatal and Injury (%) 33 Percent Property-Damage-Only (%) 67 Expected Crash Rate Crash Rate (crashes/mi/yr) Fatal and Injury Crash Rate (crashes/mi/yr) Property-Damage-Only Crash Rate (crashes/mi/yr) Expected Travel Crash Rate Total Travel (million veh-mi) Travel Crash Rate (crashes/million veh-mi) 0.60 Travel Fatal and Injury Crash Rate (crashes/million veh-mi) 0.20 Travel Property-Damage-Only Crash Rate (crashes/million veh-mi) Interactive Highway Safety Design Model
62 Crash Prediction Evaluation Report Section 1 Evaluation Table 3. Expected Freeway Speed Change Crash Rates and Frequencies (Section 1) First Year of Analysis 2013 Last Year of Analysis 2033 Evaluated Length (mi) Average Future Road AADT (vpd) Total Fatal and Injury Property-Damage-Only Percent of Total Expected Percent Fatal and Injury (%) Percent Property-Damage-Only (%) Expected Crash Rate Crash Rate (crashes/mi/yr) Fatal and Injury Crash Rate (crashes/mi/yr) Property-Damage-Only Crash Rate (crashes/mi/yr) Total Travel (million veh-mi) 0.00 Travel Crash Rate (crashes/million veh-mi) Travel Property-Damage-Only Travel Fatal and Injury Crash Rate (crashes/million veh-mi) Crash Rate (crashes/million vehmi) Interactive Highway Safety Design Model 5
63 Section 1 Evaluation Crash Prediction Evaluation Report Table 4. Expected Crash Frequencies and Rates by Freeway Segment (Section 1) Start Location End Location Length (mi) Expected No. for Evaluation Period Crash Rate (crashes/mi/yr) Travel Crash Rate (crashes/million veh-mi) Table 5. Expected Crash Frequencies and Rates by Horizontal Design Element (Section 1) Title Start Location End Location Length (mi) Expected No. for Evaluation Period Crash Rate (crashes/mi/y r) Travel Crash Rate (crashes/milli on veh-mi) Tangent Curve Table 6. Expected Crash Type Distribution (Section 1) Element Type Crash Type Fatal and Injury Property Damage Only Total (%) (%) (%) Highway Segment Collision with Animal Highway Segment Collision with Fixed Object Highway Segment Collision with Other Object Highway Segment Other Single-vehicle Collision Highway Segment Collision with Parked Vehicle Highway Segment Single Vehicle Highway Segment Right-Angle Collision Highway Segment Head-on Collision Highway Segment Other Multi-vehicle Collision Highway Segment Rear-end Collision Highway Segment Sideswipe, Same Direction Collision Highway Segment Multiple Vehicle Highway Segment Total Highway Segment Total Note:Fatal and Injury and Property Damage Only do not necessarily sum up to Total because the distribution of these three crashes had been derived independently. 6 Interactive Highway Safety Design Model
64 Interactive Highway Safety Design Model Crash Prediction Evaluation Report February 3, 2014
65 Disclaimer The Interactive Highway Design Model (IHSDM) software is disseminated under the sponsorship of the Department of Transportation in the interest of information exchange. The United States Government assumes no liability for its content or use thereof. This document does not constitute a standard, specification, or regulation. The United States Government does not endorse products or manufacturers. Trade and manufacturers' names may appear in this software and documentation only because they are considered essential to the objective of the software. Limited Warranty and Limitations of Remedies This software product is provided "as-is," without warranty of any kind-either expressed or implied (but not limited to the implied warranties of merchantability and fitness for a particular purpose). The FHWA do not warrant that the functions contained in the software will meet the end-user's requirements or that the operation of the software will be uninterrupted and error-free. Under no circumstances will the FHWA be liable to the end-user for any damages or claimed lost profits, lost savings, or other incidental or consequential damages rising out of the use or inability to use the software (even if these organizations have been advised of the possibility of such damages), or for any claim by any other party. Notice The use of the IHSDM software is being done strictly on a voluntary basis. In exchange for provision of IHSDM, the user agrees that the Federal Highway Administration (FHWA), U.S. Department of Transportation and any other agency of the Federal Government shall not be responsible for any errors, damage or other liability that may result from any and all use of the software, including installation and testing of the software. The user further agrees to hold the FHWA and the Federal Government harmless from any resulting liability. The user agrees that this hold harmless provision shall flow to any person to whom or any entity to which the user provides the IHSDM software. It is the user's full responsibility to inform any person to whom or any entity to which it provides the IHSDM software of this hold harmless provision.
66 Crash Prediction Evaluation Report List of Figures Table of Contents Report Overview Section 1 Evaluation List of Tables Table Evaluation Freeway - Homogeneous Segments (Section 1) Table Expected Freeway Crash Rates and Frequencies (Section 1) Table Expected Freeway Speed Change Crash Rates and Frequencies (Section 1) Table Expected Crash Frequencies and Rates by Freeway Segment (Section 1) Table Expected Crash Frequencies and Rates by Horizontal Design Element (Section 1) Table Expected Crash Type Distribution (Section 1) List of Figures Figure Crash Prediction Summary (Section 1) Interactive Highway Safety Design Model iii
67 List of Figures Crash Prediction Evaluation Report iv Interactive Highway Safety Design Model
68 Crash Prediction Evaluation Report Section 1 Evaluation Report Overview Report Generated: Feb 3, :06 PM Report Template: System: Multi-Page [System] (mlcpm2, Oct 15, :19 AM) Evaluation Date: Fri Oct 18 14:35:06 PDT 2013 IHSDM Version: v9.0.0 (Sep 30, 2013) Crash Prediction Module: v4.0.0 (Sep 30, 2013) User Name: michael.mosley Organization Name: Phone: Project Title: I-15 Dry Lake Project Comment: Created Wed Oct 16 19:19:08 PDT 2013 Project Unit System: U.S. Customary Highway Title: I-15 at Logandale TI Narrow Median w Climb L Highway Comment: Copied from I-15 at Logandale TI New Bridge w Climb L (v1) Highway Version: 1 Evaluation Title: Full Length Evaluation Comment: Created Fri Oct 18 14:34:43 PDT 2013 Minimum Station: Maximum Station: Policy for Superelevation: AASHTO 2011 U.S. Customary Calibration: HSM Configuration Crash Distribution: HSM Configuration Model/CMF: HSM Configuration Empirical-Bayes Analysis: None First Year of Analysis: 2013 Last Year of Analysis: 2033 Interactive Highway Safety Design Model 1
69 Section 1 Evaluation Crash Prediction Evaluation Report Section 1 Evaluation Section: Section 1 Evaluation Start Location: Evaluation End Location: Functional Class: Freeway Type of Alignment: Divided, Multilane Model Category: Freeway Segment Calibration Factor: FI_MV=1.0; FI_SV=1.0; PDO_MV=1.0; PDO_SV=1.0; Figure 1. Crash Prediction Summary (Section 1) 2 Interactive Highway Safety Design Model
70 Crash Prediction Evaluation Report Section 1 Evaluation Table 1. Evaluation Freeway - Homogeneous Segments (Section 1) Seg. No. Type Area Type Start Location End Location Length (ft) Length(mi) AADT Median Width (ft) Type Effective Median Width (ft) 1 4F Rural , : 18, Traversable Median F Rural , : 18, Non-Traversable Median F Rural , : 18, Non-Traversable Median Interactive Highway Safety Design Model 3
71 Section 1 Evaluation Crash Prediction Evaluation Report Table 2. Expected Freeway Crash Rates and Frequencies (Section 1) First Year of Analysis 2013 Last Year of Analysis 2033 Evaluated Length (mi) Average Future Road AADT (vpd) 18,000 Expected Total Fatal and Injury Property-Damage-Only Percent of Total Expected Percent Fatal and Injury (%) 34 Percent Property-Damage-Only (%) 66 Expected Crash Rate Crash Rate (crashes/mi/yr) Fatal and Injury Crash Rate (crashes/mi/yr) Property-Damage-Only Crash Rate (crashes/mi/yr) Expected Travel Crash Rate Total Travel (million veh-mi) Travel Crash Rate (crashes/million veh-mi) 0.49 Travel Fatal and Injury Crash Rate (crashes/million veh-mi) 0.17 Travel Property-Damage-Only Crash Rate (crashes/million veh-mi) Interactive Highway Safety Design Model
72 Crash Prediction Evaluation Report Section 1 Evaluation Table 3. Expected Freeway Speed Change Crash Rates and Frequencies (Section 1) First Year of Analysis 2013 Last Year of Analysis 2033 Evaluated Length (mi) Average Future Road AADT (vpd) Total Fatal and Injury Property-Damage-Only Percent of Total Expected Percent Fatal and Injury (%) Percent Property-Damage-Only (%) Expected Crash Rate Crash Rate (crashes/mi/yr) Fatal and Injury Crash Rate (crashes/mi/yr) Property-Damage-Only Crash Rate (crashes/mi/yr) Total Travel (million veh-mi) 0.00 Travel Crash Rate (crashes/million veh-mi) Travel Property-Damage-Only Travel Fatal and Injury Crash Rate (crashes/million veh-mi) Crash Rate (crashes/million vehmi) Interactive Highway Safety Design Model 5
73 Section 1 Evaluation Crash Prediction Evaluation Report Table 4. Expected Crash Frequencies and Rates by Freeway Segment (Section 1) Start Location End Location Length (mi) Expected No. for Evaluation Period Crash Rate (crashes/mi/yr) Travel Crash Rate (crashes/million veh-mi) Table 5. Expected Crash Frequencies and Rates by Horizontal Design Element (Section 1) Title Start Location End Location Length (mi) Expected No. for Evaluation Period Crash Rate (crashes/mi/y r) Travel Crash Rate (crashes/milli on veh-mi) Tangent Curve Table 6. Expected Crash Type Distribution (Section 1) Element Type Crash Type Fatal and Injury Property Damage Only Total (%) (%) (%) Highway Segment Collision with Animal Highway Segment Collision with Fixed Object Highway Segment Collision with Other Object Highway Segment Other Single-vehicle Collision Highway Segment Collision with Parked Vehicle Highway Segment Single Vehicle Highway Segment Right-Angle Collision Highway Segment Head-on Collision Highway Segment Other Multi-vehicle Collision Highway Segment Rear-end Collision Highway Segment Sideswipe, Same Direction Collision Highway Segment Multiple Vehicle Highway Segment Total Highway Segment Total Note:Fatal and Injury and Property Damage Only do not necessarily sum up to Total because the distribution of these three crashes had been derived independently. 6 Interactive Highway Safety Design Model
74 Interactive Highway Safety Design Model Crash Prediction Evaluation Report February 3, 2014
75 Disclaimer The Interactive Highway Design Model (IHSDM) software is disseminated under the sponsorship of the Department of Transportation in the interest of information exchange. The United States Government assumes no liability for its content or use thereof. This document does not constitute a standard, specification, or regulation. The United States Government does not endorse products or manufacturers. Trade and manufacturers' names may appear in this software and documentation only because they are considered essential to the objective of the software. Limited Warranty and Limitations of Remedies This software product is provided "as-is," without warranty of any kind-either expressed or implied (but not limited to the implied warranties of merchantability and fitness for a particular purpose). The FHWA do not warrant that the functions contained in the software will meet the end-user's requirements or that the operation of the software will be uninterrupted and error-free. Under no circumstances will the FHWA be liable to the end-user for any damages or claimed lost profits, lost savings, or other incidental or consequential damages rising out of the use or inability to use the software (even if these organizations have been advised of the possibility of such damages), or for any claim by any other party. Notice The use of the IHSDM software is being done strictly on a voluntary basis. In exchange for provision of IHSDM, the user agrees that the Federal Highway Administration (FHWA), U.S. Department of Transportation and any other agency of the Federal Government shall not be responsible for any errors, damage or other liability that may result from any and all use of the software, including installation and testing of the software. The user further agrees to hold the FHWA and the Federal Government harmless from any resulting liability. The user agrees that this hold harmless provision shall flow to any person to whom or any entity to which the user provides the IHSDM software. It is the user's full responsibility to inform any person to whom or any entity to which it provides the IHSDM software of this hold harmless provision.
76 Crash Prediction Evaluation Report List of Figures Table of Contents Report Overview Section 1 Evaluation List of Tables Table Evaluation Freeway - Homogeneous Segments (Section 1) Table Expected Freeway Crash Rates and Frequencies (Section 1) Table Expected Freeway Speed Change Crash Rates and Frequencies (Section 1) Table Expected Crash Frequencies and Rates by Freeway Segment (Section 1) Table Expected Crash Frequencies and Rates by Horizontal Design Element (Section 1) Table Expected Crash Type Distribution (Section 1) List of Figures Figure Crash Prediction Summary (Section 1) Interactive Highway Safety Design Model iii
77 List of Figures Crash Prediction Evaluation Report iv Interactive Highway Safety Design Model
78 Crash Prediction Evaluation Report Section 1 Evaluation Report Overview Report Generated: Feb 3, :04 PM Report Template: System: Multi-Page [System] (mlcpm2, Oct 15, :19 AM) Evaluation Date: Fri Oct 18 10:17:51 PDT 2013 IHSDM Version: v9.0.0 (Sep 30, 2013) Crash Prediction Module: v4.0.0 (Sep 30, 2013) User Name: michael.mosley Organization Name: Phone: Project Title: I-15 Dry Lake Project Comment: Created Wed Oct 16 19:19:08 PDT 2013 Project Unit System: U.S. Customary Highway Title: I-15 at Logandale TI Narrow Shoulder and Climb L Highway Comment: Copied from I-15 at Logandale TI New Bridge w Climb L (v1) Highway Version: 1 Evaluation Title: Evaluation 4 Evaluation Comment: Created Fri Oct 18 10:17:27 PDT 2013 Minimum Station: Maximum Station: Policy for Superelevation: AASHTO 2011 U.S. Customary Calibration: HSM Configuration Crash Distribution: HSM Configuration Model/CMF: HSM Configuration Empirical-Bayes Analysis: None First Year of Analysis: 2013 Last Year of Analysis: 2033 Interactive Highway Safety Design Model 1
79 Section 1 Evaluation Crash Prediction Evaluation Report Section 1 Evaluation Section: Section 1 Evaluation Start Location: Evaluation End Location: Functional Class: Freeway Type of Alignment: Divided, Multilane Model Category: Freeway Segment Calibration Factor: FI_MV=1.0; FI_SV=1.0; PDO_MV=1.0; PDO_SV=1.0; Figure 1. Crash Prediction Summary (Section 1) 2 Interactive Highway Safety Design Model
80 Crash Prediction Evaluation Report Section 1 Evaluation Table 1. Evaluation Freeway - Homogeneous Segments (Section 1) Seg. No. Type Area Type Start Location End Location Length (ft) Length( mi) AADT Median Width (ft) Type Effective Median Width (ft) 1 4F Rural , : 18, Traversable Median F Rural : 18, Traversable Median F Rural : 18, Traversable Median F Rural : 18, Traversable Median F Rural : 18, Traversable Median F Rural : 18, Traversable Median F Rural : 18, Traversable Median F Rural : 18, Traversable Median F Rural : 18, Traversable Median F Rural : 18, Traversable Median F Rural : 18, Traversable Median F Rural : 18, Traversable Median F Rural : 18, Traversable Median F Rural : 18, Traversable Median F Rural , : 18, Traversable Median Table 2. Expected Freeway Crash Rates and Frequencies (Section 1) First Year of Analysis 2013 Last Year of Analysis 2033 Evaluated Length (mi) Average Future Road AADT (vpd) 18,000 Expected Total Fatal and Injury Property-Damage-Only Percent of Total Expected Percent Fatal and Injury (%) 29 Percent Property-Damage-Only (%) 71 Expected Crash Rate Crash Rate (crashes/mi/yr) Fatal and Injury Crash Rate (crashes/mi/yr) Property-Damage-Only Crash Rate (crashes/mi/yr) Expected Travel Crash Rate Total Travel (million veh-mi) Travel Crash Rate (crashes/million veh-mi) 0.38 Travel Fatal and Injury Crash Rate (crashes/million veh-mi) 0.11 Travel Property-Damage-Only Crash Rate (crashes/million veh-mi) 0.27 Interactive Highway Safety Design Model 3
81 Section 1 Evaluation Crash Prediction Evaluation Report Table 3. Expected Freeway Speed Change Crash Rates and Frequencies (Section 1) First Year of Analysis 2013 Last Year of Analysis 2033 Evaluated Length (mi) Average Future Road AADT (vpd) Total Fatal and Injury Property-Damage-Only Percent of Total Expected Percent Property- Percent Fatal and Injury (%) Damage-Only (%) Expected Crash Rate Crash Rate (crashes/mi/yr) Fatal and Injury Crash Rate (crashes/mi/yr) Property-Damage-Only Crash Rate (crashes/mi/yr) Total Travel (million veh-mi) 0.00 Travel Crash Rate (crashes/million veh-mi) Travel Property- Travel Fatal and Injury Crash Rate (crashes/million veh-mi) Damage-Only Crash Rate (crashes/million veh-mi) 4 Interactive Highway Safety Design Model
82 Crash Prediction Evaluation Report Section 1 Evaluation Table 4. Expected Crash Frequencies and Rates by Freeway Segment (Section 1) Start Location End Location Length (mi) Expected No. for Evaluation Period Crash Rate (crashes/mi/yr) Travel Crash Rate (crashes/million veh-mi) Table 5. Expected Crash Frequencies and Rates by Horizontal Design Element (Section 1) Title Start Location End Location Length (mi) Expected No. for Evaluation Period Crash Rate (crashes/mi/y r) Travel Crash Rate (crashes/milli on veh-mi) Tangent Curve Interactive Highway Safety Design Model 5
83 Section 1 Evaluation Crash Prediction Evaluation Report Table 6. Expected Crash Type Distribution (Section 1) Element Type Crash Type Fatal and Injury Property Damage Only Total (%) (%) (%) Highway Segment Collision with Animal Highway Segment Collision with Fixed Object Highway Segment Collision with Other Object Highway Segment Other Single-vehicle Collision Highway Segment Collision with Parked Vehicle Highway Segment Single Vehicle Highway Segment Right-Angle Collision Highway Segment Head-on Collision Highway Segment Other Multi-vehicle Collision Highway Segment Rear-end Collision Highway Segment Sideswipe, Same Direction Collision Highway Segment Multiple Vehicle Highway Segment Total Highway Segment Total Note:Fatal and Injury and Property Damage Only do not necessarily sum up to Total because the distribution of these three crashes had been derived independently. 6 Interactive Highway Safety Design Model
84 APPENDIX B Request for Design Exception and Design Figures I-15 Dry Lakes Design Exception Safety Evaluation March 2014


85
86
87
88
89
90 APPENDIX C Benefit Cost Analysis I-15 Dry Lakes Design Exception Safety Evaluation March 2014
91 ENGINEERING AUTHORIZATION NO. PROJECT NO. PROJECT LOCATION ALTERNATIVE NO. COUNTERMEASURE Not Known COST EFFECTIVENESS ANALYSIS ACCIDENT REDUCTION BENEFITS (2012 DOLLAR FIGURES) 02/03/14 Not Known I-15 Dry Lakes at Logandale TI Alt 1 New Bridge AADT - Segment or Main St & Cross St ROADWAY CHARACTERISTICS DEMOGRAPHIC DESIGNATION FUNCTIONAL CLASSIFICATION 2 LANE UNDIVIDED RURAL IMPLEMENTATION COSTS $2,750, ANNUAL MAINTENENCE COSTS $10, CURRENT PRIME INTEREST RATE 3.25% PERCENTAGE OF GROWTH 2.00% ESTIMATED SERVICE LIFE & 3 OTHER PRINICPLE ARTERIAL NUMBER OF YEARS PREDICTED 20 YEAR(S) NUMBER OF YEARS OF CRASH HISTORY DATA 0 YEAR(S) CALCULATION OF REDUCTIONS USING IHSDM IHSDM (Interactive Highway Safety Design Model) EXSITING CONDITION ALTERNATIVE EXPECTED EXPECTED EXPECTED CRASHES SAVED CRASHES CRASHES CRASHES CRF (%) ANNUALLY 2012 CRASH (A) (B) (C) (D) (E) COSTS HSM DISTR. OF FATAL $5,339, % 0.00 INJURY A $285, % 0.01 INJURY B $104, % 0.02 INJURY C $59, % 0.03 PDO $9, % 0.15 CALCULATION OF BENEFITS CRASHES SAVED SOCIETAL SOCIETAL ANNUALLY COST BENEFIT (E) (F) (G) FATAL 0.00 $5,339,711 $15,827 INJURY A 0.01 $285,349 $3,513 INJURY B 0.02 $104,302 $2,592 INJURY C 0.03 $59,037 $1,952 PDO 0.15 $9,638 $1,492 TOTAL ANNUAL BENEFITS (Summation of Column E) $25,376 TOTAL ANNUAL BENEFITS (Including Growth ) $25,884 CAPITAL RECOVERY FACTOR ANNUALIZED IMPLEMENTATION COSTS $189,142 TOTAL ANNUALIZED COSTS $199,142 AVERAGE ANNUAL NET RETURN ($173,258) BENEFIT/COST 0.13
92 ENGINEERING AUTHORIZATION NO. PROJECT NO. PROJECT LOCATION ALTERNATIVE NO. COUNTERMEASURE Not Known COST EFFECTIVENESS ANALYSIS ACCIDENT REDUCTION BENEFITS (2012 DOLLAR FIGURES) 02/03/14 Not Known I-15 Dry Lakes at Logandale TI Alt 12 Narrow Median AADT - Segment or Main St & Cross St ROADWAY CHARACTERISTICS DEMOGRAPHIC DESIGNATION FUNCTIONAL CLASSIFICATION 2 LANE UNDIVIDED RURAL IMPLEMENTATION COSTS $1,500, ANNUAL MAINTENENCE COSTS $10, CURRENT PRIME INTEREST RATE 3.25% PERCENTAGE OF GROWTH 2.00% ESTIMATED SERVICE LIFE & 3 OTHER PRINICPLE ARTERIAL NUMBER OF YEARS PREDICTED 20 YEAR(S) NUMBER OF YEARS OF CRASH HISTORY DATA 0 YEAR(S) CALCULATION OF REDUCTIONS USING IHSDM IHSDM (Interactive Highway Safety Design Model) EXSITING CONDITION ALTERNATIVE EXPECTED EXPECTED EXPECTED CRASHES SAVED CRASHES CRASHES CRASHES CRF (%) ANNUALLY 2012 CRASH (A) (B) (C) (D) (E) COSTS HSM DISTR. OF FATAL $5,339, % 0.00 INJURY A $285, % 0.00 INJURY B $104, % 0.00 INJURY C $59, % 0.00 PDO $9, % 0.02 CALCULATION OF BENEFITS CRASHES SAVED SOCIETAL SOCIETAL ANNUALLY COST BENEFIT (E) (F) (G) FATAL 0.00 $5,339,711 $2,082 INJURY A 0.00 $285,349 $462 INJURY B 0.00 $104,302 $341 INJURY C 0.00 $59,037 $257 PDO 0.02 $9,638 $196 TOTAL ANNUAL BENEFITS (Summation of Column E) $3,339 TOTAL ANNUAL BENEFITS (Including Growth ) $3,406 CAPITAL RECOVERY FACTOR ANNUALIZED IMPLEMENTATION COSTS $103,168 TOTAL ANNUALIZED COSTS $113,168 AVERAGE ANNUAL NET RETURN ($109,763) BENEFIT/COST 0.03
 02/03/14 Not Known I-15 Dry Lakes at Logandale TI Alt 3 Narrow Shoulder at Pier AADT - Segment")

 http://www.ihsdm.")
93 ENGINEERING AUTHORIZATION NO. PROJECT NO. PROJECT LOCATION ALTERNATIVE NO. COUNTERMEASURE Not Known COST EFFECTIVENESS ANALYSIS ACCIDENT REDUCTION BENEFITS (2012 DOLLAR FIGURES) 02/03/14 Not Known I-15 Dry Lakes at Logandale TI Alt 3 Narrow Shoulder at Pier AADT - Segment or Main St & Cross St ROADWAY CHARACTERISTICS DEMOGRAPHIC DESIGNATION FUNCTIONAL CLASSIFICATION 2 LANE UNDIVIDED RURAL IMPLEMENTATION COSTS $100, ANNUAL MAINTENENCE COSTS $10, CURRENT PRIME INTEREST RATE 3.25% PERCENTAGE OF GROWTH 2.00% ESTIMATED SERVICE LIFE & 3 OTHER PRINICPLE ARTERIAL NUMBER OF YEARS PREDICTED 20 YEAR(S) NUMBER OF YEARS OF CRASH HISTORY DATA 0 YEAR(S) CALCULATION OF REDUCTIONS USING IHSDM IHSDM (Interactive Highway Safety Design Model) EXSITING CONDITION ALTERNATIVE EXPECTED EXPECTED EXPECTED CRASHES SAVED CRASHES CRASHES CRASHES CRF (%) ANNUALLY 2012 CRASH (A) (B) (C) (D) (E) COSTS HSM DISTR. OF FATAL $5,339, % 0.00 INJURY A $285, % 0.01 INJURY B $104, % 0.02 INJURY C $59, % 0.02 PDO $9, % 0.11 CALCULATION OF BENEFITS CRASHES SAVED SOCIETAL SOCIETAL ANNUALLY COST BENEFIT (E) (F) (G) FATAL 0.00 $5,339,711 $10,794 INJURY A 0.01 $285,349 $2,396 INJURY B 0.02 $104,302 $1,768 INJURY C 0.02 $59,037 $1,331 PDO 0.11 $9,638 $1,018 TOTAL ANNUAL BENEFITS (Summation of Column E) $17,307 TOTAL ANNUAL BENEFITS (Including Growth ) $17,653 CAPITAL RECOVERY FACTOR ANNUALIZED IMPLEMENTATION COSTS $6,878 TOTAL ANNUALIZED COSTS $16,878 AVERAGE ANNUAL NET RETURN $775 BENEFIT/COST 1.05