REGIONAL INTERMODAL RAIL TRANSIT SYSTEMS ENSURING OUR ECONOMIC AND TRANSPORTATION FUTURE
|
|
|
- Alvin Webb
- 5 years ago
- Views:
Transcription

1 REGIONAL INTERMODAL RAIL TRANSIT SYSTEMS ENSURING OUR ECONOMIC AND TRANSPORTATION FUTURE


2 REGIONAL TRANSIT SYSTEMS Comprehensive transit system serving the mobility needs of an entire region Transit modes include Light Rail, Commuter Rail, Modern Streetcar, Enhanced Bus, Bus Rapid Transit Intermodal Hub provides central connection between modes Transit system operated by a Regional Transit Authority created by participating local governments


3 INTERMODAL TRANSIT Seamless movement of passengers from one mode of transit to another through a central hub Transit modes include Light Rail, Commuter Rail, Modern Streetcar, Enhanced Bus and Bus Rapid Transit (BRT)
4 MULTIMODAL VS. INTERMODAL

5 INTERMODAL HUBS DENVER UNION STATION Central link for regional transit system Connect Commuter Rail, Light Rail, Modern Streetcar and bus systems Provide efficient passenger transfer between transit modes

6 LIGHT RAIL vs. COMMUTER RAIL Light Rail: Electric powered trains operating on new tracks in a grade-separated dedicated right-of-way Cost: $70-$80 million per mile Commuter Rail: Diesel-electric powered trains operating on existing freight tracks Cost: $20-$25 million per mile


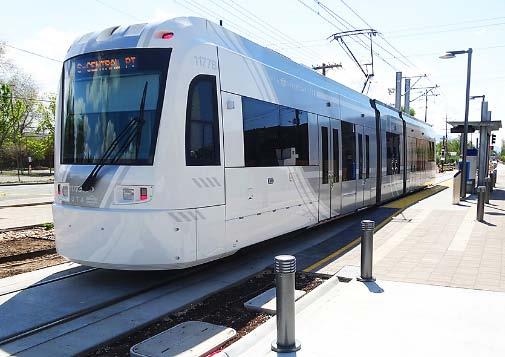
7 MODERN STREET CARS Dallas Atlanta Cincinnati Kansas City IMPORTANT LAST MILE COMPONENT


8 BENEFITS OF RAIL TRANSIT Provides safe, energy-efficient transportation system Generates economic development Enhances quality of life Reduces CO2 and ozone emissions Ensures economic competitiveness with peer cities attract and retain businesses, jobs and residents Protects our economic and transportation future from high fuel costs and time wasted in traffic Strong public support for rail transit


9 QUALITY OF LIFE BENEFITS Provides affordable, efficient transportation options for traveling to work, school, entertainment, medical offices, civic facilities, and other public destinations Improves personal mobility and freedom for all citizens Saves on fuel and maintenance costs by lowering vehicle miles traveled Reduces time spent in traffic, allowing more time for work, personal interests, or relaxation. Promotes better health by encouraging walking, biking, and daily exercise Eases traffic and congestion Improves air quality, health and the environment by lowering emissions Reduces stress related to transportation
10 ECONOMIC BENEFITS Stimulates transit oriented development Generates economic activity Raises property values Increases local and state tax revenues Enhances business, retail and entertainment districts Accelerates urban renewal and core area revitalization Attracts new residents and businesses Provides valuable cost savings for transit users


11 TRANSIT ORIENTED DEVELOPMENT Urban Renewal Core Revitalization Residential Development Retail Development Commercial Development Increased Business Revenue Increased Property Values Increased Tax Revenues Improved Quality of Life Denver Union Station Master Plan

12 SIGNIFICANT FISCAL IMPACT Dallas Area Rapid Transit (DART) Source: Center for Economic Development and Research, University of North Texas, 2007

13 INCREASED PROPERTY VALUES Dallas Area Rapid Transit (DART) Source: Center for Economic Development and Research, University of North Texas, 2014
14 TRANSIT WILL SPUR ECONOMIC GROWTH Milwaukee Journal Sentinel February 20, 2010 Economic development is about people. The better we move people, the more business we generate. Economic success in the 21st century requires making our region attractive to an educated workforce. Corporations have discovered that a good transit system is essential to recruiting such talent. Good transit is not a partisan issue.
15 NATIONAL TRENDS HOUSING AND TRANSIT Over the next 20 years, the housing market will be dominated by retiring Baby Boomers and a younger labor force with a preference for smaller households and access to transit. Transit system availability will become increasingly important in meeting the mobility needs of aging Baby Boomers Generation Y and Millennials have lower rates of car ownership and show a strong preference for urban style housing served by an effective transit system. As the U.S. labor force shrinks with the retirement of the Baby Boomers, availability of transit will be an important factor in retaining and attracting this young labor force, which will be critical to the economic success of businesses and cities. Source: Rail Transit In America: Comprehensive Evaluation of Benefits Victoria Transport Policy Institute, 2011
 studied urban areas such as Austin - where both bus")

16 USER COST SAVINGS Public transportation saves people time and money. American Public Transportation Association (APTA) studied urban areas such as Austin - where both bus and rail service are available to commuters - they observed the following: Per year, riders saved: 4,400 miles of driving 223 gallons of gas 273 hours stuck in traffic $10,000 in fuel and maintenance costs Source: American Public Transit Association

, especially during peak travel periods Reduced VMT growth translates into more efficient use of")
17 TRANSPORTATION SYSTEM BENEFITS Transit provides valuable transportation options and improves mobility Transit increases transportation system capacity without creating additional traffic and congestion Transit does not replace automobiles and roadways, but is an effective means to address traffic and congestion issues related to population growth Growing cities with premium transit have slower rates of growth in vehicle miles traveled (VMT), especially during peak travel periods Reduced VMT growth translates into more efficient use of transportation funds


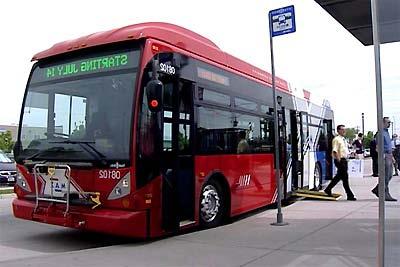
18 MODEL SYSTEM SALT LAKE CITY SALT LAKE CITY INTERMODAL HUB LIGHT RAIL MODERN STREETCAR COMMUTER RAIL ENHANCED BUS
 Lines 1 Buses 373 Light Rail Lines - 3 Light Rail Trains 16 Commuter Rail (Frontrunner) Lines 1 (88 miles Ogden-Salt Lake-Provo) Commuter Rail")
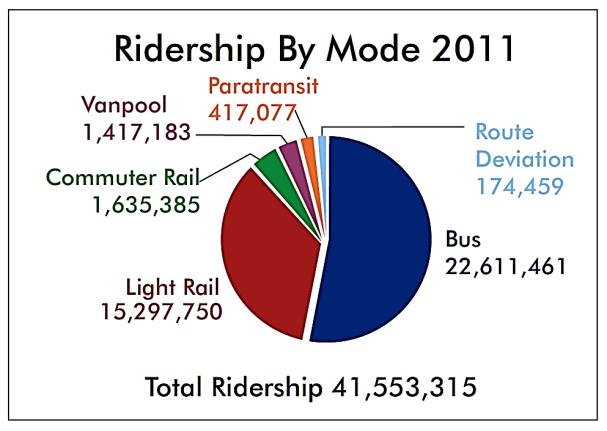
19 UTAH TRANSIT AUTHORITY Primary City: Salt Lake City RTA Created: 1970 Governance: 15-member Board appointed by municipal and county officials Funding: Dedicated Transit Sales Tax: % System: Bus Routes 131 Bus Rapid Transit (MAX) Lines 1 Buses 373 Light Rail Lines - 3 Light Rail Trains 16 Commuter Rail (Frontrunner) Lines 1 (88 miles Ogden-Salt Lake-Provo) Commuter Rail Trains 6 Ridership (2012): Bus 21,222,800 Light Rail 17,551,800 Commuter Rail 1,869,700 Van Pool/Paratransit 2,161,700 Total 42,806,000

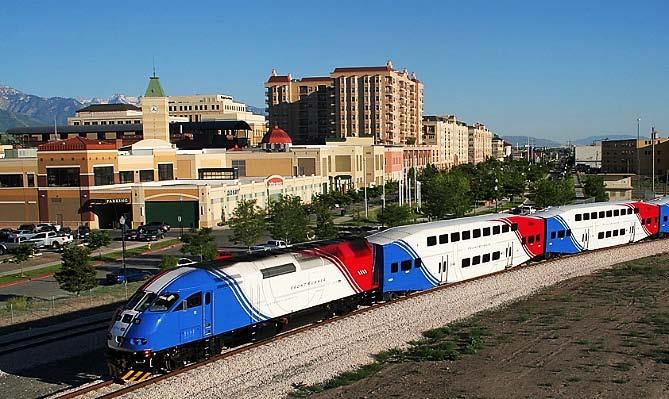
20 UTA FRONTRUNNER Connecting Salt Lake City, Provo and Ogden Intermodal Hub in downtown Salt Lake City Directly serves Hill Air Force Base 2011 Ridership: 1,600,0000
21 LESSONS FROM SALT LAKE CITY Salt Lake City's light rail streetcar and its integration with a commuter rail system serving outlying areas of the City and suburbs was particularly important to spurring private development. The linked rail and streetcar system helped inspire growth that also included people moving to downtown Salt Lake City about as fast as the city could handle. Our ridership has doubled projections. Rail transit is making a huge difference in both where people concentrate their economic investments, but also in relieving congestion and providing a pretty clear path to what our future of surface transportation will be. Comments by Salt Lake City Mayor Ralph Becker at 2012 OKC Mayor s Economic Development Roundtable


22 Dallas PUBLIC SUPPORT Seattle Charlotte Albuquerque Minneapolis
23 REGIONAL ADVANTAGE Competition is intensifying between cities and regions to create the amenities and the business climate that will attract highly skilled workers. Studies show that business locations near high quality urban settings with clean, efficient rail transportation are a priority for young knowledge workers who are choosing a job. "It is the ability to attract talent that creates regional advantage: Those that have the talent win, those that do not lose Richard Florida, Professor of Regional Economic Development at Carnegie Mellon University From Southeastern Wisconsin Coalition for Transit Now

24 PEER CITY TRANSIT SYSTEMS RAIL TRANSIT DEVELOPMENT 2012 SYSTEM RIDERSHIP Atlanta Denver Dallas St. Louis San Antonio Salt Lake City Austin Charlotte Phoenix Tucson Kansas City Cincinnati Memphis Oklahoma City Birmingham 131,126,600 86,659,700 69,414,200 47,218,700 47,147,100 42,806,000 35,672,800 26,411,600 24,525,100 20,225,300 16,506,500 16,356,900 10,305,700 2,934,700 2,892,100
25 OKC BACK OF THE PACK Oklahoma City ranked last out of 50 largest metropolitan areas as best prepared for $4 gasoline 1 Oklahoma City ranked 84 th out of 100 metropolitan areas in serving the transit needs of its workforce 2 Cause: Lack of regional transit system 1 From: Major US Cities Preparedness for an Oil Crisis: Which Cities and Metropolitan Areas are Best Prepared for $4 a Gallon Gasoline and Beyond. A Study by Warren Karlenzig of Common Current. March From: Missed Opportunity: Transit and Jobs in Metropolitan America. A Study by the Brookings Institute. May 2011


26 OKC TIME FOR REGIONAL TRANSIT Increasing peak hour traffic congestion and delays in all major transportation corridors Population growth above the national average with increasing VMT Significant job growth in core areas with increasing commute times for employees Urban core densification with substantial housing growth and a young work force population in need of access to regional transit
 and secure dedicated funding source Develop intermodal hub, commuter rail, streetcar and bus transit")
27 MAKING REGIONAL TRANSIT WORK Public, political and business support Establish Regional Transit Authority (RTA) Create Regional Transit District (RTD) and secure dedicated funding source Develop intermodal hub, commuter rail, streetcar and bus transit systems

28 OKC SUPPORT

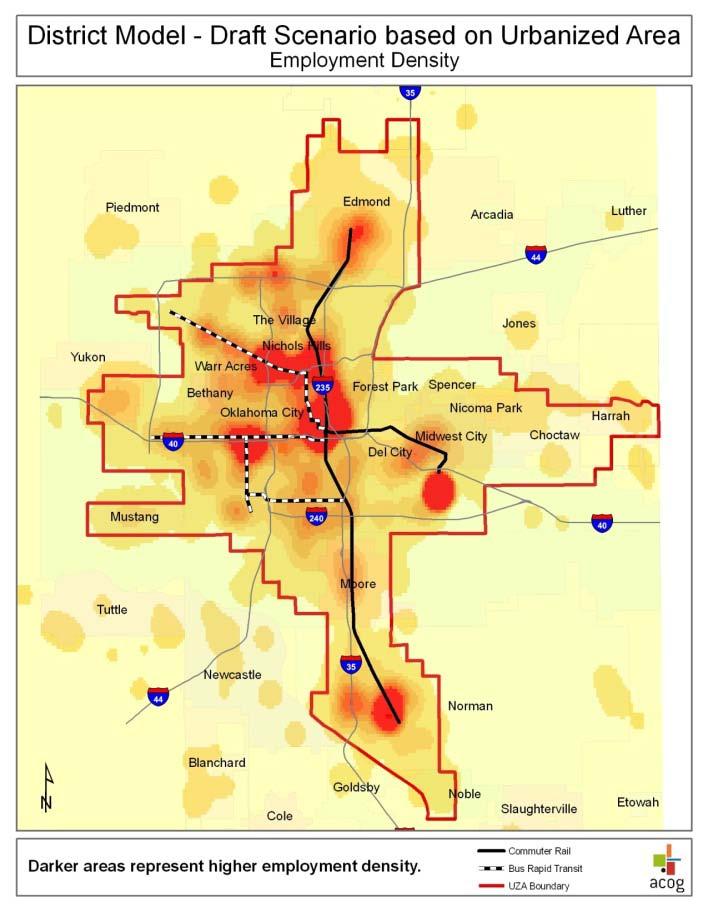
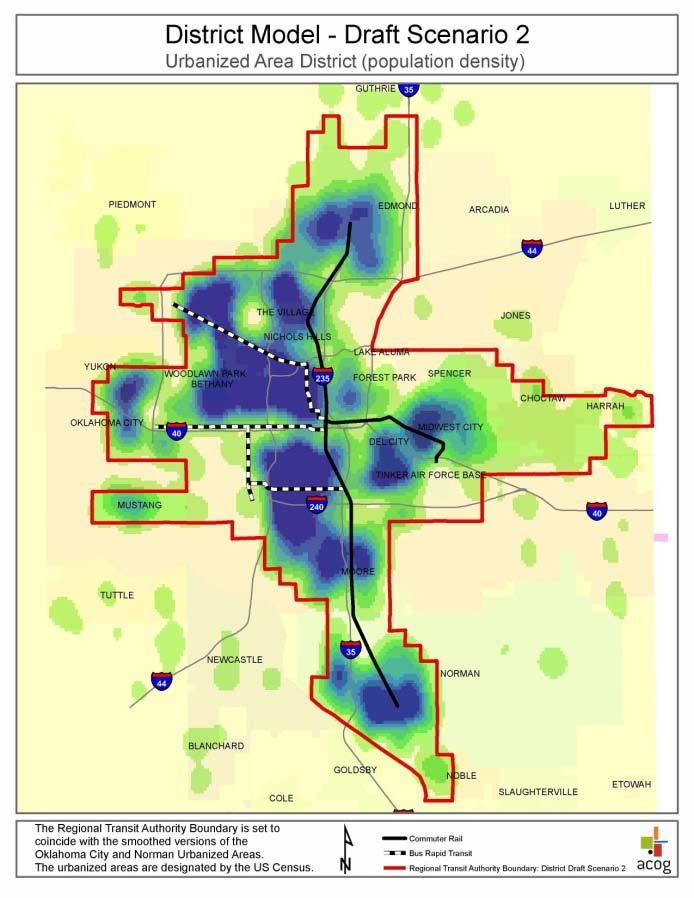
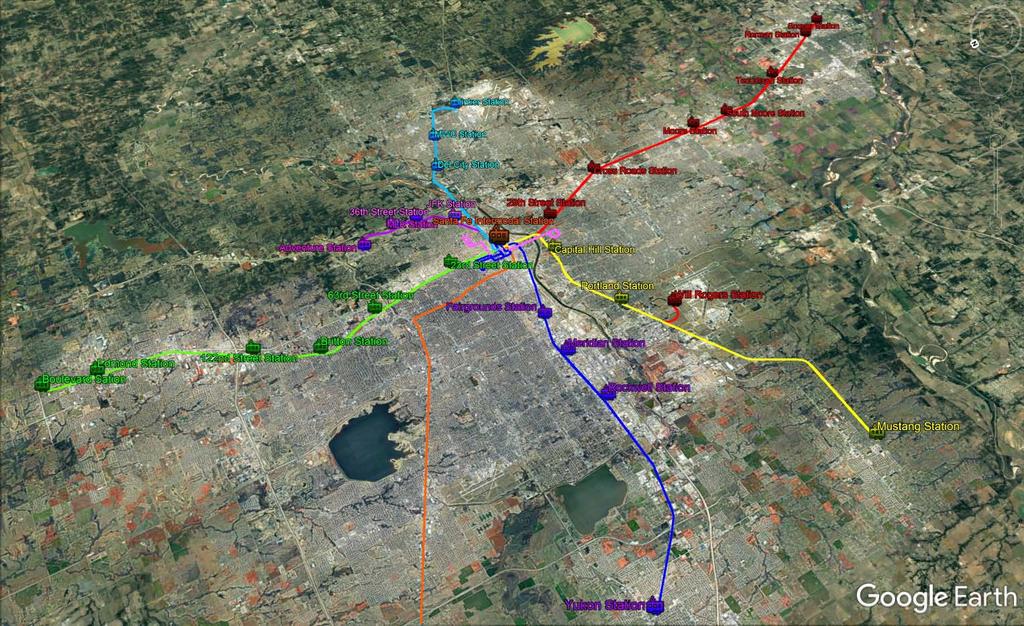
29 OKC METRO AREA RAIL NETWORK FOUNDATION OF A COMMUTER RAIL SYSTEM


30 COMMUTER RAIL Salt Lake City Frontrunner Albuquerque Rail Runner Minneapolis Northstar Affordable Comfortable Efficient

31 FIRST STEPS 2005 FIXED GUIDEWAY STUDY
32 BIG STRIDES OKC developing 4.5 mile - $110 million downtown modern street car system through MAPS 3 ACOG completed Intermodal Hub Study OKC acquired Santa Fe Station through MAPS 3 OKC redeveloping Santa Fe Station with $28.4 million in FTA, MAPS 3, ODOT, ACOG funding ACOG completed Commuter Corridor Analysis for OKC to Edmond, Norman and Midwest City ACOG developed framework for Regional Transit Authority and Regional Transit District OKC metro area cities authorized Regional Transit Authority Task Force to create RTA

33 MAPS 3 MODERN STREETCAR

34 STREETCAR SYSTEM PHASE 1 CONNECTING: HOUSING EMPLOYMENT RETAIL ENTERTAINMENT PUBLIC FACILITIES SERVING: DEEP DUECE BRICKTOWN SANTA FE STATION NEW CENTRAL PARK CHESAPEAKE ARENA NEW CONVENTION CENTER MYRIAD GARDENS CBD OKLAHOMA MEMORIAL ST. ANTHONY S HERITAGE HILLS AUTOMOBILE ALLEY

35 SANTA FE INTERMODAL STATION

 Bus Rapid Transit to West, Northwest, Southwest and")
36 COMMUTER CORRIDORS STUDY Commuter Rail between OKC, Edmond, and Norman Streetcar to Midwest City Streetcar Extension North on Classen to NW 63rd 40-50% increase over combined Local Bus Services (COTPA, CART, Citylynk) Bus Rapid Transit to West, Northwest, Southwest and Airport

37 REGIONAL TRANSIT DIALOGUE

38 REGIONAL TRANSIT AUTHORITY TASK FORCE OKC metro area mayors create RTA Task Force
39 BENEFITS OF ESTABLISHING AN RTA Create single governance structure for managing development and operation of regional transit system Formalize collaboration among cities in regional transit decisions, funding, operations and maintenance Provide transit services in an efficient, seamless manner Focus on regional transit perspective, rather than city by city, for a robust metropolitan-wide system Facilitate the implementation of a regional dedicated funding source for transit Improve ability to successfully compete for federal transit funding Coordinated planning for development near transit stations Provide single point of contact to work with large business, developers, universities, sports teams, and other major activity generators to enhance visitor experience with additional mode options 39
40 TIMELINE TO TRANSIT
41 ENVISIONING THE FUTURE