Evaluating and Forecasting Commodity Flows, Ontario
|
|
|
- Stanley Ray
- 5 years ago
- Views:
Transcription
1 Evaluating and Forecasting Commodity Flows, Ontario WSP Parsons Brinckerhoff MTO March 1 st, 2017
2 Team and Context
3 Just like it takes a village to raise a child it took a Team to build these models MTO WSP PB Rob Tardiff Shan Sureshan Sundar Damodaran Michael Casey Rick Donnelly Bryce Sharman Mausam Duggal

4 Context TRESO : Transportation and Economic Simulator of Ontario First generation and firstof-its kind provincial model to forecast passenger, freight, and commodity flows to and from Ontario and the rest of the world. Focus on maximizing the use of available data while maintaining behavioral linkages. Explicitly models commodity flows, longdistance and short distance truck flows, drayage, empty trucks, commodity mode choice.
5 Demand and Supply Data
6 Demand Data and lots of it Macroeconomic Firms Observed Commodity Flows GDP by NAICS Make Use Tables Firm Synthesis Truck Flows Rail Marine CSD Canadawide Six digit postal code Point Rail Zone Marine Port GDP by SCTG2 CSD Rail Yard
 and the GGH area (all road classes except for local roads) Outside Ontario but within Canada Arterial and above In the USA state")
 of DA generation algorithm (5400 zones) Quad Tree - GR Activity definition (dwelling units + truck stops)")
7 Supply Data Road network that covers all of North America with varying level of detail 120,000 links Greatest detail within CMAs (Ontario only) and the GGH area (all road classes except for local roads) Outside Ontario but within Canada Arterial and above In the USA state highways and above Zone system produced on the fly Initial attempt gradual rasterization algorithm (GR) or Quad Tree (6800 zones) Final attempt gradual aggregation (GA) of DA generation algorithm (5400 zones) Quad Tree - GR Activity definition (dwelling units + truck stops) TAZs - GA
8 Commodity Flow Model
9 Commodity model flow chart 2011 Transport Canada 2012 CVS Marine Rail Truck Disaggregate rail commodities Base-year marine Base year containerized rail Base year bulk rail Base year truck GDP Projections Make & Use Tables Lever set - 1 Lever set - 2 Forecast future-year commodity flows Forecasted marine (Port) Forecasted containerized rail (Rail yard) Forecasted bulk rail (Rail yard) Forecasted truck (CSD)


 Rail/Marine bulk flag (0/1) Drayage flag (0/1) Rail yard proportion of")
10 Commodity model highlights Designed to be a plug-and-play tool i.e. multiple scenario evaluation capability Eight degrees of freedom or levers for scenario analysis GDP by industry (from macro-economic model) Make and use tables Rail/Marine containerization flag (0/1) Rail/Marine bulk flag (0/1) Drayage flag (0/1) Rail yard proportion of commodities within rail zone (0-1) Commodity containerization ratio (0 1 for each SCTG2 commodity) Relative value-to-weight ratio, by year


11 2011 Commodity Flows visualized Common reporting framework
12 2011 Commodity Flows visualized - Sankeys Truck flows from ROW to Ontario Rail bulk flows from Ontario to ROW
13 Long Distance Model
14 Long-distance truck model Non and unobserved SCTG2 trucks Truck Forecasted from CF model flows Marine Rail Lever set - 1 Lever set - 2 Forecasted using Ontario GDP growth Convert truck tonnage to daily medium / heavy trucks Convert tonnages to daily trucks at RYs and MPs Disaggregate trucks from CSDs to zones (without SCTG2) Disaggregate trucks from CSDs to zones (with SCTG2) Disaggregate trucks to and from each RY/MP Empty truck trip model Apportion to different times of the day
 framework Designed to be a plug-and-play tool i.")


15 Long Distance Truck model highlights Agent-based (firms) framework Designed to be a plug-and-play tool i.e. multiple scenario evaluation capability Six degrees of freedom or levers for scenario analysis GDP ratios Proportion of medium trucks Conversion from source units to days Synthetic firms Empty truck model function decay parameters Breakdown by med/heavy trucks, and domestic/international Time of day profiles by distance via GPS processing

16 2011 Long Distance truck flows visualized
17 Forecast Commodity Flows sneak peek

18 GDP by NAICS projections

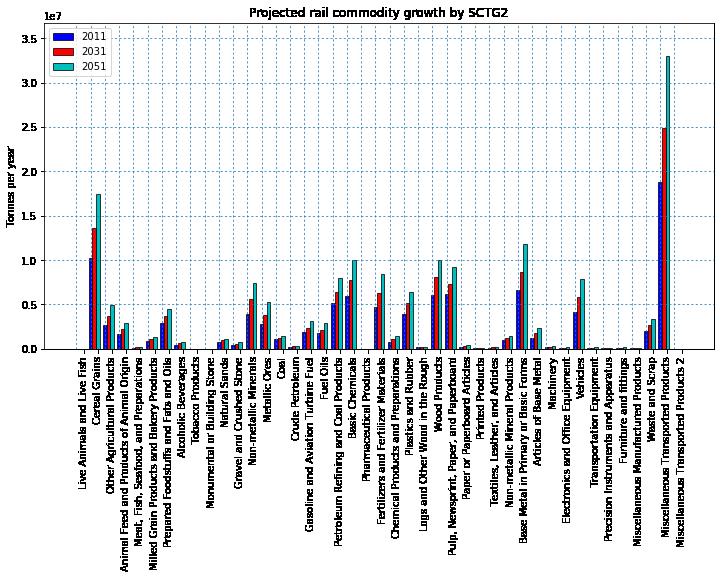

19 Commodity Growth Projections Marine Rail

20 Commodity Growth Projections Intermodal Rail Bulk Rail


21 Commodity Growth Projections Intra-Ontario Inter-Ontario
22 Lessons learnt
23 We are really excited about Increasing the leverage of the GPS truck processing by tying it to firms commodities MATSIM - every truck represented as an individual point on the network with ALL information Continuing to expand the CVS amazing dataset Continuing to move towards an agent based framework MATSIM is the ultimate goal TRESO has already made the first forays.
24 Questions?