World Agricultural Supply and Demand Estimates
|
|
|
- Allen Allan Nicholson
- 5 years ago
- Views:
Transcription


1 World Agricultural Supply and Demand Estimates Report of Interagency Commodity Estimates Committee Forecasts World Agricultural Outlook Board, Chairing Agency Economic Research Service Foreign Agricultural Service Farm Service Agency Agricultural Marketing Service

2


3 Links to the latest WASDE related publications Office of the Chief Economist World Agricultural Outlook Board (WAOB) WASDE: World Agricultural Supply and Demand Estimates Secretary's WASDE Briefing Slides Foreign Ag Service: World Agricultural Production Weekly Weather and Crop Bulletin US Drought Monitor ( in cooperation with NOAA and NDMC)
4 World Wheat Production Country or Region estimate 2018/2019 forecast September Million Tons World United States Foreign Argentina Canada Australia European Union Turkey Russia Ukraine Kazakhstan China India Northwest Africa No change.
5


6 Since the September WASDE report, the weather has been exceptionally dry throughout the wheat belt. Percent of Normal Rainfall September 2018


7 Early October rainfall has helped stabilize conditions in the west but has come much too late to benefit wheat in the east. Cumulative Rainfall Oct 1 10, 2018


8 Additionally, temperatures dipped below freezing on several nights. The frost likely had minimal impact on drought-plagued crops in the east but in WA & SA, the frost may have negatively impacted yield potential. Minimum Temperature September 2018
9 Australia Wheat Production and Yield Wheat Prod'000 Tons Yield tons per hectare / / / / / AS Wheat Prod AS Wheat Yield Foreign Agricultural Service Office of Global Analysis IPA Division
10 World Wheat Supply and Use Item estimate 2018/2019 forecast September Million Tons Beginning stocks Production Total Supply 1, , Feed use Total use Trade Ending Stocks
11 U.S. Wheat Supply and Demand Item 2018/2019 Estimate September 10 Forecast September 10 Planted area (million acres) 46.0 ** 47.8 ** 1.8 Harvested area (million acres) 37.5 ** 39.6 ** 2.1 Yield (bushels per acre) 46.3 ** Million bushels Beginning stocks 1, , Production 1, , Imports Total supply 3, , Food use Seed Feed and residual Domestic use 1,078 ** 1, Exports , Total use 1,979 ** 2, Ending stocks 1, Percent Stocks to use ratio Dollars per bushel Average market price / No change. ** Rounds to zero.
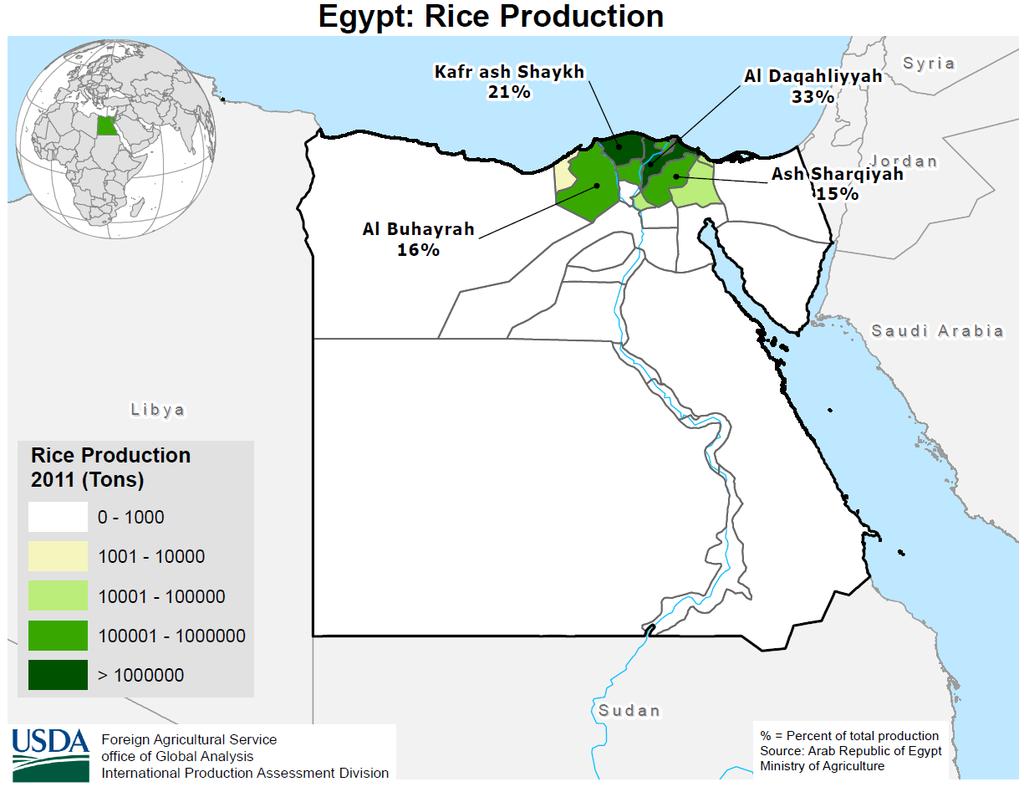
12 Country or Region World Rice Production 2018/2019 Estimate September 10 Forecast September Million Tons World United States ** 1.3 Foreign Argentina 0.9 ** ** Brazil ** Egypt Bangladesh Burma Cambodia China India Indonesia Japan Sri Lanka Pakistan Philippines Thailand Vietnam No change. ** Rounds to zero.

13 Egypt Desert Vegetation Landsat NDVI composite: Aug 1 30, 2018.
14

15 Field Size Less than 1 Hectare Threshed rice Threshed rice Threshed rice Threshed rice Photo: September 2, 2018 by FAS Staff

16 USDA/FAS Production, Supply, and Distribution Database Current legal limit (346.5 thousand hectares)
17 Item World Rice Supply and Use estimate 2018/2019 forecast September Million Tons Beginning stocks Production Total Supply Total use Trade ** 1.3 Ending Stocks ** Rounds to zero.
18 U.S. Rice Supply and Demand Item estimate 2018/2019 forecast September 10 Planted area (million acres) Harvested area (million acres) Yield (bushels per acre) 7,507 7, Million cwt Beginning stocks Production Imports Total supply Domestic use Exports Total use Ending stocks Percent Stocks to use ratio Dollars per cwt Average market price / No change.
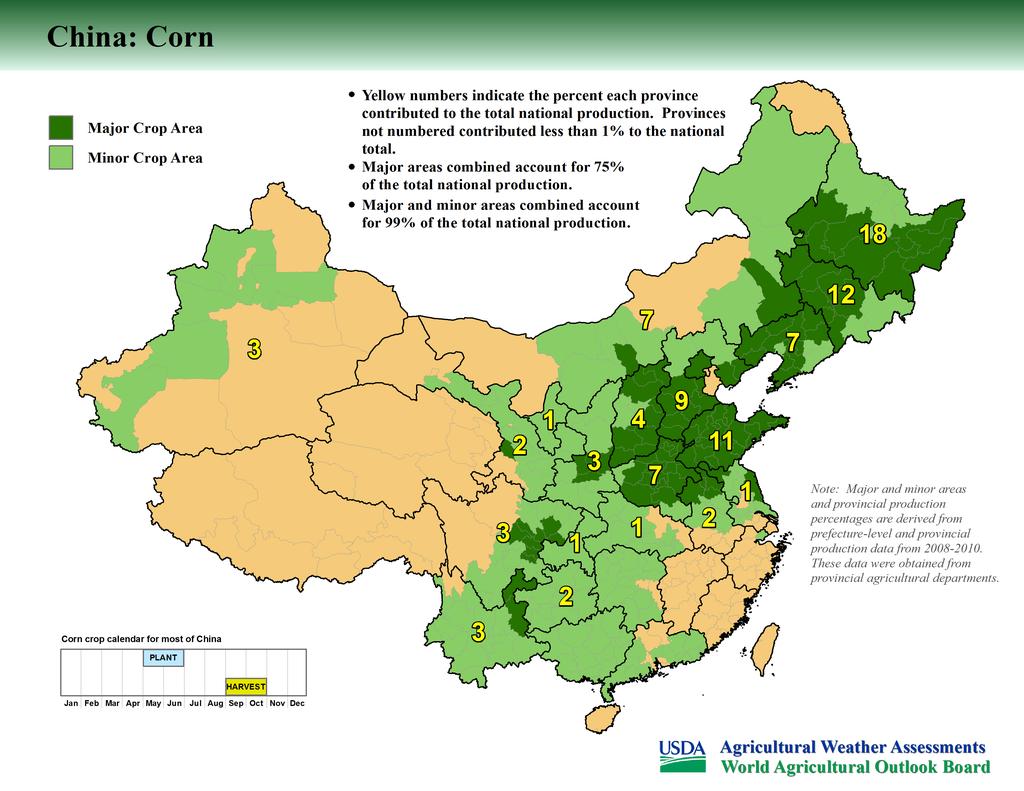
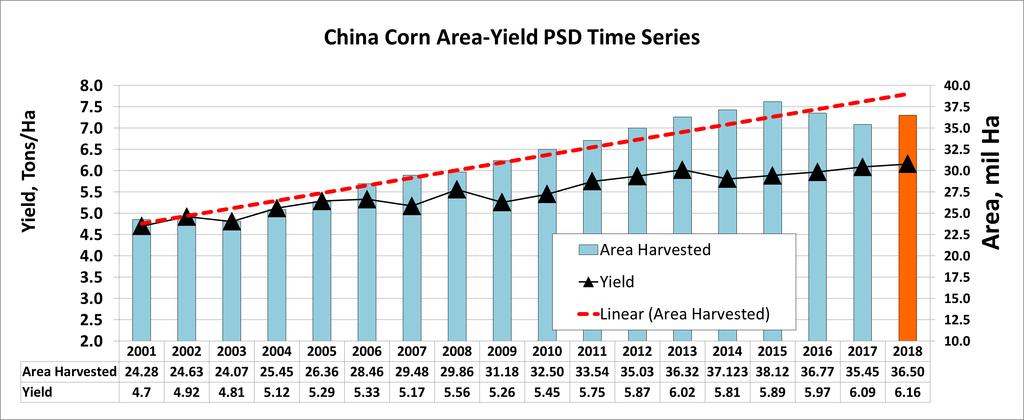
19 Country or Region World Corn Production estimate 2018/2019 forecast September Million Tons World 1, , United States Foreign Argentina Brazil Mexico Canada European Union Serbia FSU Ukraine Russia South Africa China India No change.
20


21 Northeast China : Liaoning-Jilin Heilongjiang Provinces: 2018/19 Corn: Jilin Heilongjiang Heilongjiang Liaoning Photos: FAS Staff, September 2018
22 Favorable rainfall in key growing areas.
23 Pockets of drier conditions.
24
25 World Corn Supply and Use Item estimate 2018/2019 forecast September Million Tons Beginning stocks Production 1, , Total Supply 1, , Feed use ** 27.6 Total use 1, , Trade Ending Stocks ** Rounds to zero.
26 U.S. Corn Supply and Demand Item 2018/2019 Estimate September 10 Forecast September 10 Planted area (million acres) ** -1.0 Harvested area (million acres) ** -0.9 Yield (bushels per acre) Million bushels Beginning stocks 2, , Production 14, , Imports Total supply 16, , Feed and residual 5, , Food, seed, and industrial 7, , Ethanol 5, , Domestic use 12, , Exports 2, , Total use 14, , Ending stocks 2, , Percent Stocks to use ratio Dollars per bushel Average market price / No change. ** Rounds to zero.
27 World Soybean Production 2018/2019 Country or Region Estimate September 10 Forecast September Million Tons World United States Foreign Argentina Brazil Paraguay ** Canada India China No change.
28 World Soybean Supply and Use Item 2018/2019 Estimate September 10 Forecast September Million Tons Beginning stocks 96.7 ** ** Production Total Supply Crush Total use ** 16.2 Trade Ending Stocks Addendum Beginning stocks Argentina plus Brazil 61.9 ** Imports* China *From all sources. -- No change. ** Rounds to zero.
29 U.S. Soybeans Supply and Demand Item 2018/2019 Estimate September 10 Forecast September 10 Planted area (million acres) Harvested area (million acres) Yield (bushels per acre) Million bushels Beginning stocks Production 4, , Imports 22 ** Total supply 4, , Crush 2,055 ** 2, Seed and Residual ** 26 Domestic use 2, ,208 ** 41 Exports 2, , Total use 4, ,268 ** -28 Ending stocks Percent Stocks to use ratio Dollars per bushel Average market price / No change. ** Rounds to zero.
30 2018/19 Soybean Outstanding Sales, As of September 27 Million Metric Tons China Unknown Rest of World / / / / / /19
31 $/MT 460 U.S. and Brazilian Soybean Prices Paranagua U.S. Gulf Source: IGC Jan Feb Mar Apr May Jun Jul Aug Sep Oct
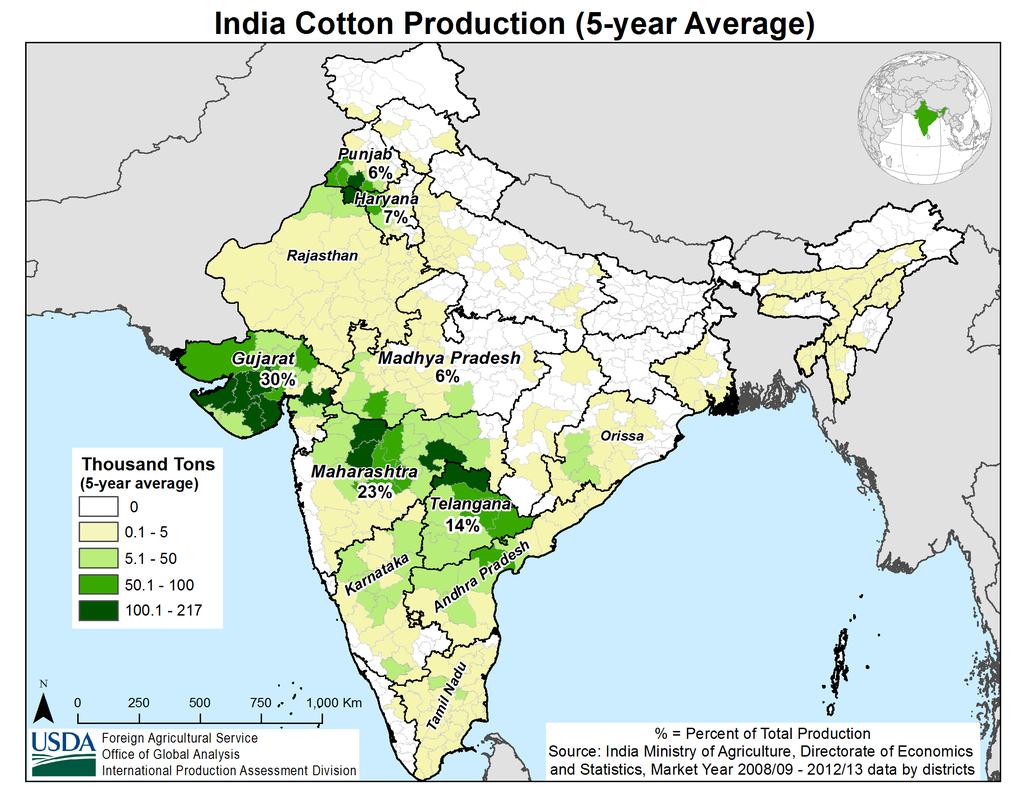
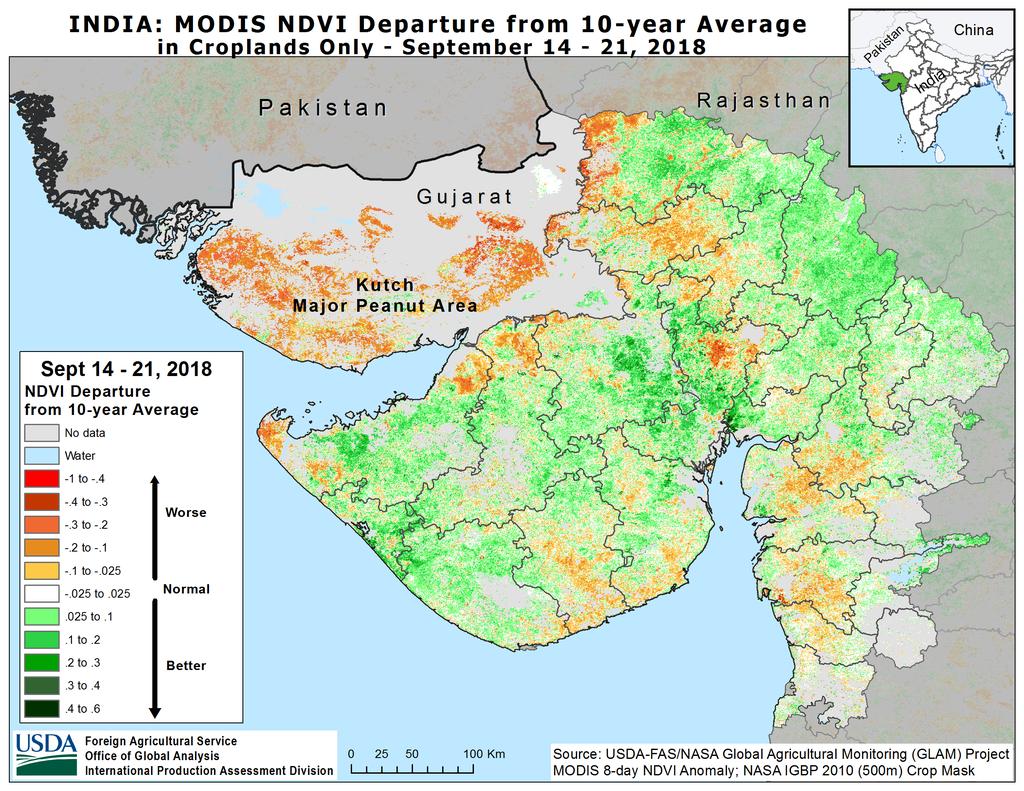
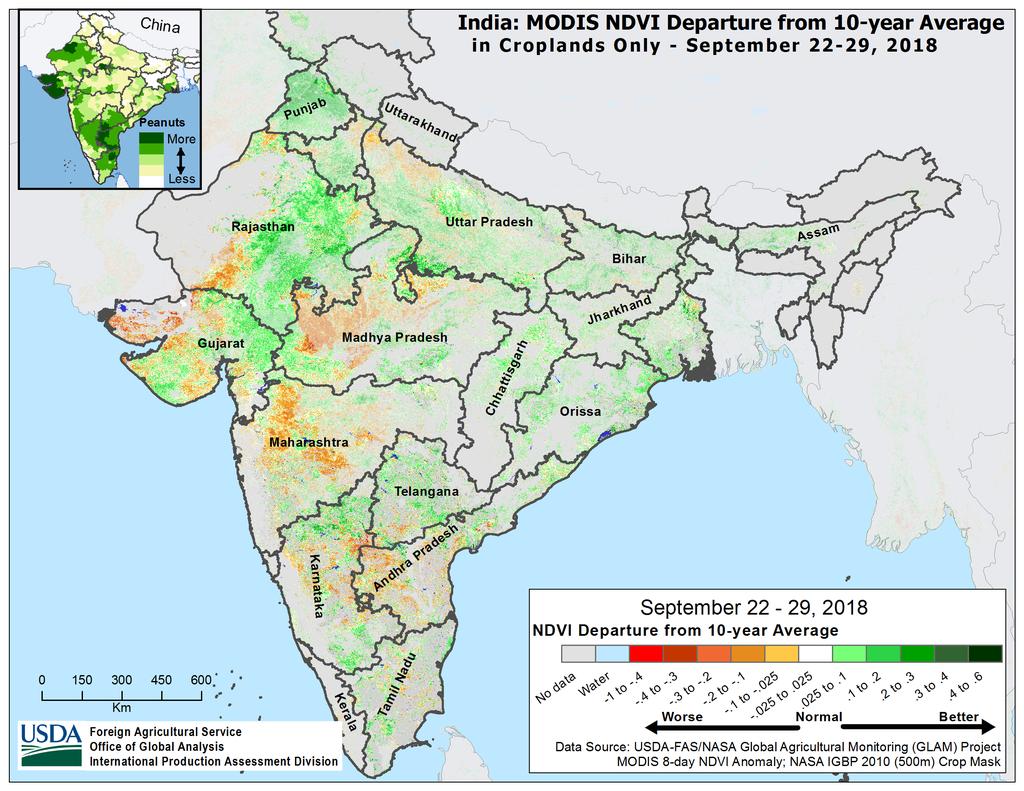
32 Country or Region World Cotton Production estimate 2018/2019 forecast September Million bales World United States Foreign Argentina Brazil Turkey Australia China India Pakistan Uzbekistan Turkmenistan African Franc Zone
33

34 Inconsistent seasonal rainfall throughout cotton areas. Major Cotton Area
35
36
37 India: Cotton Production Production (Million 480-pound Bales) e Source: USDA/FAS Production, Supply, and Distribution Database
38 World Cotton Supply and Demand Item estimate 2018/2019 forecast September Million bales Beginning stocks ** Production Total Supply Consumption Trade Ending Stocks Addendum China ending stocks No change.
39 U.S. Cotton Supply and Demand Item estimate 2018/2019 forecast September 10 Planted area (million acres) Harvested area (million acres) Yield (pounds per acre) Million bales Beginning stocks Production Imports ** Total supply Mill use ** 0.18 Exports Total use Unaccounted Ending stocks Percent Stocks to use ratio Cents per pound Average market price / No change. ** Rounds to zero.
40 U.S. Sugar Supply and Demand Item 2018/2019 Estimate September 10 Forecast September Thousand short tons, raw value Beginning Stocks 1, , Production 9, , Beets 5, , Cane 4, , Imports 3, , TRQ 1, , Re-export Mexico 1, High-tier Total Supply 14, , Exports Domestic deliveries 12, , Total use 12, , Ending stocks 2, , Percent Stocks/use ratio No change.
41 Mexico Sugar Supply and Demand Item 2018/2019 Estimate September 10 Forecast September Thousand metric tons Beginning Stocks 1, , Production 6, , Imports Total Supply 7, , Domestic Use 4, , Exports 1, , Total use 5, , Ending stocks 1, , No change.
42 U.S. Meat Production and Prices Item Estimate September 10 Forecast September Production Billion Pounds Beef Pork Broilers Turkey Total Meat Prices Dollars per cwt Steers Hogs Cents per pound Broilers 97.1 ** Turkey 81.1 ** No change. ** Rounds to zero.
43 Item Estimate U.S. Meat Trade Million Pounds September 10 Forecast September Exports Beef 3, , Pork 5, , Broilers 6, , Turkey Mature chickens 92 ** Total Meat 16, , Imports Beef 3, , No change. ** Rounds to zero.
44 Item U.S. Milk Supply and Demand Estimate September 10 Forecast September Billion pounds Production Fat Basis Imports Commercial use Exports Skim-solid Basis Imports Commercial use Exports No change.
45 Item U.S. Dairy Product Prices Estimate September 10 Forecast September Product prices Dollars per pound Cheese Butter ** 0.01 Nonfat dry milk 0.79 ** Dry whey Class prices Dollars per cwt Class III Class IV All milk No change. ** Rounds to zero.
46 Item U.S. Production Summary 2018/2019 Estimate September 10 Forecast September 10 Crops and Products Wheat (million bushels) 1, , Rice (million cwt) Corn (million bushels) 14, , Sorghum (million bushels) Barley (million bushels) Oats (million bushels) Soybeans (million bushels) 4, , Soybean oil (million pounds) 23, , Soybean meal (thousand s.t.) 49, , Cotton (million bales) Sugar (thousand s.t., raw value) 9, , Milk (billion pounds) Meat (billion pounds) Beef Pork Broilers Turkey Total Meat No change.
47 U.S. Domestic Consumption Summary Item 2018/2019 Estimate September 10 Forecast September 10 Crops and Products Wheat (million bushels) 1,078 ** 1, Rice (million cwt) Corn (million bushels) 12, , Sorghum (million bushels) Barley (million bushels) 158 ** Oats (million bushels) 146 ** Soybeans (million bushels) 2, ,208 ** 41 Soybean oil (million pounds) 21, , Soybean meal (thousand s.t.) 34, , ,000 Cotton (million bales) ** 0.18 Sugar (thousand s.t., raw value) 12, , Milk (billion pounds, fat basis) Meat (Billion pounds) Beef Pork Broilers Turkey 5.34 ** Total Meat No change. ** Rounds to zero.
48 Item U.S. Export Summary 2018/2019 Estimate September 10 Forecast September 10 Crops and Products Wheat (million bushels) , Rice (million cwt) Corn (million bushels) 2, , Sorghum (million bushels) 205 ** Soybeans (million bushels) 2, , Soybean oil (million pounds) 2, , Soybean meal (thousand s.t.) 14, , ,400 Cotton (million bales) Meat (Million lbs) Beef 3, , Pork 5, , Broilers 6, , Turkey Mature Chickens 92 ** Total Meat 16, , No change. ** Rounds to zero.
49 Item Price Summary 2018/2019 Estimate September 10 Forecast September 10 Crops and products Wheat ($/bu) Rice ($/cwt) Corn ($/bu) Soybeans ($/bu) Soybean oil ( /lb) Soybean meal ($/s.t.) 345 ** Cotton ( /lb) Livestock Steers ($/cwt) Hogs ($/cwt) Broilers ( /lb) 97.1 ** Turkeys ( /lb) 81.1 ** Dairy products Cheese ($/lb) Butter ($/lb) ** 0.01 Nonfat dry milk ($/lb) 0.79 ** Dry whey ($/lb) Milk classes Class III ($/cwt) Class IV ($/cwt) All milk ($/cwt) No change. ** Rounds to zero.