TU-C2020 OPERATIONS MANAGEMENT (5 cr) Inbound Logistics 29 Sep, 2017
|
|
|
- Paulina Blankenship
- 5 years ago
- Views:
Transcription
1 TU-C2020 OPERATIONS MANAGEMENT (5 cr) Inbound Logistics 29 Sep, 2017 Doctoral candidate, researcher Jari Laine Department of Industrial Engineering and Management
2 A Fast Moving Consumer Goods Supply Chain and its information flows Demand and Supply information Flow Money Flow Goods Flow 2
3 Demand Picture Demand Forecasts Statistical Heuristic Market sentiment Customer collaboration Order backlog/coverage Sell-through Channel stock POS deliveries Returns Campaigns Competitor info Marketing activities Pricing Tender coverage RFIs, RFQs 3

4 Supply Picture Availability Order status New products/versions Capacity loading Order backlog Re-scheduling Production lead times Production bottlenecks Special work arrangements Allocations Overstock info Contingency plans Quality issues Supplier bottlenecks Supplier lead times Transportation bottlenecks 4
 Demand visibility")
5 Incoming Materials Planning and Execution Process Material deliveries Material call-off signals ( Order ) Demand visibility info 5
6 Key points Sufficient Demand Visibility info is the key to keep the whole supply chain aware of the situation big picture Automated information (S2S) sharing with key suppliers is (still) dominating in volume operations Supplier web, Extranets, Excel spreadsheets and are used in more compact operations 6
7 Triggering the demand Execution i.e. triggering the materials replenishment can have multiple ways, e.g.: Deliveries against rolling forecast Automated signal generated by inventory re-order point Visual order (e.g. Kanban) VMI signal A order sheet Phone call (beware) 7
8 The life of an inventory, in theory Average Inventory 8
9 Types of Inventories Buffer (Safety) inventory Precaution for unpredictable demand increase/availability challenge Cycle inventory Batch production, between work phases (WIP) De-coupling inventory Between operations with different cycle times Anticipation inventory Build ahead in aticipation of predictable demand peak (e.g. seasonal Pipeline Inventory Goods in transit, not available immediately 9
10 How much to order? 10
11 The effect of order quantity to level of inventory 11
12 Economic Order Quantity (EOQ) Figure: Wikipedia as per : Economic order quantity (EOQ) is the order quantity that minimizes the total inventory holding costs and ordering costs. It is one of the oldest classical production scheduling models. The framework used to determine this order quantity is also known as Wilson EOQ Model, Wilson Formula or Andler Formula. The model was developed by Ford W. Harris in 1913, [1] but R. H. Wilson, a consultant who applied it extensively, and K. Andler are given credit for their in-depth analysis. [2] 12
13 What are the costs related Holding Cost Cost of capital employed (working capital) Storage & handling costs Risk of obsolecence Ordering Cost Cost of placing the order (office costs) Transportation cost Price (volume) discount costs 13
14 Criticism to EOQ Rather descriptive than precriptive use Static, reactive model Assumes that costs and conditions related are fixed Only cost view Lean/JIT philosophy are opposing due to missing improvement of processes 14
15 When to order? 15
16 Inventory Re-Order Level (ROL) ROL Drivers: Delivery Lead Time Consumption over time 16
17 Re-Order Point (ROP) Figure: 17
18 Summary of ROL, ROP Typically inbuilt in ERP/MRP sw as relehisment options. Can be used simultaneously Simplifications of real life: Assume constant demand Assume known delivery lead time Useful as in non-complicated environments Statistcal planning tools are replacing those ins complicated environments 18

19 From Inventory Control to ERP Cloud 19
20 Materials Requirement Planning (MRP), why? Ensure materials are available for production Ensure products are available for delivery to customers. Maintain the lowest possible material and product levels in store Plan manufacturing activities, delivery schedules and purchasing activities 20


21 Product Summary and Product Structure Product Summary 10-30% Product Structure 21
22 Product Master Data, example "Schneckengetriebe" by Thorsten Hartmann - Own work. Licensed under CC BY-SA 3.0 via Commons
 Picture source: Kentaro")
23 Towards Open, Digital and Modular BOM? Std. Module C Customized parts Std Module A Std Module B Common parts (product platform) Picture source: Kentaro Nobeoka, RIETI: 23
24 Net MRP in nutshell Master data Calculator X + - / % Working calendar and annual calendar BOM Sales volume/inventory schedule Inventories and open orders at hand X - = Net demand in time buckets 24
25 Role of the inventories (discussion) Speed (Quick Response) Flexibility Cost optimization Safety Synchronization of demand and supply or different operations Planning/Scheduling of operations phases and logistics 25
26 Disadvantages of Holding Inventory (Discussion) Lack of speed & flexibility Why? Cost Cost of capital employed Storage and handling Especially risk of obsolesence, price erosion 26
27 Central Issues In Management, recap Right materials Right time Right Place Optimum (?) between availability (service level) and total cost (ICC) 27
28 Typical metrics Total capital employed Inventory Rotation Days of Supply (DOS) Landed cost Price development Transportation & fwd cost Liability Slow movers% Obsolete% Work efficiency (receiving, picking lines/person/day Space utilization rate Quality reclaims & returns etc 28

29 ABC principle (Pareto analysis) Classification of value of consumption Value of inventory Number of items 29
30 ABC and XYZ analysis ABC/XYZ analysis is a method of grouping planning objects (characteristic value combinations, SKUs) based on their value (revenue or sales volume) and dynamics of consumption or sales. During the analysis, the planning objects are assigned one of the classes of ABC and XYZ simultaneously. Analysis based on value (ABC analysis) can be done by applying Pareto's rule on the value of individual items in a specific time horizon. The analysis ranks planning objects according to their value contributions in terms of sales or contribution margin. Analysis based on the dynamics of consumption (XYZ analysis) means the calculation of a variance coefficient of consumption or sales in a specific time horizon. For example, a planning object that has the values BY might mean a planning object with medium volume, and trend or seasonal demand. Source: SAP help portal 30
31 ABC + XYZ analysis, from cost contibution to right timing 31
32 LEAN and JIT, implications to inventory management, discussion Leveled, steady flow Elimination of all waste Continuos improvement Customer value Pull-principle Visual control Kanban 32
33 Central Issues in Inbound Logistics, discussion Responsiveness Delivery time Flexibility Rísk management Means of transportation Sustainability 33
34 A Fast Moving Consumer Goods Supply Chain and its information flows Demand and Supply information Flow Money Flow Goods Flow 34
35 OPP and Operational Choices OPP, order penetration point implies how deep into production the customer is visible. It shows where the customer order is attached into material flow. Engineering Purchasing Manufacturing Assembly FGI Make to stock (Ship to order) Assemble to order (ATO) / Build to order (BTO) Make to order (MTO) Engineer to order (ETO) / Purchase (buy) to order Variants: Pack-to-order, Configure-to-Order, Build-to-Forecast... Picture Source: Marja Blomqvist 9/28/

36 Use of Order Penetration Point (OPP) in strategic inventory planning 9/28/
 / Build to order (BTO) Make to order (MTO) Configure to order Engineer to order (ETO) / Purchase (buy) to order")
37 The impact of different operational choices Suppliers and subcontractors Factory/Manufacturing Center Outbound Warehouse/Distribution Center. Make to stock Ship to Order Assemble to order (ATO) / Build to order (BTO) Make to order (MTO) Configure to order Engineer to order (ETO) / Purchase (buy) to order Demand visibility info 37
38 Operational Choises vs. Distribution Channel Management 1. Fast Moving Consumer Goods 2. Durable Consumer Goods 3. Investment Goods 4. Process Industry 5. Construction & Infrastucture Business 38
39 1. Fast Moving Consumers Goods, e.g. Crocery Channel Management Priorities in Channel Management Availability (no empty shelves) Efficiency (cost of warehousing, transportation, capital, handling) Speed & Flexibility to react to changes Minimization of waste and loss (perishability!) Recycling (e.g. packaging material) Environment (CO2 emissions) 39
40 Example, groceries, traditional Operational Choice: STO Producer Factories Distribution/ Cross-Docking Centers Mass-Merchandisers, retailers, specialist shops Consumers Warehouse/ Distribution Center Planning, Forecasting & Replenishment Info 40
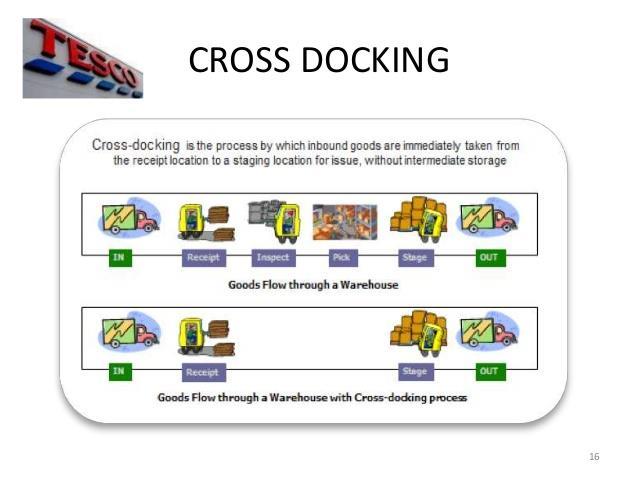
41 Cross Docking Source , 41

42 Collaborative Planning, Forecasting and Replenishment 42

43 Automated tracking & transaction management, e.g. RFID & GPS 43

44 Alternative Crocery Channel, how does it differ? 44


45 Omni Channel Retail Virtual Showrooms Brick & Mortar Enablers E-tailers 45
46 Emerging Omni Channel Management Retailers used to rely on barriers such as geography and customer ignorance to advance their positions in traditional markets. However, technology removes those barriers BRYNJOLFSSON, Erik; HU, Yu Jeffrey; RAHMAN, Mohammad S. Competing in the age of omnichannel retailing. MIT Sloan Management Review, 2013, 54.4:


47 Drop Shipments Order Order 47
48 Drop Shipments Drop shipping is a supply chain management technique in which the retailer does not keep goods in stock but instead transfers customer orders and shipment details to either the manufacturer, another retailer, or a wholesaler, who then ships the goods directly to the customer. As in retail businesses, the majority of retailers make their profit on the difference between the wholesale and retail price, but some retailers earn an agreed percentage of the sales in commission, paid by the wholesaler to the retailer. 48
49 Challenges of Drop Shipment Sharing and assuring accurate (real time) availability information from multiple locations Managing consolidation of shipment Timing Packing Cost of logistics Providing tracking info Managing returns and reverse logistics ->Sharing of margins and costs 49
50 2. Durable Consumers Goods, e.g. electronics Priorities in Channel Management Availability (no empty shelves) Efficiency (cost of warehousing, transportation, capital, handling) Speed & Flexibility to react to changes Minimization of waste and loss, controlled conditions and traceability (perishability, quality!) Recycling (e.g. packaging material), re-use, take back of electronics Environment (CO2 emissions) 50


51 Durable Consumer Goods Operational Choice STO, CTO Producer Factories Distribution/ Cross-Docking Centers Mass-Merchandisers, retailers, specialist shops Consumers, small businesses Warehouse/ Configuration Center Planning, Forecasting & Replenishment Info 51

52 Configure To Order Ability to fast configure a large number customized product variants out of a limited number of interoperable and standardized options. Related to mass-customization and postponement. Reduces efficiently working capital while still enabling fast delivery of customized products Modular Design! 52
53 3. Investment Goods, B2C, B2B Priorities in Channel Management Reliable delivery & service Adaptability to customer requirements (customization) Levelled capacity and resource loading (cost, quality) Life Cycle Cost & opportunities Sustainability 53


54 3. Investment Goods, B2C, B2B Operational Choice CTO, ATO, MTO Producer Factories Importers, distributors Dealers, B2B retailers, specialist stores, businesses Consumers, Businesses Planning and Forecasting & Order Info Order Info 54
55 4. Process Industry, B2C, B2B Priorities in Channel Management Reliable delivery & service Levelled capacity and resource loading (cost, quality) Safety & Sustainability Opportunity hunting (SPOT market) 55


56 Process Industry, example oil industry Operational Choice: STO, Mix-to-Order Producer Factories Importers, distributors Dealers, SPOT market, specialist stores, B2B Consumers, Businesses Planning, Forecasting & Replenishment/Order Info 56
57 4. Construction and Infrastucture Priorities in Channel Management (implementation phase) Project Management Network Management Planning & Scheduling Coordination of external resources Timing of main activities Timing and routing of goods deliveries (time slots at site, consolidation hubs) 3PL management TIMING & EXCEPTION management 57


58 5. Construction and Infrastructure Operational Choice: ETO, implementation phase = Project Delivery Project Office Consolidation Hubs, transport Construction Site Project status info, change requests, materials scheduling Sub-contractors 58
59 Thank you 59