Urban Arterial Roads Pavement Data Collection. October 23, 2012 Todd M. Halacy, P.E. VDOT Local Assistance Division
|
|
|
- Philomena Perkins
- 5 years ago
- Views:
Transcription
1 Urban Arterial Roads Pavement Data Collection October 23, 2012 Todd M. Halacy, P.E. VDOT Local Assistance Division
2 Presentation Topics Background Information: CTB Subcommittee & Local Government Workgroup Pavement data collection program Scope and how the data is collected Collection vehicle and detection mechanisms What distresses are collected How data is summarized QA of the data Brief discussion on the Pavement Management System Uses of pavement condition data in VDOT Data Collection Schedule Questions 2
3 CTB Subcommittee on Local Maintenance Payments The CTB meeting on July 20, 2011 established a subcommittee of the Board, which consists of all at-large members to: evaluate the issues surrounding equalization of maintenance fund allocations and to consider options which could be addressed administratively and legislatively to develop recommendations for the effective and equitable distribution of maintenance funds to present those recommendations to the Board on or before December 31, 2011 Resolution of the CTB in December 2011: An analysis and comparison of needs across systems is desired before recommending legislative changes Lack of available data on local system condition and performance limits further analysis The most equitable approach to distribution of scarce maintenance funding may be a formula that incorporates a prioritized needs-based factor along with a commitment to maintain our statewide assets, regardless of maintenance responsibility Reconvene the local government working group (in partnership with the Virginia Municipal League and Virginia First Cities Coalition) to advance the collection and analysis of system condition and performance data on the locally 3 maintained system
4 General Information: Local Government Workgroup Was comprised of 13 different localities, VDOT, the VA Municipal League, and the VA First Cities Coalition Met 4 times since January Sent out a survey to all 83 localities that maintain their own systems Survey Data: Included Questions Related to: Pavement Data Collection and Management Systems Traffic Signals Drainage Sidewalks Other Assets Maintained by the 83 Localities Compared the survey data to the annual Weldon Cooper Survey The existence of collected data varied greatly across jurisdictions Pavement was the top maintenance expense followed by traffic control operations and devices Survey also showed that localities that maintain their own systems pay a substantial amount towards maintaining other transportation assets 4
5 Local Government Workgroup (Continued) Recommendations: Focus on pavements Evaluated the benefits and cost of using VDOT s pavement data collection contract for preparing a snapshot of pavement data for arterial routes on the locally maintained system Would provide a consistent standard/protocol that would be used statewide The cost of the data collection is $250,000 Currently the Cities of Hampton and Colonial Heights are using VDOT s pavement data collection contract Schedule: Summer/ Fall 2012: Collect pavement data for arterial routes in all Cities/Towns Fall/ Winter 2012: Analyze and process the data Winter 2013: Reconvene the Local Government Workgroup Spring 2013: Report findings to the CTB In addition, the Local Government Workgroup will continue to evaluate other performance standards that can be utilized statewide in analyzing other transportation asset types 5
6 Scope of Pavement Data Collection Project Data collection is contracted out to Fugro-Roadware Automated data collection using digital images and automated crack detection methodology since 2006 Total collection for the Urban Arterial System Collection: Includes Principal and Minor Arterial Routes Will collect approx. 2,795 directional miles Cost: $250,000 Pavement data collection will be completed by February 2013 Total yearly collection for VDOT systems: approx. 20,400 directional miles Interstate: approx. 2,200 directional miles (100% of IS system) Primary: approx. 10,500 directional miles (100% of PR system) Secondary: approx. 7,700 directional miles (~20% of SC system) Secondary system is on a 5-year collection cycle 6
 Pavement Image recognition software Strobe-lit pavement video")
7 Photolog Single view Panoramic view 1300 x 1030 pixel 1920 x 1080 (HDTV) Direct-to-digital Custom angles Geometry & Spatial Inertial measurement unit HPMS curve type Long. Grade Cross slope Centerline mapping Spatial referencing for GIS integration Data Collection Vehicle Automatic Road Analyzer (ARAN) Pavement Image recognition software Strobe-lit pavement video Roughness Texture Rutting Surface Distress Ground Penetrating Radar Assets Inventory from imagery Location determined Offset measured Height and width measured Sign code recorded Condition assessment 7

8 Distance Measuring Instrument (DMI) DMI utilizes a precision optical shaft encoder that is mounted on the left rear driving wheel. The DMI records 2,000 pulses per revolution. Accuracy is ±0.02% of the linear distance traveled. Ensures accurate low speed roughness measurements down to 20 km/h (12.5 mph). 8

9 Pavement Images Rear downward facing cameras Continuous pavement images of full lane width Renders pavement distresses down to 2mm (0.08 inches) in width 9

10 Pavement Distress Marking 10


11 Laser Rut Measuring System Pair of rear mounted INO Lasers Measure full transverse profile of the road surface to over 1,200 points Transverse profile is evaluated to determine the depths of ruts 11


12 International Roughness Index (IRI) Laser SDP System 16 khz laser in each wheelpath Measures continuous longitudinal profile of the roadway 12


13 High Definition Right of Way Images True High Definition 1920 x 1080 CCD Camera Wide angle High Definition images A single image every 21 feet (variable) 13


14 GPS Data Real Time GPS Data Collection to ensure proper collection and referencing. Inertial referencing system allows for fill in of missing GPS data. 14
15 Distress Data Collected Asphalt Surfaced pavement Alligator Cracking Longitudinal Cracking Transverse Cracking Patching Potholes Delaminations Bleeding Rutting Rigid Pavement Jointed concrete pavement Continuously reinforced concrete pavements 15


16 Example of Alligator Cracking Alligator Cracking - Severity Level 3 16

17 Example of Transverse Cracking 17


18 Example of Longitudinal Cracking Longitudinal Cracking - Severity Level 2 18

19 Example of Patching 19

20 Example of Rutting An Example of Rutting 20
21 Data Summarization: Data Delivery Formats and Challenges Summarization of Production Data Split by road system Split by pavement type Asphalt Concrete Pavements (ACP) Bituminous Bituminous over Continuously Reinforced Concrete Bituminous over Jointed Reinforced Concrete Continuously Reinforced Concrete Pavement (CRCP) Jointed Concrete Pavement (JRCP) Delivered in 0.10 Mile and Summary Homogeneous Sections Challenges Weather Delays Data collection in NOVA and western Virginia difficult during winter months Sand/salt application; damp pavement; excessive rain GIS Network Definition Accuracy of network data is critical for processing 21
22 Data Summarization: Pavement Condition Indices Flexible Pavement Load Related Distress Rating (LDR) Alligator (Fatigue) Cracking, Wheel Path Patching, Rutting Non-load Related Distress Rating (NDR) Longitudinal and Transverse Cracking, Non-Wheel Path Patching, Bleeding The lower of the two index values is the Critical Condition Index (CCI) 22
23 Pavement Condition by CCI Index Pavement Condition Category based on CCI Excellent ( 90) Good (Between 70 and 89) Fair (Between 60 and 69) Poor (Between 50 and 59) Very Poor ( 49) Poor and Very Poor pavements are termed as deficient 23
24 Control Site Preliminary Data Collection 14 control sites Distributed across each system and pavement type Wide range of pavement conditions between sites Review of results from control sites by third party consultant Quality Engineering Solutions (QES): Establish precision and bias values for roughness and rutting measurements Calibrate the pavement distress rating process QES reviews against reference values based on average rating from four experienced raters Comparison of Individual Data Collection Vehicles to Reference Values At least 3 runs per site per truck Single truck results are reviewed for reasonableness and repeatability 24
25 QA, QC and IV&V of Production Data Project Quality Process Flow Diagram Start Up Process Control Sites Control Site Acceptance (VDOT) Production Data Collection Verification Sites Image Quality Field QC SOP Data Processing D-Rate WiseCrax QA Internal QA (RWG) A Deliverables Data Reports Documents No Deliverables QC Reports Deliverables QA Reports No No No A Independent Verification & Validation by QES 5% Data Review Data Completeness Index Limits Pass IV&V? (QES) Delivery to VDOT Deliverable Files via ftp Site Images via Portable Hard Drive Batch Acceptance (VDOT) PMS Database Video Database Deliverables IV&V Report Deliverable Tables Deliverables QA & IV&V Reports 0.10 mile Delivery Tbl Homogenous Section Delivery Tbl 25
26 Pavement Management System (PMS) A tool to store, analyze, summarize and report data Serves as a repository of inventory, history and condition data Used to identify M&R needs Used to develop budget requirements Used to answer where, when and what treatments are needed Used to export files for displaying maps in GIS 26
27 VDOT Data Reporting and Use for Interstate, Primary, and Secondary Data State of the Pavement Report and GIS maps Legislative reports on Infrastructure System Condition Report to CTB by the Commissioner HPMS data reporting to FHWA Report to the Dashboard Prepare yearly paving schedule Performance measure for districts 27
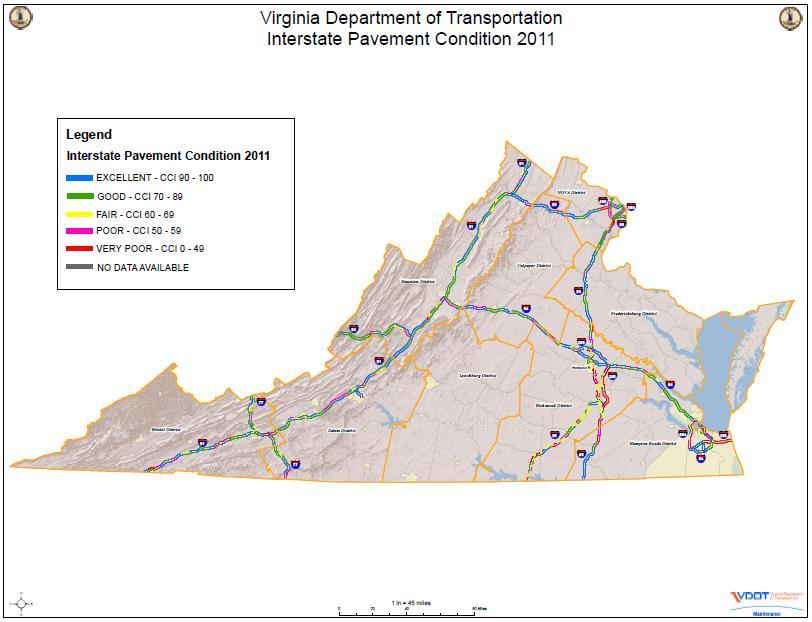
28 28
29 Production Data: Data Collection Schedule Fugro-Roadware s Data Delivery Schedule Collection Begins: October 15 th End of the paving season (November): Condition data reflects recent paving work Lane closures/deviations associated with construction are avoided Delivery of Condition Data VDOT: Interstate: April 15 th Primary: May 15 th Secondary: June 15 th Urban: February 28 th 29
30 Urban Arterial Roads Pavement Data Collection October 23, 2012 Todd M. Halacy, P.E. VDOT Local Assistance Division